Westlake Village, CA (California) Houses and Residents
| Westlake Village: | $1,329,867 |
| California: | $715,900 |
Mean price in 2022:
Detached houses: $1,924,787
Here: $1,924,787 State: $988,808 Townhouses or other attached units: $1,096,537
Here: $1,096,537 State: $838,546 In 3-to-4-unit structures: $584,120
Here: $584,120 State: $824,253 In 5-or-more-unit structures: $575,656
Here: $575,656 State: $730,996 Mobile homes: $756,956
Here: $756,956 State: $184,506
Total population: 8,473 (All urban)
Houses: 3,288 (3,151 occupied: 2,543 owner occupied, 620 renter occupied)
| % of renters here: | 20% |
| State: | 44% |
Housing density: 631 houses/condos per square mile
Median price asked for vacant for-sale houses and condos in 2022 in this county: $1,291,802.
Median contract rent in 2022: over $2,000 (lower quartile is over $2,000, upper quartile is over $2,000)
Median rent asked for vacant for-rent units in 2022: $52,105
Median gross rent in Westlake Village, CA in 2022: over $2,000
Housing units in Westlake Village with a mortgage: 1,551 (229 second mortgage, 5 home equity loan, 218 both second mortgage and home equity loan)
Houses without a mortgage: 11
Median household income for houses/condos with a mortgage: $195,775
Median household income for apartments without a mortgage: $170,027
Median monthly housing costs: $2,811
Compare current foreclosures near Westlake Village, CA:
| Photo | Address | Area | Beds / Baths | Price | Details |
|---|---|---|---|---|---|

|
#1
Triunfo Canyon Rd
Westlake Village, CA 91361
|
1,724 sq. feet
|
2 baths 3 beds |
show details | |

|
#2
White Stallion Rd
Westlake Village, CA 91361
|
9,735 sq. feet
|
5 baths 4 beds |
show details | |

|
#3
Evenstar Ave
Westlake Village, CA 91361
|
2,396 sq. feet
|
3 baths 3 beds |
show details | |

|
#4
Hartland Cir
Westlake Village, CA 91361
|
1,149 sq. feet
|
2 baths 2 beds |
show details | |

|
#5
Triunfo Canyon Rd
Westlake Village, CA 91361
|
2,491 sq. feet
|
3 baths 4 beds |
show details | |

|
#6
Upper Lake Rd
Westlake Village, CA 91361
|
3,073 sq. feet
|
3 baths 2 beds |
show details | |

|
#7
Pinecrest Rd
Westlake Village, CA 91361
|
3,933 sq. feet
|
4 baths 4 beds |
show details | |

|
#8
Winding Ln
Westlake Village, CA 91361
|
2,243 sq. feet
|
3 baths 3 beds |
show details | |

|
#9
Winding Ln
Westlake Village, CA 91361
|
2,752 sq. feet
|
3 baths 3 beds |
show details | |

|
#10
Manzanita Ln
Westlake Village, CA 91361
|
2,309 sq. feet
|
2 baths 3 beds |
show details |
| Photo | Address | Area | Beds / Baths | Price | Details |
|---|---|---|---|---|---|

|
#11
Glastonbury Rd
Westlake Village, CA 91361
|
2,038 sq. feet
|
2 baths 4 beds |
show details | |

|
#12
Fallview Rd
Westlake Village, CA 91361
|
1,991 sq. feet
|
2 baths 3 beds |
show details | |

|
#13
Galesmore Ct
Westlake Village, CA 91361
|
2,305 sq. feet
|
2 baths 4 beds |
show details | |

|
#14
Beachfront Ln
Westlake Village, CA 91361
|
1,753 sq. feet
|
2 baths 3 beds |
show details | |

|
#15
Lake Sherwood Dr
Westlake Village, CA 91361
|
2,788 sq. feet
|
3 baths 4 beds |
show details | |

|
#16
Foothill Dr
Westlake Village, CA 91361
|
3,077 sq. feet
|
3 baths 3 beds |
show details | |

|
#17
Snowpeak Dr
Westlake Village, CA 91361
|
3,127 sq. feet
|
3 baths 4 beds |
show details | |

|
#18
Bucksglen Ct
Westlake Village, CA 91361
|
2,357 sq. feet
|
3 baths 4 beds |
show details | |

|
#19
S Westlake Blvd, Ste 14 Pmb 1332
Westlake Village, CA 91361
|
- sq. feet
|
- baths - beds |
show details | |

|
#20
Townsgate Rd Ste 104
Westlake Village, CA 91361
|
- sq. feet
|
- baths - beds |
show details |
| Photo | Address | Area | Beds / Baths | Price | Details |
|---|---|---|---|---|---|

|
#21
S Westlake Blvd Unit A
Westlake Village, CA 91361
|
- sq. feet
|
- baths - beds |
show details | |

|
#22
E Thousand Oaks Blvd Unit 4281
Westlake Village, CA 91359
|
- sq. feet
|
- baths - beds |
show details | |

|
#23
Rolling Oaks Dr Ste 220
Westlake Village, CA 91361
|
- sq. feet
|
- baths - beds |
show details | |

|
#24
Townsgate Rd Ste 200
Westlake Village, CA 91361
|
- sq. feet
|
- baths - beds |
show details | |

|
#25
Hillsbury Rd
Westlake Village, CA 91361
|
- sq. feet
|
- baths - beds |
show details | |

|
#26
Valley Oak Lane
Westlake Village, CA 91361
|
- sq. feet
|
- baths - beds |
show details | |

|
#27
Hampshire Rd Apt 163
Westlake Village, CA 91361
|
- sq. feet
|
- baths - beds |
show details | |

|
#28
Hillsbury Rd
Westlake Village, CA 91361
|
- sq. feet
|
- baths - beds |
show details | |

|
#29
Clark St Unit 315
Tarzana, CA 91356
|
2,035 sq. feet
|
2 baths 2 beds |
show details | |

|
#30
Campus Park Dr Apt A
Moorpark, CA 93021
|
1,029 sq. feet
|
2 baths 2 beds |
show details |
| Photo | Address | Area | Beds / Baths | Price | Details |
|---|---|---|---|---|---|

|
#31
Fallbrook Ave
Woodland Hills, CA 91367
|
936 sq. feet
|
1 baths 2 beds |
show details | |

|
#32
Alamo St Unit 1
Simi Valley, CA 93063
|
531 sq. feet
|
1 baths 1 beds |
show details | |

|
#33
Emmett Ave
Simi Valley, CA 93063
|
1,446 sq. feet
|
2 baths 3 beds |
show details | |

|
#34
Farralone Ave
Woodland Hills, CA 91367
|
6,861 sq. feet
|
7 baths 7 beds |
show details | |

|
#35
Nita Ave
Woodland Hills, CA 91367
|
1,067 sq. feet
|
2 baths 2 beds |
show details | |

|
#36
Darlene Ln
Canoga Park, CA 91304
|
1,519 sq. feet
|
2 baths 4 beds |
show details | |

|
#37
Colony Dr
Camarillo, CA 93012
|
1,058 sq. feet
|
2 baths 3 beds |
show details | |

|
#38
Mclaren Ave
West Hills, CA 91307
|
2,211 sq. feet
|
2 baths 3 beds |
show details | |

|
#39
Archwood Ln Unit 166
Simi Valley, CA 93063
|
843 sq. feet
|
1 baths 2 beds |
show details | |

|
#40
Covello St
West Hills, CA 91307
|
2,504 sq. feet
|
3 baths 5 beds |
show details |
| Photo | Address | Area | Beds / Baths | Price | Details |
|---|---|---|---|---|---|

|
#41
Rambla Pacifico
Malibu, CA 90265
|
8,272 sq. feet
|
11 baths 7 beds |
show details | |

|
#42
Rowland Ave
Simi Valley, CA 93063
|
2,035 sq. feet
|
3 baths 4 beds |
show details | |

|
#43
Wisteria St
Simi Valley, CA 93063
|
1,536 sq. feet
|
2 baths 3 beds |
show details | |

|
#44
Quimby Ave
Canoga Park, CA 91304
|
1,342 sq. feet
|
2 baths 3 beds |
show details | |

|
#45
Community St
Canoga Park, CA 91304
|
2,363 sq. feet
|
2 baths 4 beds |
show details | |

|
#46
Schoenborn St
Canoga Park, CA 91304
|
4,416 sq. feet
|
8 baths 6 beds |
show details | |

|
#47
Camino Ruiz
Camarillo, CA 93012
|
1,328 sq. feet
|
2 baths 3 beds |
show details | |

|
#48
Oxnard St
Woodland Hills, CA 91367
|
1,195 sq. feet
|
1 baths 2 beds |
show details | |

|
#49
Califa St
Woodland Hills, CA 91367
|
1,401 sq. feet
|
2 baths 3 beds |
show details | |

|
Check over 1 million property listings on Foreclosure.com!
|
browse all offers | |||


 | Best Ways to Find Rentals in Westlake Village (4 replies) |
| Renting in Thousand Oaks or Westlake Village (5 replies) |
| Living in Westlake village (13 replies) |
| the impact of the NFL on the L.A. housing market (42 replies) |
| Where to live near Westlake Village (13 replies) |
| Weather San Fernando valley vs conejo valley (4 replies) |

Median year apartment built: 1974
Household type by relationship:
Households: 7,775- Male householders: 1,699 (290 living alone), Female householders: 1,348 (400 living alone)
1,889 spouses (1,875 opposite-sex spouses), 158 unmarried partners, (150 opposite-sex unmarried partners), 2,320 children (2,183 natural, 75 adopted, 61 stepchildren), 61 grandchildren, 28 brothers or sisters, 96 parents, 0 foster children, 57 other relatives, 40 non-relatives
- In group quarters: 75
Size of family households: 1,239 2-persons, 466 3-persons, 417 4-persons, 67 5-persons, 65 6-persons, 30 7-or-more-persons.
Size of nonfamily households: 740 1-person, 150 2-persons.
1,131 married couples with children.
193 single-parent households (35 men, 158 women).
84.7% of residents of Westlake Village speak English at home.
3.7% of residents speak Spanish at home (74% speak English very well, 25% speak English well).
6.7% of residents speak other Indo-European language at home (65% speak English very well, 32% speak English well, 2% speak English not well, 2% don't speak English at all).
5.2% of residents speak Asian or Pacific Island language at home (52% speak English very well, 37% speak English well, 9% speak English not well, 2% don't speak English at all).
1.4% of residents speak other language at home (84% speak English very well, 16% speak English not well).
Foreign born population: 1,232 (15.8%)
(86.8% of them are naturalized citizens)
| Here: | 6.7 |
| State: | 6.0 |
| Here: | 5.4 |
| State: | 3.9 |

- Bedrooms in owner-occupied houses and condos in Westlake Village, California
- 23no bedroom
- 181 bedroom
- 5312 bedrooms
- 5463 bedrooms
- 9274 bedrooms
- 4975+ bedrooms

- Bedrooms in renter-occupied apartments in Westlake Village, California
- 0no bedroom
- 681 bedroom
- 1572 bedrooms
- 1643 bedrooms
- 2024 bedrooms
- 295+ bedrooms

- Cars and other vehicles available in Westlake Village in owner-occupied houses/condos
- 86no vehicle
- 4251 vehicle
- 1,3402 vehicles
- 4683 vehicles
- 1704 vehicles
- 555+ vehicles

- Cars and other vehicles available in Westlake Village in renter-occupied apartments
- 64no vehicle
- 1591 vehicle
- 2482 vehicles
- 1493 vehicles
- 04 vehicles
- 05+ vehicles

- Rooms in owner-occupied houses in Westlake Village, California
- 231 room
- 122 rooms
- 513 rooms
- 2364 rooms
- 4795 rooms
- 3716 rooms
- 3237 rooms
- 3238 rooms
- 7259+ rooms

- Rooms in renter-occupied apartments in Westlake Village, California
- 01 room
- 102 rooms
- 1023 rooms
- 964 rooms
- 1185 rooms
- 916 rooms
- 1317 rooms
- 438 rooms
- 299+ rooms


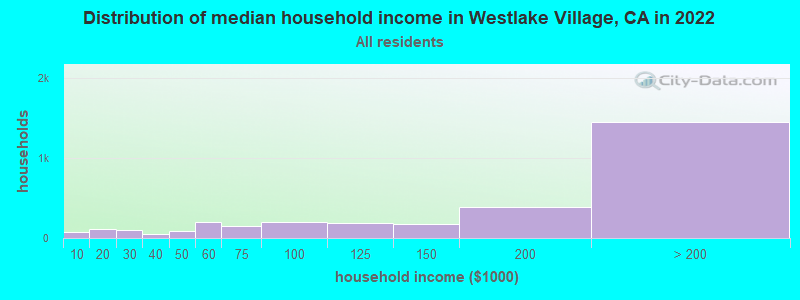
Westlake Village, CA household income distribution

- 73Less than $10,000
- 116$10,000 to $19,999
- 103$20,000 to $29,999
- 55$30,000 to $39,999
- 85$40,000 to $49,999
- 195$50,000 to $59,999
- 149$60,000 to $74,999
- 202$75,000 to $99,999
- 186$100,000 to $124,999
- 177$125,000 to $149,999
- 386$150,000 to $199,999
- 1,450$200,000 or more
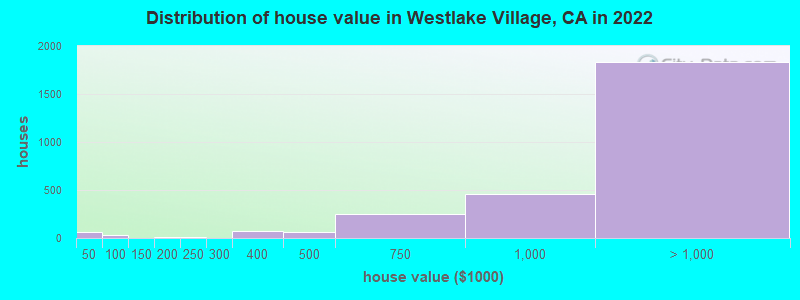
Home value of owner - occupied houses in 2022 in Westlake Village, CA
-
- 60Less than $10,000
- 12$60,000 to $69,999
- 20$90,000 to $99,999
- 6$175,000 to $199,999
- 9$200,000 to $249,999
- 72$300,000 to $399,999
- 58$400,000 to $499,999
- 254$500,000 to $749,999
- 462$750,000 to $999,999
- 746$1,000,000 to $1,499,999
- 729$1,500,000 to $1,999,999
- 356$2,000,000 or more
Rent paid by renters in 2022 in Westlake Village, CA
-
- 16$800 to $899
- 13$1,000 to $1,249
- 14$1,250 to $1,499
- 90$1,500 to $1,999
- 56$2,000 to $2,499
- 29$2,500 to $2,999
- 56$3,000 to $3,499
- 354$3,500 or more
- 15No cash rent


Percentage of workers working in this county: 65.2%
Number of people working at home: 1,148 (31.6% of all workers)
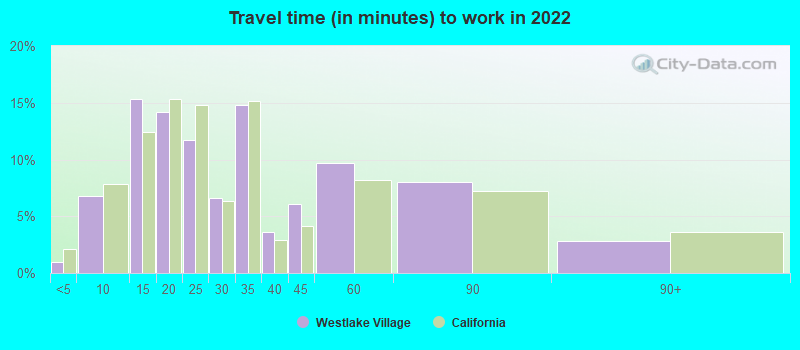
Travel time to work (commute)
- Less than 5 minutes: 110
- 5 to 9 minutes: 540
- 10 to 14 minutes: 513
- 15 to 19 minutes: 172
- 20 to 24 minutes: 331
- 25 to 29 minutes: 86
- 30 to 34 minutes: 257
- 35 to 39 minutes: 80
- 40 to 44 minutes: 34
- 45 to 59 minutes: 156
- 60 to 89 minutes: 260
- 90 or more minutes: 97
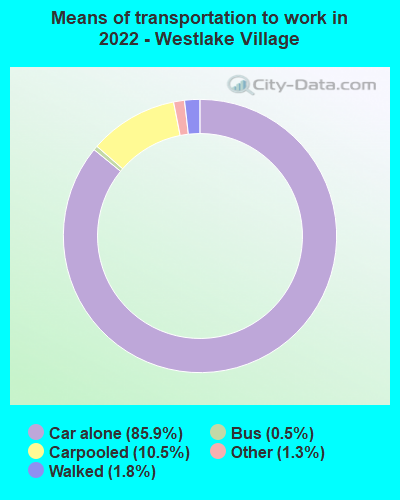
Means of transportation to work:
- Drove a car alone: 8,425 (75.0%)
- Carpooled: 1,134 (10.1%)
- Bus: 47 (0.4%)
- Taxi: 141 (1.3%)
- Bicycle: 8 (0.1%)
- Walked: 185 (1.6%)
- Worked at home: 1,148 (10.2%)

- Unemployment by race in 2022
- Unemployment rate for White non-Hispanic residents
- 2.9%Males
- 3.1%Females
- Unemployment rate for Black residents
- 25.2%Males

- Year of entry for the foreign-born population in Westlake Village, California
- 1722010 or later
- 992000 to 2009
- 1121990 to 1999
- 1671980 to 1989
- 5161970 to 1979
- 329Before 1970

First ancestries reported:
- Irish: 371 (10.3%)
- Iranian: 337 (9.4%)
- English: 331 (9.2%)
- European: 227 (6.3%)
- Italian: 221 (6.1%)
- German: 199 (5.5%)
- American: 146 (4.1%)
- Eastern European: 119 (3.3%)
- Russian: 78 (2.2%)
- Polish: 65 (1.8%)
- Ukrainian: 54 (1.5%)
- Israeli: 51 (1.4%)
- Scotch-Irish: 34 (0.9%)
- Scottish: 32 (0.9%)
- French: 27 (0.8%)
- Greek: 27 (0.8%)
- Hungarian: 18 (0.5%)
- British: 17 (0.5%)
- Swedish: 16 (0.4%)
- Croatian: 15 (0.4%)
- Romanian: 15 (0.4%)
- Dutch: 13 (0.4%)
- Lithuanian: 12 (0.3%)
- Welsh: 12 (0.3%)
- Armenian: 9 (0.3%)
- Serbian: 9 (0.3%)
- Austrian: 6 (0.2%)
- Belgian: 6 (0.2%)
- Norwegian: 6 (0.2%)
- Brazilian: 5 (0.1%)
- Canadian: 4 (0.1%)
- Swiss: 3 (0.08%)
- Northern European: 1 (0.03%)
Most common places of birth for foreign-born residents (%):
| Westlake Village: | 17.0% (210) |
| California: | 2.0% (206,004) |
| Westlake Village: | 12.1% (149) |
| California: | 1.7% (176,274) |
| Westlake Village: | 8.1% (100) |
| California: | 1.2% (127,477) |
| Westlake Village: | 6.2% (77) |
| California: | 0.6% (60,761) |
| Westlake Village: | 5.4% (66) |
| California: | 0.6% (60,582) |
| Westlake Village: | 5.0% (62) |
| California: | 0.3% (33,029) |
| Westlake Village: | 4.6% (57) |
| California: | 37.2% (3,881,193) |
| Westlake Village: | 4.0% (49) |
| California: | 3.0% (315,248) |
| Westlake Village: | 3.5% (43) |
| California: | 5.2% (539,184) |
| Westlake Village: | 3.2% (40) |
| California: | 0.1% (7,168) |
| Westlake Village: | 2.8% (35) |
| California: | 6.6% (684,672) |
| Westlake Village: | 2.1% (26) |
| California: | 0.7% (73,304) |
| Westlake Village: | 1.9% (24) |
| California: | 0.1% (11,157) |
| Westlake Village: | 1.6% (20) |
| California: | 0.6% (57,953) |
| Westlake Village: | 1.5% (19) |
| California: | 1.0% (103,575) |
Place of birth for U.S.-born residents:
- This state: 3,999
- Other state: 2,137
- Northeast: 780
- Midwest: 903
- South: 332
- West: 126
93.3% of Westlake Village residents lived in the same house 1 years ago.
Out of people who lived in different houses, 38.5% lived in this county.
Out of people who lived in different counties, 75.5% lived in California.
| Westlake Village: | 93.3% |
| State average: | 88.9% |
Education attainment for males 25 years and older:
- No schooling: 0
- Nursery to 4th grade: 0
- 5th and 6th grade: 0
- 7th and 8th grade: 0
- 9th grade: 0
- 10th grade: 10
- 11th grade: 0
- 12th grade, no diploma: 52
- High school graduate (or equivalency): 188
- Less than 1 year of college: 73
- Some college more than 1 year, no degree: 375
- Associate degree: 86
- Bachelor's degree: 1,345
- Master's degree: 467
- Professional school degree: 254
- Doctorate degree: 164

Education attainment for females 25 years and older:
- No schooling: 13
- Nursery to 4th grade: 0
- 5th and 6th grade: 17
- 7th and 8th grade: 57
- 9th grade: 6
- 10th grade: 6
- 11th grade: 6
- 12th grade, no diploma: 15
- High school graduate (or equivalency): 401
- Less than 1 year of college: 154
- Some college more than 1 year, no degree: 203
- Associate degree: 198
- Bachelor's degree: 1,179
- Master's degree: 437
- Professional school degree: 365
- Doctorate degree: 118


Housing units in structures:
- One, detached: 2,266
- One, attached: 566
- Two: 21
- 3 or 4: 88
- 5 to 9: 75
- 10 to 19: 70
- 20 to 49: 12
- 50 or more: 17
- Mobile homes: 169
Median worth of mobile homes: $757,635
House/condo owner moved in on average 17 years ago
Renter moved in on average 3 years ago

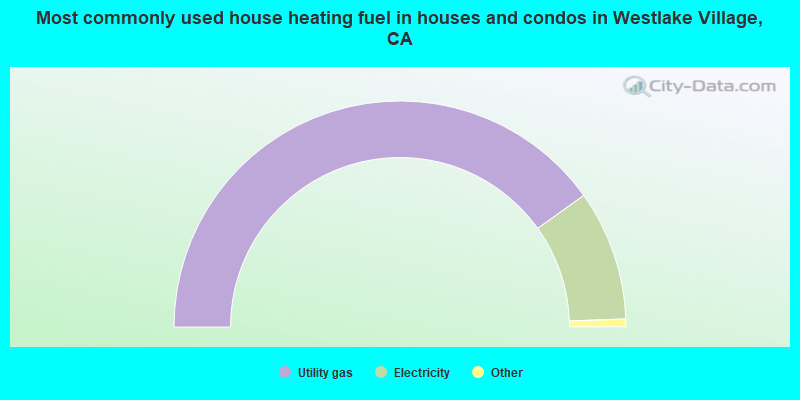
- 80.3%Utility gas
- 18.7%Electricity
- 0.8%Solar energy
- 0.2%No fuel used
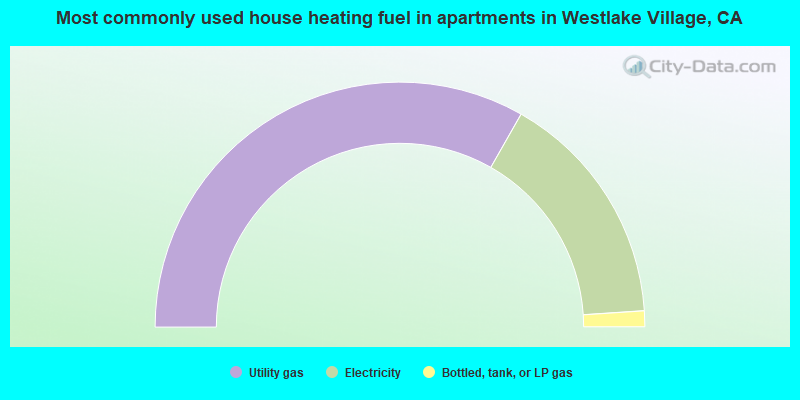
- 66.4%Utility gas
- 31.4%Electricity
- 2.1%Bottled, tank, or LP gas
Private vs. public school enrollment:
| Here: | 18.9% |
| California: | 10.5% |
| Here: | 18.6% |
| California: | 8.5% |
| Here: | 12.8% |
| California: | 15.9% |


