Housing density: 227 houses/condos per square mile
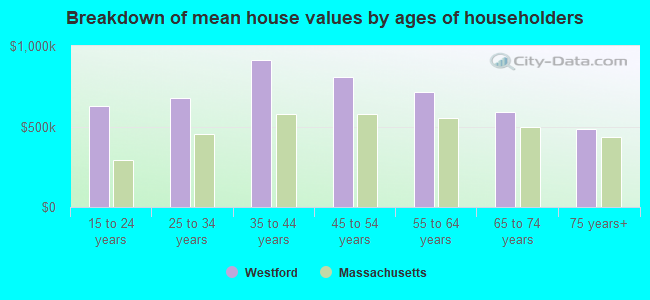
Median price asked for vacant for-sale houses and condos in 2022 in this county: $1,068,910.
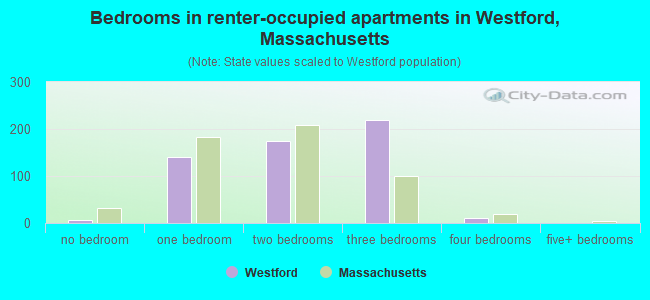
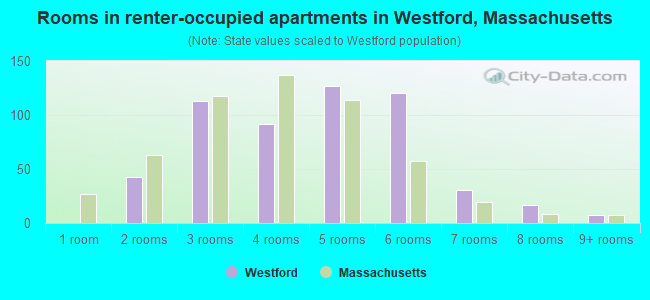
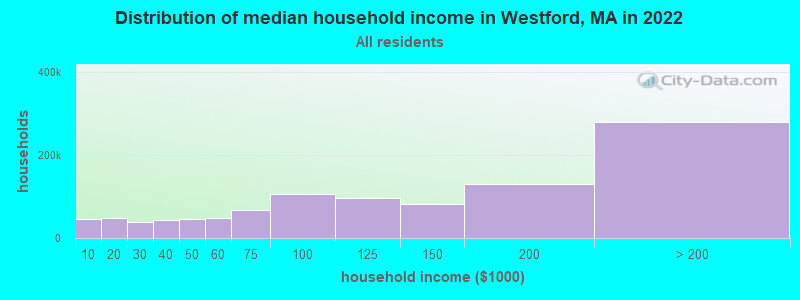
Median contract rent in 2022: $1,562 (lower quartile is $1,134, upper quartile is $1,882)
Median rent asked for vacant for-rent units in 2022: $1,006
Median gross rent in Westford, MA in 2022: $1,650
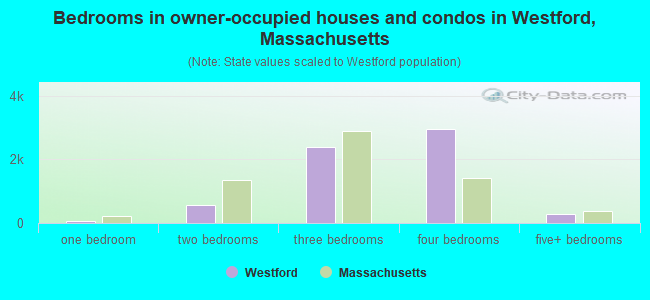
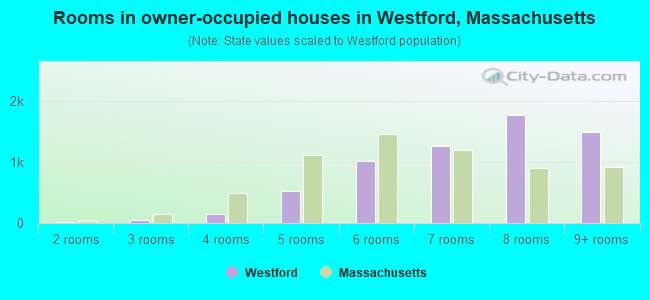
Housing units in Westford with a mortgage: 4,887 (383 second mortgage, 828 home equity loan, 9 both second mortgage and home equity loan) Houses without a mortgage: 967
In family households: 1,161,600 (250,263 male householders, 116,393 female householders)
287,332 spouses, 410,462 children (392,286 natural, 9,871 adopted, 8,305 stepchildren), 16,644 grandchildren, 14,569 brothers or sisters, 15,064 parents, foster children, 15,023 other relatives, 25,838 non-relatives
In nonfamily households: 286,073 (95,244 male householders (67,197 living alone)), 118,788 female householders (94,319 living alone)), 72,041 nonrelatives
In group quarters: 55,412 (13,773 institutionalized population)
252,928 married couples with children.
55,356 single-parent households (9,721 men, 45,635 women).
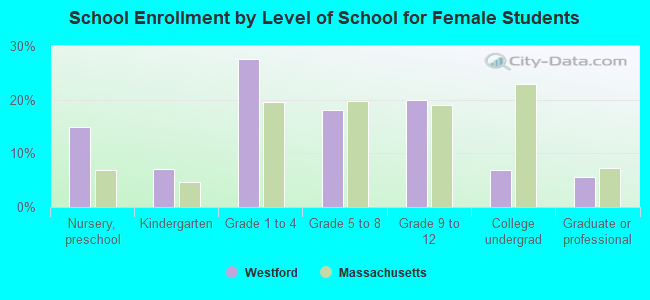
90.2% of residents of Westford speak English at home.
1.2% of residents speak Spanish at home (76% speak English very well, 19% speak English well, 5% speak English not well).
5.8% of residents speak other Indo-European language at home (83% speak English very well, 11% speak English well, 6% speak English not well).
2.6% of residents speak Asian or Pacific Island language at home (66% speak English very well, 29% speak English well, 4% speak English not well, 1% don't speak English at all).
0.3% of residents speak other language at home (100% speak English very well).
Foreign born population: 2,191 (9.6%)
(69.1% of them are naturalized citizens)
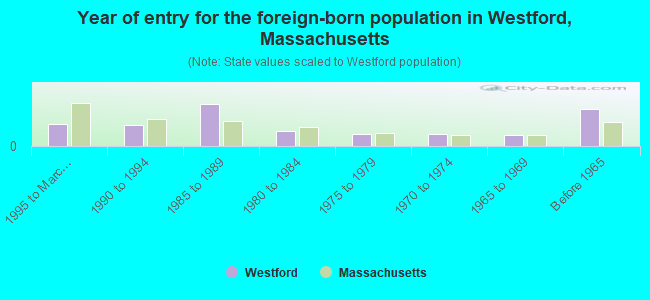
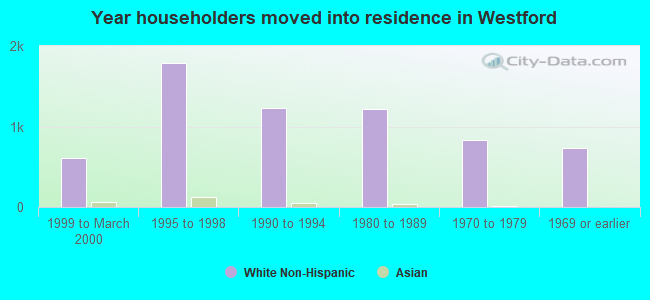
Year of entry for the foreign-born population in Westford, Massachusetts
1701995 to March 2000
1591990 to 1994
3211985 to 1989
1121980 to 1984
941975 to 1979
931970 to 1974
831965 to 1969
280Before 1965
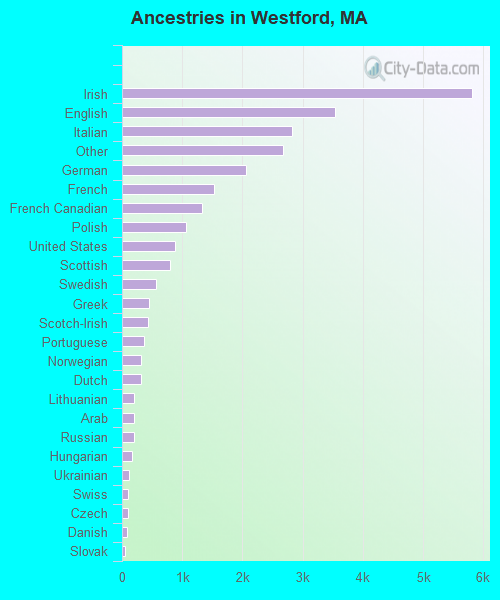
First ancestries reported:
Irish: 5,804 (22.1%)
English: 3,544 (13.5%)
Italian: 2,829 (10.8%)
Other: 2,680 (10.2%)
German: 2,051 (7.8%)
French: 1,528 (5.8%)
French Canadian: 1,334 (5.1%)
Polish: 1,071 (4.1%)
United States: 887 (3.4%)
Scottish: 796 (3.0%)
Swedish: 560 (2.1%)
Greek: 452 (1.7%)
Scotch-Irish: 424 (1.6%)
Portuguese: 362 (1.4%)
Norwegian: 322 (1.2%)
Dutch: 319 (1.2%)
Lithuanian: 195 (0.7%)
Arab: 193 (0.7%)
Russian: 192 (0.7%)
Hungarian: 169 (0.6%)
Ukrainian: 110 (0.4%)
Swiss: 102 (0.4%)
Czech: 92 (0.4%)
Danish: 83 (0.3%)
Slovak: 53 (0.2%)
Subsaharan African: 44 (0.2%)
Welsh: 41 (0.2%)
West Indian: 19 (0.07%)
Most common places of birth for foreign-born residents (%):
India
Westford:
16.8% (221)
Massachusetts:
3.6% (28,086)
China, excluding Hong Kong and Taiwan
Westford:
11.1% (145)
Massachusetts:
5.1% (39,255)
Canada
Westford:
9.9% (130)
Massachusetts:
5.2% (40,247)
United Kingdom
Westford:
7.2% (95)
Massachusetts:
3.3% (25,403)
Germany
Westford:
5.9% (78)
Massachusetts:
1.9% (14,883)
Vietnam
Westford:
4.0% (53)
Massachusetts:
3.9% (30,457)
Hong Kong
Westford:
3.3% (43)
Massachusetts:
1.0% (7,937)
Colombia
Westford:
3.3% (43)
Massachusetts:
2.0% (15,286)
Italy
Westford:
2.6% (34)
Massachusetts:
3.7% (28,319)
Taiwan
Westford:
2.3% (30)
Massachusetts:
0.9% (7,258)
Brazil
Westford:
2.1% (28)
Massachusetts:
4.7% (36,669)
Korea
Westford:
2.1% (27)
Massachusetts:
1.7% (13,456)
South Africa
Westford:
2.0% (26)
Massachusetts:
0.3% (2,242)
Japan
Westford:
1.9% (25)
Massachusetts:
1.1% (8,682)
Other Northern Europe
Westford:
1.6% (21)
Massachusetts:
0.4% (3,051)
Greece
Westford:
1.5% (20)
Massachusetts:
1.7% (12,975)
Other South Eastern Asia
Westford:
1.5% (20)
Massachusetts:
0.2% (1,659)
Place of birth for U.S.-born residents:
This state: 13,560
Other state: 5,673
Northeast: 3,265
Midwest: 978
South: 895
West: 535
64% of Westford residents lived in the same house 5 years ago. Out of people who lived in different houses, 61% lived in this county. Out of people who lived in different counties, 30% lived in Massachusetts.
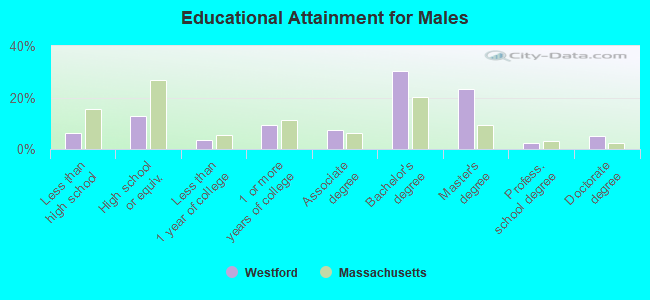
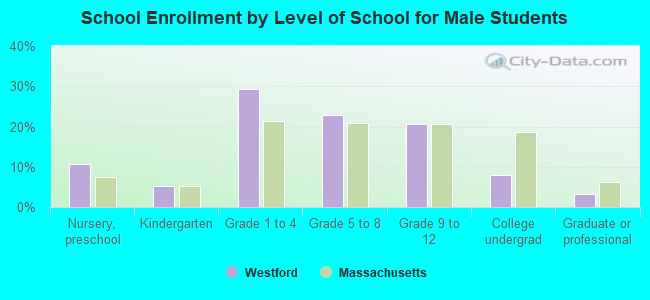
Education attainment for males 25 years and older:
No schooling: 18
Nursery to 4th grade: 7
5th and 6th grade: 0
7th and 8th grade: 72
9th grade: 84
10th grade: 105
11th grade: 39
12th grade, no diploma: 67
High school graduate (or equivalency): 820
Less than 1 year of college: 225
Some college more than 1 year, no degree: 588
Associate degree: 458
Bachelor's degree: 1,933
Master's degree: 1,487
Professional school degree: 144
Doctorate degree: 312
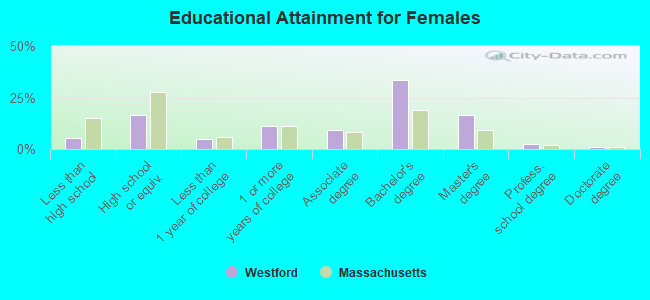
Education attainment for females 25 years and older:
No schooling: 4
Nursery to 4th grade: 0
5th and 6th grade: 5
7th and 8th grade: 102
9th grade: 41
10th grade: 116
11th grade: 50
12th grade, no diploma: 67
High school graduate (or equivalency): 1,133
Less than 1 year of college: 347
Some college more than 1 year, no degree: 756
Associate degree: 629
Bachelor's degree: 2,301
Master's degree: 1,154
Professional school degree: 156
Doctorate degree: 55
Housing units in structures:
One, detached: 6,161
One, attached: 272
Two: 184
3 or 4: 121
5 to 9: 143
10 to 19: 20
20 to 49: 12
50 or more: 6
Mobile homes: 22
Median worth of mobile homes: $523,108
Housing units lacking complete plumbing facilities: 0.4%
Housing units lacking complete kitchen facilities: 0.2%