Westfield, MA (Massachusetts) Houses and Residents
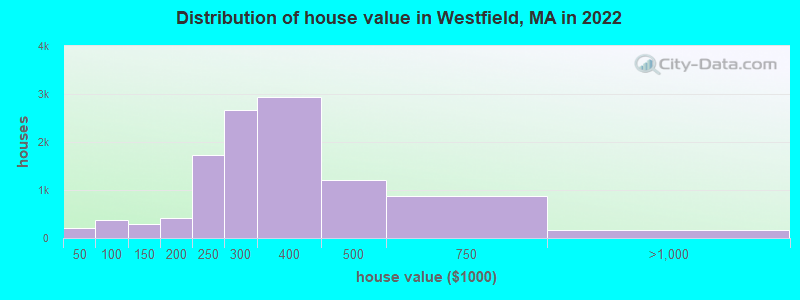
Estimated median house or condo value in 2022: $308,332 (it was $128,900 in 2000 )
Westfield:
$308,332Massachusetts:
$534,700
Lower value quartile - upper value quartile: $247,015 - $396,036Mean price in 2022: Detached houses: $347,530 Here:
$347,530State:
$651,570
Townhouses or other attached units: $279,233 Here:
$279,233State:
$617,749
In 2-unit structures: $276,440 Here:
$276,440State:
$594,808
In 3-to-4-unit structures: $324,359 Here:
$324,359State:
$601,912
In 5-or-more-unit structures: $140,725 Here:
$140,725State:
$555,768
Mobile homes: $143,246 Here:
$143,246State:
$170,209
Total population: 41,608 (Urban population: 36,629, Rural population: 3,443 (23 farm, 3,420 nonfarm ))
Houses: 16,427 (15,475 occupied: 10,259 owner occupied, 5,180 renter occupied )
% of renters here:
34%State:
38%
Housing density: 353 houses/condos per square mile
Median price asked for vacant for-sale houses and condos in 2022: $287,483.
Median contract rent in 2022: $867 (lower quartile is $668, upper quartile is $1,146)
Median rent asked for vacant for-rent units in 2022: $1,696
Median gross rent in Westfield, MA in 2022: $1,011
Housing units in Westfield with a mortgage: 6,327 (795 second mortgage, 58 home equity loan, 719 both second mortgage and home equity loan )Houses without a mortgage: 380
Median household income for houses/condos with a mortgage: $106,636
Median household income for apartments without a mortgage: $73,123
Median monthly housing costs: $1,209
Data:
Median house or condo value ($)
Median house or condo value ($ change since 2000)
Median house or condo value ($) - White
Median house or condo value ($) - Black or African American
Median house or condo value ($) - Asian
Median house or condo value ($) - Hispanic or Latino
Median house or condo value ($) - American Indian and Alaska Native
Median house or condo value ($) - Multirace
Median house or condo value ($) - Other Race
Median price asked for mobile homes ($)
Household density (households per square mile)
Mean house or condo value by units in structure - 1, detached ($)
Mean house or condo value by units in structure - 1, attached ($)
Mean house or condo value by units in structure - 2 ($)
Mean house or condo value by units in structure by units in structure - 3 or 4 ($)
Mean house or condo value by units in structure - 5 or more ($)
Mean house or condo value by units in structure - Boat, RV, van, etc. ($)
Mean house or condo value by units in structure - Mobile home ($)
Median contract rent ($)
Median contract rent - Lower quartile ($)
Median contract rent - Upper quartile ($)
Median gross rent ($)
Urban houses (%)
Rural houses (%)
Houses occupied (%)
Houses occupied (% change since 2000)
Houses owner occupied (%)
Houses owner occupied (% change since 2000)
Houses renter occupied (%)
Houses renter occupied (% change since 2000)
Vacant housing units - For rent (%)
Vacant housing units - For rent (% change since 2000)
Vacant housing units - For sale only (%)
Vacant housing units - For sale only (% change since 2000)
Vacant housing units - Rented or sold, not occupied (%)
Vacant housing units - Rented or sold, not occupied (% change since 2000)
Vacant housing units - For seasonal, recreational, or occasional use (%)
Vacant housing units - For seasonal, recreational, or occasional use (% change since 2000)
Vacant housing units - For migrant workers (%)
Vacant housing units - For migrant workers (% change since 2000)
Vacant housing units - Other vacant (%)
Vacant housing units - Other vacant (% change since 2000)
Median monthly housing costs ($)
Median household income for houses/condos with a mortgage ($)
Median household income for houses/condos without a mortgage ($)
Median household income ($)
Median household income ($) - White
Median household income ($) - Black or African American
Median household income ($) - Asian
Median household income ($) - Hispanic or Latino
Median household income ($) - American Indian and Alaska Native
Median household income ($) - Multirace
Median household income ($) - Other Race
Mortgage status - with mortgage (%)
Mortgage status - with second mortgage (%)
Mortgage status - with home equity loan (%)
Mortgage status - with both second mortgage and home equity loan (%)
Mortgage status - without a mortgage (%)
Median year house/condo built
Median year apartment built
Household type by relationship - Male householder living alone (%)
Household type by relationship - Male householder not living alone (%)
Household type by relationship - Female householder living alone (%)
Household type by relationship - Female householder not living alone (%)
Household type by relationship - Opposite-Sex spouse (%)
Household type by relationship - Same-Sex spouse (%)
Household type by relationship - Opposite-Sex unmarried partner (%)
Household type by relationship - Same-Sex unmarried partner (%)
Household type by relationship - In group quarters (%)
Size of family households - 2-person household (%)
Size of family households - 3-person household (%)
Size of family households - 4-person household (%)
Size of family households - 5-person household (%)
Size of family households - 6-person household (%)
Size of family households - 7-or-more-person household (%)
Size of nonfamily households - 1-person household (%)
Size of nonfamily households - 2-person household (%)
Size of nonfamily households - 3-person household (%)
Size of nonfamily households - 4-person household (%)
Size of nonfamily households - 5-person household (%)
Size of nonfamily households - 6-person household (%)
Size of nonfamily households - 7-or-moreperson household (%)
Year house built - Built 2010 or later (%)
Year house built - Built 2000 to 2009 (%)
Year house built - Built 1990 to 1999 (%)
Year house built - Built 1980 to 1989 (%)
Year house built - Built 1970 to 1979 (%)
Year house built - Built 1960 to 1969 (%)
Year house built - Built 1950 to 1959 (%)
Year house built - Built 1940 to 1949 (%)
Year house built - Built 1939 or earlier (%)
Median number of rooms in houses and condos
Median number of rooms in apartments
Median number of bedrooms in owner occupied houses
Mean number of bedrooms in owner occupied houses
Median number of bedrooms in renter occupied houses
Mean number of bedrooms in renter occupied houses
Median number of vehichles in owner occupied houses
Mean number of vehichles in owner occupied houses
Median number of vehichles in renter occupied houses
Mean number of vehichles in renter occupied houses
Rooms in owner-occupied houses - 1 room (%)
Rooms in owner-occupied houses - 2 rooms (%)
Rooms in owner-occupied houses - 3 rooms (%)
Rooms in owner-occupied houses - 4 rooms (%)
Rooms in owner-occupied houses - 5 rooms (%)
Rooms in owner-occupied houses - 6 rooms (%)
Rooms in owner-occupied houses - 7 rooms (%)
Rooms in owner-occupied houses - 8 rooms (%)
Rooms in owner-occupied houses - 9+ rooms (%)
Rooms in renter-occupied houses - 1 room (%)
Rooms in renter-occupied houses - 2 rooms (%)
Rooms in renter-occupied houses - 3 rooms (%)
Rooms in renter-occupied houses - 4 rooms (%)
Rooms in renter-occupied houses - 5 rooms (%)
Rooms in renter-occupied houses - 6 rooms (%)
Rooms in renter-occupied houses - 7 rooms (%)
Rooms in renter-occupied houses - 8 rooms (%)
Rooms in renter-occupied houses - 9+ rooms (%)
Bedrooms in owner-occupied houses - no bedrooms (%)
Bedrooms in owner-occupied houses - 1 bedroom (%)
Bedrooms in owner-occupied houses - 2 bedrooms (%)
Bedrooms in owner-occupied houses - 3 bedrooms (%)
Bedrooms in owner-occupied houses - 4 bedrooms (%)
Bedrooms in owner-occupied houses - 5+ bedrooms (%)
Bedrooms in renter-occupied houses - no bedrooms (%)
Bedrooms in renter-occupied houses - 1 bedroom (%)
Bedrooms in renter-occupied houses - 2 bedrooms (%)
Bedrooms in renter-occupied houses - 3 bedrooms (%)
Bedrooms in renter-occupied houses - 4 bedrooms (%)
Bedrooms in renter-occupied houses - 5+ bedrooms (%)
Vehicles available in owner-occupied houses - no vehicle available (%)
Vehicles available in owner-occupied houses - 1 vehicle available(%)
Vehicles available in owner-occupied houses - 2 Vehicles available (%)
Vehicles available in owner-occupied houses - 3 Vehicles available (%)
Vehicles available in owner-occupied houses - 4 Vehicles available (%)
Vehicles available in owner-occupied houses - 5+ Vehicles available (%)
Vehicles available in renter-occupied houses - no vehicle available (%)
Vehicles available in renter-occupied houses - 1 vehicle available (%)
Vehicles available in renter-occupied houses - 2 Vehicles available (%)
Vehicles available in renter-occupied houses - 3 Vehicles available (%)
Vehicles available in renter-occupied houses - 4 Vehicles available (%)
Vehicles available in renter-occupied houses - 5+ Vehicles available (%)
Housing units in structures - 1, detached (%)
Housing units in structures - 1, attached (%)
Housing units in structures - 2 (%)
Housing units in structures - 3 or 4 (%)
Housing units in structures - 5 to 9 (%)
Housing units in structures - 10 to 19 (%)
Housing units in structures - 20 to 49 (%)
Housing units in structures - 50 or more (%)
Housing units in structures - Mobile home (%)
Housing units in structures - Boat, RV, van, etc. (%)
Housing units in structures - Owners - 1, detached (%)
Housing units in structures - Owners - 1, attached (%)
Housing units in structures - Owners - 2 (%)
Housing units in structures - Owners - 3 or 4 (%)
Housing units in structures - Owners - 5 to 9 (%)
Housing units in structures - Owners - 10 to 19 (%)
Housing units in structures - Owners - 20 to 49 (%)
Housing units in structures - Owners - 50 or more (%)
Housing units in structures - Owners - Mobile home (%)
Housing units in structures - Owners - Boat, RV, van, etc. (%)
Housing units in structures - Renters - 1, detached (%)
Housing units in structures - Renters - 1, attached (%)
Housing units in structures - Renters - 2 (%)
Housing units in structures - Renters - 3 or 4 (%)
Housing units in structures - Renters - 5 to 9 (%)
Housing units in structures - Renters - 10 to 19 (%)
Housing units in structures - Renters - 20 to 49 (%)
Housing units in structures - Renters - 50 or more (%)
Housing units in structures - Renters - Mobile home (%)
Housing units in structures - Renters - Boat, RV, van, etc. (%)
House/condo owner moved in on average (years ago)
Renter moved in on average (years ago)
Year householder moved into unit - Moved in 1999 to March 2000 (%)
Year householder moved into unit - Moved in 1999 to March 2000 (%) - White
Year householder moved into unit - Moved in 1999 to March 2000 (%) - Black or African American
Year householder moved into unit - Moved in 1999 to March 2000 (%) - Asian
Year householder moved into unit - Moved in 1999 to March 2000 (%) - Hispanic or Latino
Year householder moved into unit - Moved in 1999 to March 2000 (%) - American Indian and Alaska Native
Year householder moved into unit - Moved in 1999 to March 2000 (%) - Multirace
Year householder moved into unit - Moved in 1999 to March 2000 (%) - Other Race
Year householder moved into unit - Moved in 1995 to 1998 (%)
Year householder moved into unit - Moved in 1995 to 1998 (%) - White
Year householder moved into unit - Moved in 1995 to 1998 (%) - Black or African American
Year householder moved into unit - Moved in 1995 to 1998 (%) - Asian
Year householder moved into unit - Moved in 1995 to 1998 (%) - Hispanic or Latino
Year householder moved into unit - Moved in 1995 to 1998 (%) - American Indian and Alaska Native
Year householder moved into unit - Moved in 1995 to 1998 (%) - Multirace
Year householder moved into unit - Moved in 1995 to 1998 (%) - Other Race
Year householder moved into unit - Moved in 1990 to 1994 (%)
Year householder moved into unit - Moved in 1990 to 1994 (%) - White
Year householder moved into unit - Moved in 1990 to 1994 (%) - Black or African American
Year householder moved into unit - Moved in 1990 to 1994 (%) - Asian
Year householder moved into unit - Moved in 1990 to 1994 (%) - Hispanic or Latino
Year householder moved into unit - Moved in 1990 to 1994 (%) - American Indian and Alaska Native
Year householder moved into unit - Moved in 1990 to 1994 (%) - Multirace
Year householder moved into unit - Moved in 1990 to 1994 (%) - Other Race
Year householder moved into unit - Moved in 1980 to 1989 (%)
Year householder moved into unit - Moved in 1980 to 1989 (%) - White
Year householder moved into unit - Moved in 1980 to 1989 (%) - Black or African American
Year householder moved into unit - Moved in 1980 to 1989 (%) - Asian
Year householder moved into unit - Moved in 1980 to 1989 (%) - Hispanic or Latino
Year householder moved into unit - Moved in 1980 to 1989 (%) - American Indian and Alaska Native
Year householder moved into unit - Moved in 1980 to 1989 (%) - Multirace
Year householder moved into unit - Moved in 1980 to 1989 (%) - Other Race
Year householder moved into unit - Moved in 1970 to 1979 (%)
Year householder moved into unit - Moved in 1970 to 1979 (%) - White
Year householder moved into unit - Moved in 1970 to 1979 (%) - Black or African American
Year householder moved into unit - Moved in 1970 to 1979 (%) - Asian
Year householder moved into unit - Moved in 1970 to 1979 (%) - Hispanic or Latino
Year householder moved into unit - Moved in 1970 to 1979 (%) - American Indian and Alaska Native
Year householder moved into unit - Moved in 1970 to 1979 (%) - Multirace
Year householder moved into unit - Moved in 1970 to 1979 (%) - Other Race
Year householder moved into unit - Moved in 1969 or earlier (%)
Year householder moved into unit - Moved in 1969 or earlier (%) - White
Year householder moved into unit - Moved in 1969 or earlier (%) - Black or African American
Year householder moved into unit - Moved in 1969 or earlier (%) - Asian
Year householder moved into unit - Moved in 1969 or earlier (%) - Hispanic or Latino
Year householder moved into unit - Moved in 1969 or earlier (%) - American Indian and Alaska Native
Year householder moved into unit - Moved in 1969 or earlier (%) - Multirace
Year householder moved into unit - Moved in 1969 or earlier (%) - Other Race
Housing units lacking complete plumbing facilities (%)
Housing units lacking complete kitchen facilities (%)
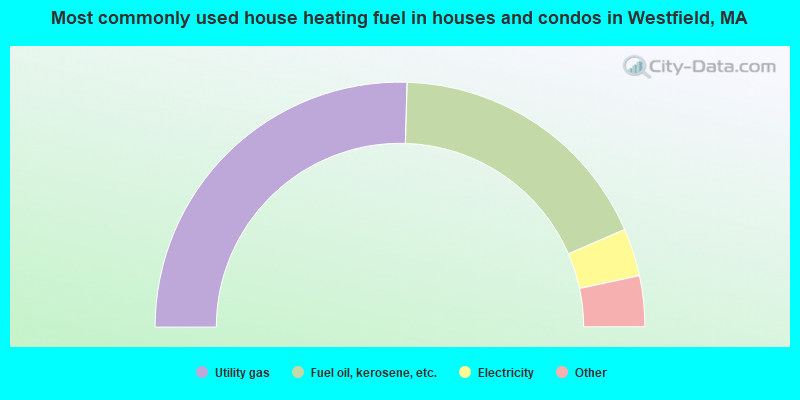
House heating fuel used in houses and condos - Utility gas (%)
House heating fuel used in houses and condos - Bottled, tank, or LP gas (%)
House heating fuel used in houses and condos - Electricity (%)
House heating fuel used in houses and condos - Fuel oil, kerosene, etc. (%)
House heating fuel used in houses and condos - Coal or coke (%)
House heating fuel used in houses and condos - Wood (%)
House heating fuel used in houses and condos - Solar energy (%)
House heating fuel used in houses and condos - Other fuel (%)
House heating fuel used in houses and condos - No fuel used (%)
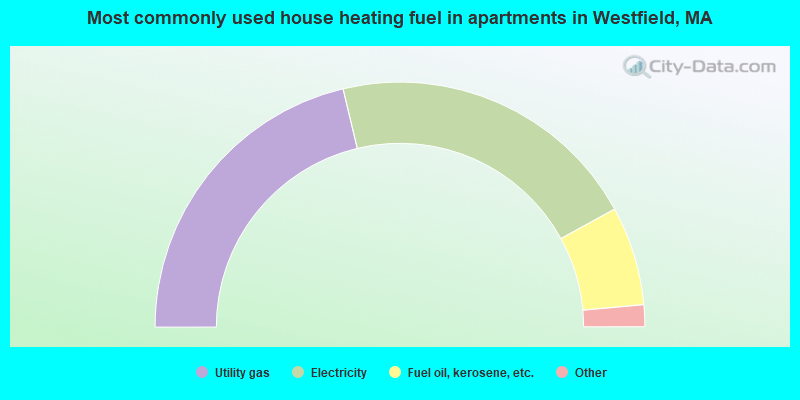
House heating fuel used in apartments - Utility gas (%)
House heating fuel used in apartments - Bottled, tank, or LP gas (%)
House heating fuel used in apartments - Electricity (%)
House heating fuel used in apartments - Fuel oil, kerosene, etc. (%)
House heating fuel used in apartments - Coal or coke (%)
House heating fuel used in apartments - Wood (%)
House heating fuel used in apartments - Solar energy (%)
House heating fuel used in apartments - Other fuel (%)
House heating fuel used in apartments - No fuel used (%)
Latest news about housing in Westfield, MA collected exclusively by city-data.com from local newspapers, TV, and radio stations
Median year house/condo built: 1970Median year apartment built: 1953Household type by relationship:
Households: 40,483
Male householders: 7,145 (1,856 living alone ), Female householders: 8,172 (2,724 living alone )7,580 spouses (7,527 opposite-sex spouses ), 809 unmarried partners , (703 opposite-sex unmarried partners ), 11,159 children (10,356 natural , 184 adopted , 618 stepchildren ), 866 grandchildren , 167 brothers or sisters , 833 parents , 0 foster children , 467 other relatives , 600 non-relatives In group quarters: 2,680
Size of family households: 4,744 2-persons , 2,115 3-persons , 1,525 4-persons , 990 5-persons , 304 6-persons , 156 7-or-more-persons .
Size of nonfamily households: 4,958 1-person , 658 2-persons , 16 3-persons , 9 4-persons , 39 5-persons .
5,478 married couples with children. single-parent households (530 men , 1,224 women ).
81.9% of residents of Westfield speak English at home. of residents speak Spanish at home (52% speak English very well , 16% speak English well , 19% speak English not well , 12% don't speak English at all ).of residents speak other Indo-European language at home (41% speak English very well , 34% speak English well , 19% speak English not well , 6% don't speak English at all ).of residents speak Asian or Pacific Island language at home (14% speak English very well , 58% speak English well , 23% speak English not well , 5% don't speak English at all ).of residents speak other language at home (67% speak English very well , 33% speak English well ).
Foreign born population: 4,601 (11.4%)of them are naturalized citizens )
Median number of rooms in houses and condos:
Median number of rooms in apartments
Owner-occupied Renter-occupied
Rooms in owner-occupied houses in Westfield, Massachusetts
21 1 room 7 2 rooms 119 3 rooms 1,010 4 rooms 1,795 5 rooms 2,211 6 rooms 2,109 7 rooms 1,434 8 rooms 1,554 9+ rooms
Rooms in renter-occupied apartments in Westfield, Massachusetts
175 1 room 337 2 rooms 1,287 3 rooms 1,373 4 rooms 593 5 rooms 903 6 rooms 352 7 rooms 73 8 rooms 86 9+ rooms
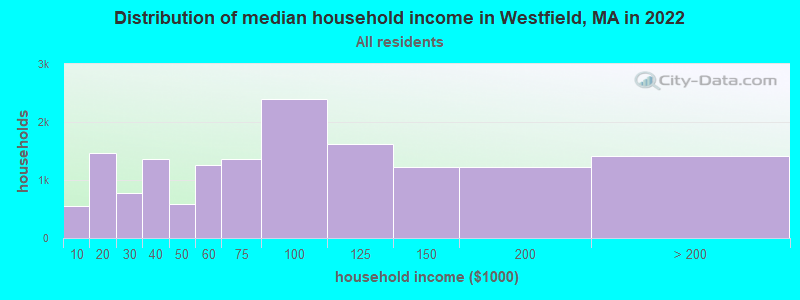
Westfield, MA household income distribution 554 Less than $10,0001,458 $10,000 to $19,999778 $20,000 to $29,9991,358 $30,000 to $39,999583 $40,000 to $49,9991,267 $50,000 to $59,9991,357 $60,000 to $74,9992,393 $75,000 to $99,9991,629 $100,000 to $124,9991,227 $125,000 to $149,9991,231 $150,000 to $199,9991,408 $200,000 or more
Home value of owner - occupied houses in 2022 in Westfield, MA 65 Less than $10,00014 $10,000 to $14,99926 $15,000 to $19,9999 $20,000 to $24,99936 $25,000 to $29,99911 $30,000 to $34,99926 $35,000 to $39,99923 $40,000 to $49,999139 $50,000 to $59,99927 $60,000 to $69,99931 $70,000 to $79,999114 $80,000 to $89,99935 $90,000 to $99,999238 $100,000 to $124,99958 $125,000 to $149,999189 $150,000 to $174,999236 $175,000 to $199,9991,732 $200,000 to $249,9992,666 $250,000 to $299,9992,937 $300,000 to $399,9991,201 $400,000 to $499,999867 $500,000 to $749,999112 $750,000 to $999,99923 $1,000,000 to $1,499,99927 $2,000,000 or moreRent paid by renters in 2022 in Westfield, MA 39 Less than $10010 $100 to $14935 $150 to $19948 $200 to $249204 $250 to $29944 $300 to $349107 $350 to $399220 $400 to $44930 $450 to $49943 $500 to $54965 $550 to $599200 $600 to $64981 $650 to $699856 $700 to $749227 $750 to $799651 $800 to $899612 $900 to $999759 $1,000 to $1,249471 $1,250 to $1,499446 $1,500 to $1,99911 $2,000 to $2,499177 No cash rent
Percentage of workers working in this county: 84.0%Number of people working at home: 1,392 (7.4% of all workers )
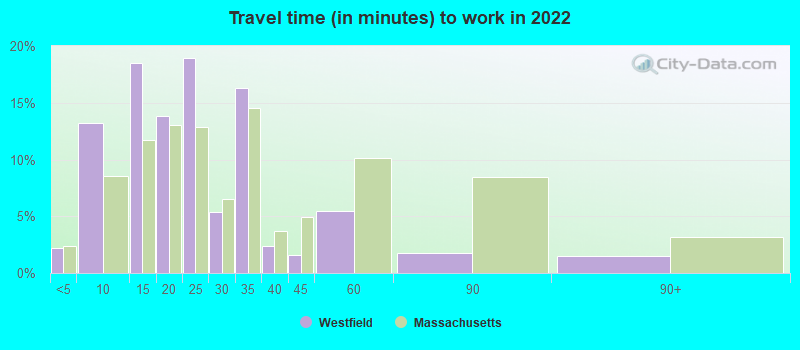
Travel time to work (commute)
Less than 5 minutes: 3085 to 9 minutes: 2,49210 to 14 minutes: 2,91915 to 19 minutes: 2,14020 to 24 minutes: 2,49325 to 29 minutes: 1,31330 to 34 minutes: 2,64535 to 39 minutes: 67340 to 44 minutes: 44545 to 59 minutes: 73260 to 89 minutes: 58890 or more minutes: 354
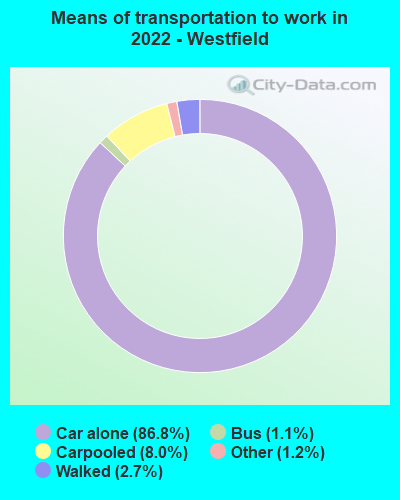
Means of transportation to work:
Drove a car alone: 15,378 (77.4%)Carpooled: 1,965 (9.9%)Bus : 122 (0.6%)Long-distance train or commuter rail : 15 (0.1%)Taxi: 385 (1.9%)Bicycle: 9 (0.0%)Walked: 572 (2.9%)Worked at home: 1,392 (7.0%)
Unemployment by race in 2022
Unemployment rate for White non-Hispanic residents 2.9% Males2.7% FemalesUnemployment rate for Black residents 7.7% FemalesUnemployment rate for Asian residents 19.6% FemalesUnemployment rate for other race residents 8.3% Males9.6% FemalesUnemployment rate for two or more race residents 5.5% Males2.6% FemalesUnemployment rate for Hispanic or Latino residents 6.0% Males12.5% Females
Year of entry for the foreign-born population in Westfield, Massachusetts
2,266 2010 or later 981 2000 to 2009 750 1990 to 1999 283 1980 to 1989 143 1970 to 1979 757 Before 1970
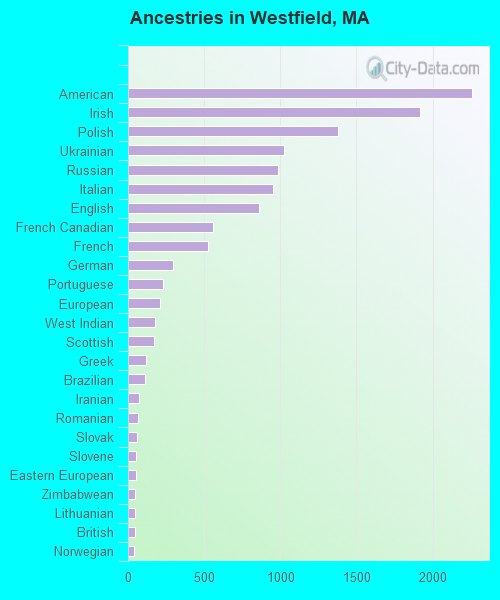
First ancestries reported:
American: 2,258 (12.8%)
Irish: 1,919 (10.9%)
Polish: 1,381 (7.8%)
Ukrainian: 1,023 (5.8%)
Russian: 988 (5.6%)
Italian: 952 (5.4%)
English: 860 (4.9%)
French Canadian: 559 (3.2%)
French: 523 (3.0%)
German: 293 (1.7%)
Portuguese: 229 (1.3%)
European: 209 (1.2%)
West Indian: 178 (1.0%)
Scottish: 174 (1.0%)
Greek: 116 (0.7%)
Brazilian: 111 (0.6%)
Iranian: 71 (0.4%)
Romanian: 67 (0.4%)
Slovak: 60 (0.3%)
Slovene: 51 (0.3%)
Eastern European: 50 (0.3%)
Zimbabwean: 47 (0.3%)
Lithuanian: 44 (0.2%)
British: 43 (0.2%)
Norwegian: 41 (0.2%)
Czech: 29 (0.2%)
Armenian: 26 (0.1%)
Scotch-Irish: 23 (0.1%)
Canadian: 22 (0.1%)
Lebanese: 20 (0.1%)
Israeli: 19 (0.1%)
German Russian: 17 (0.10%)
Iraqi: 15 (0.09%)
Dutch: 15 (0.09%)
Danish: 15 (0.09%)
African: 14 (0.08%)
Trinidadian and Tobagonian: 13 (0.07%)
Jordanian: 12 (0.07%)
Alsatian: 12 (0.07%)
Cape Verdean: 9 (0.05%)
Nigerian: 9 (0.05%)
Czechoslovakian: 7 (0.04%)
Welsh: 7 (0.04%)
British West Indian: 6 (0.03%)
Scandinavian: 5 (0.03%)
Swedish: 5 (0.03%)
Most common places of birth for foreign-born residents (%): Ukraine Westfield:
22.4% (1,040)Massachusetts:
0.9% (10,808)
Russia Westfield:
12.7% (590)Massachusetts:
1.5% (18,278)
Nepal Westfield:
9.8% (457)Massachusetts:
0.6% (6,789)
Sri Lanka Westfield:
4.3% (200)Massachusetts:
0.2% (1,990)
Bhutan Westfield:
4.2% (195)Massachusetts:
0.1% (949)
Dominican Republic Westfield:
3.9% (183)Massachusetts:
8.3% (101,767)
Afghanistan Westfield:
3.3% (155)Massachusetts:
0.1% (883)
Belarus Westfield:
2.9% (135)Massachusetts:
0.2% (2,737)
Other South Central Asia Westfield:
2.8% (129)Massachusetts:
0.1% (886)
Portugal Westfield:
2.7% (126)Massachusetts:
4.1% (50,360)
Brazil Westfield:
2.6% (123)Massachusetts:
7.6% (92,959)
Poland Westfield:
2.6% (121)Massachusetts:
0.9% (10,915)
China, excluding Hong Kong and Taiwan Westfield:
2.6% (120)Massachusetts:
8.4% (103,233)
Azores Islands Westfield:
2.2% (103)Massachusetts:
0.9% (10,768)
Iran Westfield:
1.6% (76)Massachusetts:
0.6% (7,213)
England Westfield:
1.6% (76)Massachusetts:
0.9% (10,698)
Canada Westfield:
1.5% (70)Massachusetts:
2.3% (28,158)
Place of birth for U.S.-born residents:
This state: 26,905Other state: 7,567Northeast: 5,393Midwest: 661South: 1,090West: 421 88.0% of Westfield residents lived in the same house 1 years ago.
Out of people who lived in different houses, 36.8% lived in this county.
Out of people who lived in different counties, 71.5% lived in Massachusetts.
Westfield:
88.0%State average:
87.7%
Education attainment for males 25 years and older:
No schooling: 306Nursery to 4th grade: 345th and 6th grade: 247th and 8th grade: 1039th grade: 12610th grade: 14711th grade: 14012th grade, no diploma: 307High school graduate (or equivalency): 3,618Less than 1 year of college: 1,029Some college more than 1 year, no degree: 1,760Associate degree: 1,219Bachelor's degree: 3,024Master's degree: 945Professional school degree: 116Doctorate degree: 255
Education attainment for females 25 years and older:
No schooling: 536Nursery to 4th grade: 675th and 6th grade: 357th and 8th grade: 1469th grade: 25410th grade: 18011th grade: 12712th grade, no diploma: 165High school graduate (or equivalency): 3,380Less than 1 year of college: 1,390Some college more than 1 year, no degree: 1,319Associate degree: 2,171Bachelor's degree: 3,076Master's degree: 1,617Professional school degree: 174Doctorate degree: 233
Housing units in structures:
One, detached: 9,644One, attached: 477Two: 1,7763 or 4: 1,5185 to 9: 1,00210 to 19: 35520 to 49: 54950 or more: 660Mobile homes: 441Median worth of mobile homes: $68,474
Housing units lacking complete plumbing facilities in 2022: 0.6%Housing units lacking complete kitchen facilities in 2022: 1.4%House/condo owner moved in on average 16 years ago
Renter moved in on average 3 years ago
Private vs. public school enrollment:
Students in private schools in grades 1 to 8 (elementary and middle school): 341 Here:
9.7%Massachusetts:
10.3%
Students in private schools in grades 9 to 12 (high school): 388 Here:
18.5%Massachusetts:
12.3%
Students in private undergraduate colleges: 1,181 Here:
31.9%Massachusetts:
51.2%