Housing density: 732 houses/condos per square mile
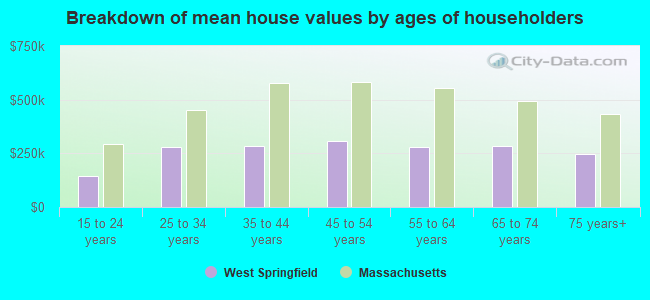
Median price asked for vacant for-sale houses and condos in 2022 in this county: $294,896.
Median contract rent in 2022: $901 (lower quartile is $690, upper quartile is $1,151)
Median rent asked for vacant for-rent units in 2022: $883
Median gross rent in West Springfield, MA in 2022: $1,032
Housing units in West Springfield with a mortgage: 3,870 (417 second mortgage, 576 home equity loan, 0 both second mortgage and home equity loan) Houses without a mortgage: 2,058
Compare current foreclosures near West Springfield, MA:
In family households: 370,558 (69,901 male householders, 46,060 female householders)
75,335 spouses, 139,777 children (131,178 natural, 3,169 adopted, 5,430 stepchildren), 9,761 grandchildren, 4,611 brothers or sisters, 4,384 parents, foster children, 5,451 other relatives, 12,672 non-relatives
In nonfamily households: 78,141 (28,658 male householders (22,507 living alone)), 35,308 female householders (30,105 living alone)), 14,175 nonrelatives
In group quarters: 14,791 (5,845 institutionalized population)
67,791 married couples with children.
39,215 single-parent households (5,649 men, 33,566 women).
82.0% of residents of West Springfield speak English at home.
4.7% of residents speak Spanish at home (69% speak English very well, 20% speak English well, 7% speak English not well, 4% don't speak English at all).
10.8% of residents speak other Indo-European language at home (44% speak English very well, 19% speak English well, 27% speak English not well, 10% don't speak English at all).
1.7% of residents speak Asian or Pacific Island language at home (43% speak English very well, 37% speak English well, 17% speak English not well, 3% don't speak English at all).
0.8% of residents speak other language at home (70% speak English very well, 30% speak English well).
Foreign born population: 4,024 (14.3%)
(34.8% of them are naturalized citizens)
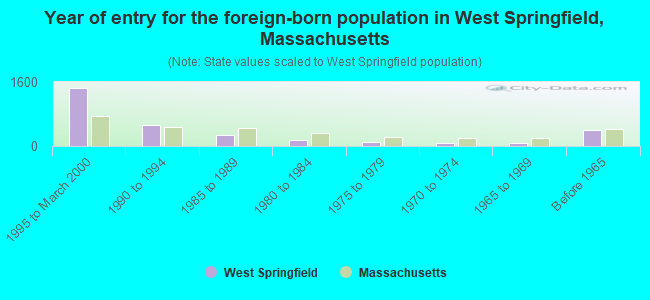
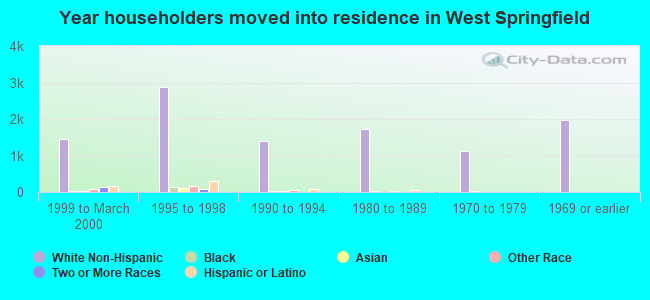
Year of entry for the foreign-born population in West Springfield, Massachusetts
1,4531995 to March 2000
5261990 to 1994
2851985 to 1989
1391980 to 1984
1031975 to 1979
661970 to 1974
701965 to 1969
392Before 1965
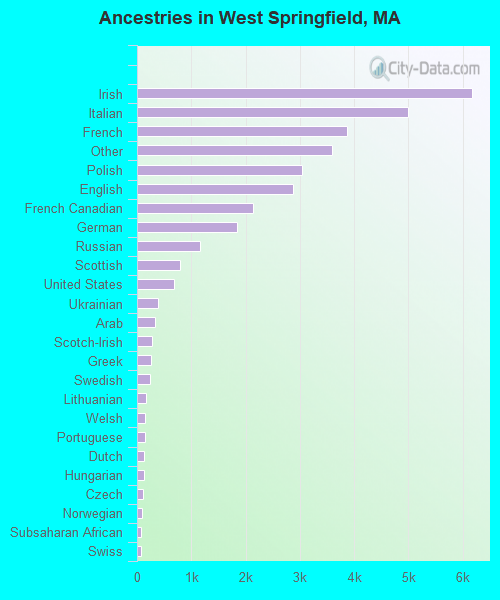
First ancestries reported:
Irish: 6,177 (18.3%)
Italian: 5,000 (14.8%)
French: 3,877 (11.5%)
Other: 3,586 (10.6%)
Polish: 3,036 (9.0%)
English: 2,880 (8.5%)
French Canadian: 2,137 (6.3%)
German: 1,846 (5.5%)
Russian: 1,163 (3.4%)
Scottish: 791 (2.3%)
United States: 681 (2.0%)
Ukrainian: 379 (1.1%)
Arab: 331 (1.0%)
Scotch-Irish: 282 (0.8%)
Greek: 262 (0.8%)
Swedish: 235 (0.7%)
Lithuanian: 164 (0.5%)
Welsh: 143 (0.4%)
Portuguese: 139 (0.4%)
Dutch: 137 (0.4%)
Hungarian: 122 (0.4%)
Czech: 103 (0.3%)
Norwegian: 96 (0.3%)
Subsaharan African: 79 (0.2%)
Swiss: 69 (0.2%)
Danish: 52 (0.2%)
Slovak: 29 (0.09%)
West Indian: 13 (0.04%)
Most common places of birth for foreign-born residents (%):
Other South Central Asia
West Springfield:
12.4% (375)
Massachusetts:
0.4% (2,765)
Ukraine
West Springfield:
12.1% (366)
Massachusetts:
1.1% (8,754)
Russia
West Springfield:
10.7% (325)
Massachusetts:
2.3% (17,449)
Vietnam
West Springfield:
7.5% (228)
Massachusetts:
3.9% (30,457)
Belarus
West Springfield:
6.5% (196)
Massachusetts:
0.2% (1,530)
Italy
West Springfield:
6.4% (194)
Massachusetts:
3.7% (28,319)
Canada
West Springfield:
4.9% (149)
Massachusetts:
5.2% (40,247)
Asia, n.e.c.
West Springfield:
3.6% (110)
Massachusetts:
0.1% (641)
Germany
West Springfield:
3.3% (100)
Massachusetts:
1.9% (14,883)
Other Western Asia
West Springfield:
2.5% (76)
Massachusetts:
0.3% (2,511)
Pakistan
West Springfield:
1.9% (58)
Massachusetts:
0.5% (3,660)
Philippines
West Springfield:
1.8% (55)
Massachusetts:
1.0% (7,414)
Poland
West Springfield:
1.6% (50)
Massachusetts:
1.8% (13,543)
Other Eastern Europe
West Springfield:
1.6% (49)
Massachusetts:
1.6% (12,350)
Place of birth for U.S.-born residents:
This state: 19,715
Other state: 4,436
Northeast: 3,289
Midwest: 402
South: 549
West: 196
61% of West Springfield residents lived in the same house 5 years ago. Out of people who lived in different houses, 82% lived in this county. Out of people who lived in different counties, 35% lived in Massachusetts.
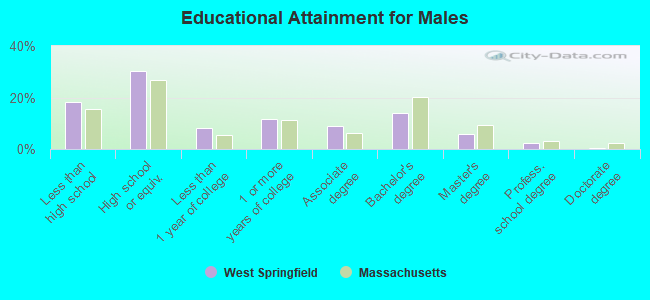
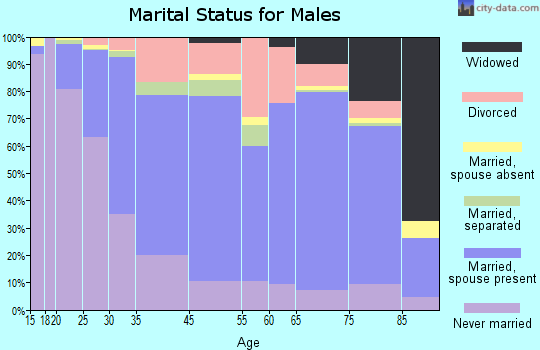
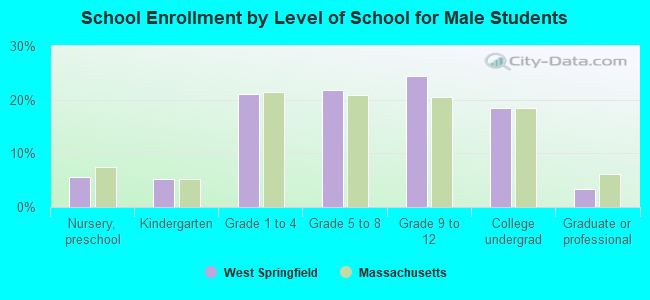
Education attainment for males 25 years and older:
No schooling: 75
Nursery to 4th grade: 21
5th and 6th grade: 51
7th and 8th grade: 220
9th grade: 237
10th grade: 346
11th grade: 330
12th grade, no diploma: 353
High school graduate (or equivalency): 2,744
Less than 1 year of college: 748
Some college more than 1 year, no degree: 1,063
Associate degree: 823
Bachelor's degree: 1,259
Master's degree: 511
Professional school degree: 193
Doctorate degree: 50
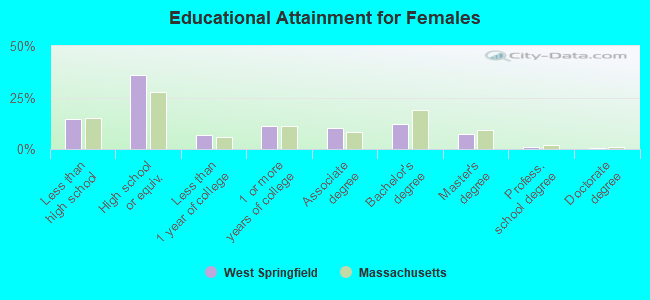
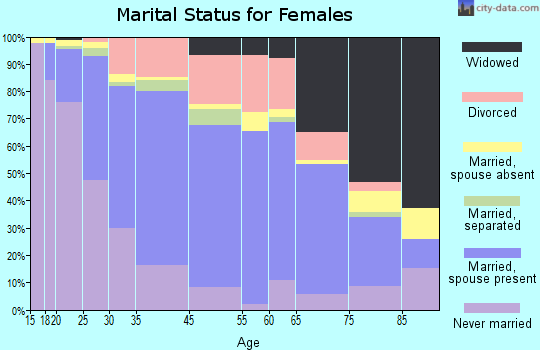
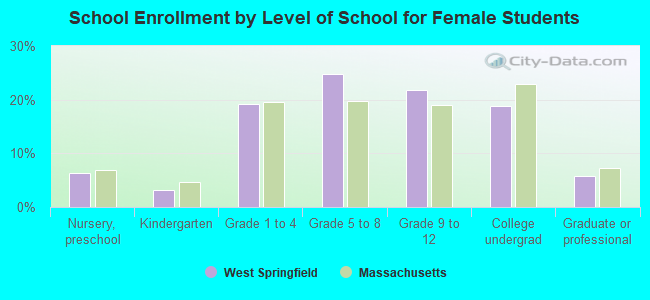
Education attainment for females 25 years and older:
No schooling: 64
Nursery to 4th grade: 37
5th and 6th grade: 98
7th and 8th grade: 207
9th grade: 275
10th grade: 228
11th grade: 249
12th grade, no diploma: 330
High school graduate (or equivalency): 3,646
Less than 1 year of college: 712
Some college more than 1 year, no degree: 1,153
Associate degree: 1,026
Bachelor's degree: 1,235
Master's degree: 749
Professional school degree: 105
Doctorate degree: 30
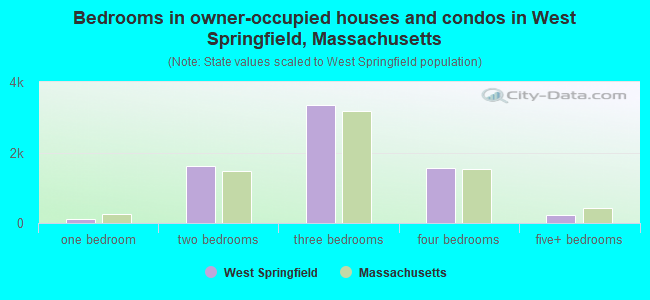
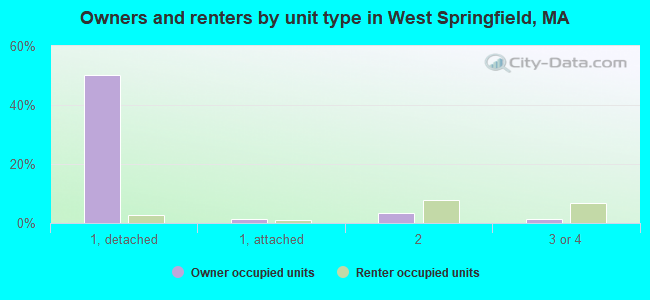
Housing units in structures:
One, detached: 6,363
One, attached: 283
Two: 1,412
3 or 4: 1,042
5 to 9: 652
10 to 19: 434
20 to 49: 1,134
50 or more: 806
Mobile homes: 133
Median worth of mobile homes: $130,072
Housing units lacking complete plumbing facilities: 0.1%
Housing units lacking complete kitchen facilities: 0.1%