West Pelzer, SC (South Carolina) Houses and Residents
| West Pelzer: | $141,968 |
| South Carolina: | $254,600 |
Mean price in 2022:
Detached houses: $144,559
Here: $144,559 State: $368,255 Mobile homes: $76,280
Here: $76,280 State: $102,531
Total population: 896 (Urban population: 858 (all inside urban clusters), Rural population: 24 (all nonfarm))
Houses: 459 (427 occupied: 239 owner occupied, 201 renter occupied)
| % of renters here: | 46% |
| State: | 28% |
Housing density: 938 houses/condos per square mile
Median price asked for vacant for-sale houses and condos in 2022 in this county: $272,098.
Median contract rent in 2022: $634 (lower quartile is $491, upper quartile is $733)
Median rent asked for vacant for-rent units in 2022: $773
Median gross rent in West Pelzer, SC in 2022: $775
Housing units in West Pelzer with a mortgage: 95 (2 second mortgage, 0 home equity loan, 3 both second mortgage and home equity loan)
Houses without a mortgage: 0
Median household income for houses/condos with a mortgage: $78,486
Median household income for apartments without a mortgage: $52,384
Median monthly housing costs: $700
Compare current foreclosures near West Pelzer, SC:
| Photo | Address | Area | Beds / Baths | Price | Details |
|---|---|---|---|---|---|

|
#1
Blue Heron Cir
Simpsonville, SC 29680
|
2,096 sq. feet
|
2 baths 3 beds |
$330,000
|
show details |

|
#2
Parsons Rd
Fountain Inn, SC 29644
|
2,857 sq. feet
|
3 baths 5 beds |
$445,000
|
show details |

|
#3
Blue Ridge Ave
Belton, SC 29627
|
1,568 sq. feet
|
2 baths 3 beds |
$184,900
|
show details |

|
#4
N Archie St
Piedmont, SC 29673
|
- sq. feet
|
1 baths 3 beds |
$53,600
|
show details |

|
#5
N Prince St
Anderson, SC 29624
|
- sq. feet
|
2 baths 2 beds |
$59,900
|
show details |

|
#6
Shirley Ave
Honea Path, SC 29654
|
2,235 sq. feet
|
2 baths 4 beds |
show details | |

|
#7
Scott Rd
Anderson, SC 29621
|
1,648 sq. feet
|
2 baths 3 beds |
show details | |

|
#8
Jadewood Dr
Williamston, SC 29697
|
1,995 sq. feet
|
2 baths 3 beds |
show details | |

|
#9
Harris Bridge Rd
Anderson, SC 29621
|
2,618 sq. feet
|
3 baths 3 beds |
show details | |

|
#10
Oak Dr
Greenville, SC 29611
|
1,003 sq. feet
|
1 baths 3 beds |
show details |
| Photo | Address | Area | Beds / Baths | Price | Details |
|---|---|---|---|---|---|

|
#11
Lucille Ave
Greenville, SC 29605
|
384 sq. feet
|
1 baths 2 beds |
show details | |

|
#12
S Plainview Dr
Greenville, SC 29611
|
1,550 sq. feet
|
2 baths 3 beds |
show details | |

|
#13
S Green St
Williamston, SC 29697
|
1,557 sq. feet
|
2 baths 3 beds |
show details | |

|
#14
Zion Church Rd
Easley, SC 29642
|
987 sq. feet
|
2 baths 2 beds |
show details | |

|
#15
Garrison Rd
Simpsonville, SC 29681
|
- sq. feet
|
3 baths 4 beds |
show details | |

|
#16
Leftwich Ln
Anderson, SC 29621
|
1,527 sq. feet
|
2 baths 3 beds |
show details | |

|
#17
Ledbetter St
Greenville, SC 29611
|
840 sq. feet
|
1 baths 2 beds |
show details | |

|
#18
Manassas Dr
Simpsonville, SC 29681
|
1,778 sq. feet
|
2 baths 4 beds |
show details | |

|
#19
Faris Cir
Greenville, SC 29605
|
2,391 sq. feet
|
2 baths 4 beds |
show details | |

|
#20
Dalewood Dr
Simpsonville, SC 29681
|
1,595 sq. feet
|
2 baths 3 beds |
show details |
| Photo | Address | Area | Beds / Baths | Price | Details |
|---|---|---|---|---|---|

|
#21
Lued Robinson Ct
Greenville, SC 29611
|
1,322 sq. feet
|
2 baths 3 beds |
show details | |

|
#22
Don Dr
Greenville, SC 29607
|
1,190 sq. feet
|
1 baths 3 beds |
show details | |

|
#23
Cambria Ct
Mauldin, SC 29662
|
1,920 sq. feet
|
3 baths 2 beds |
show details | |

|
#24
Page Dr
Greenville, SC 29611
|
1,746 sq. feet
|
2 baths 3 beds |
show details | |

|
#25
Chancellors Park Ct
Simpsonville, SC 29681
|
2,530 sq. feet
|
2 baths 4 beds |
show details | |

|
#26
B Douglas Dr
Simpsonville, SC 29681
|
2,952 sq. feet
|
2 baths 3 beds |
show details | |

|
#27
Fairview Lake Way
Simpsonville, SC 29680
|
1,816 sq. feet
|
2 baths 3 beds |
show details | |

|
#28
Watson Ave
Greenville, SC 29601
|
1,575 sq. feet
|
2 baths 3 beds |
show details | |

|
#29
Glenn Rd
Greenville, SC 29607
|
972 sq. feet
|
1 baths 3 beds |
show details | |

|
#30
Crest Way
Easley, SC 29640
|
1,595 sq. feet
|
2 baths 4 beds |
show details |
| Photo | Address | Area | Beds / Baths | Price | Details |
|---|---|---|---|---|---|

|
#31
Stonehaven Dr
Greenville, SC 29607
|
4,273 sq. feet
|
2 baths 4 beds |
show details | |

|
#32
Laurel Tree Ln
Simpsonville, SC 29681
|
1,151 sq. feet
|
2 baths 3 beds |
show details | |

|
#33
Watson Rd
Fountain Inn, SC 29644
|
1,664 sq. feet
|
2 baths 3 beds |
show details | |

|
#34
Laurel Meadows Pkwy
Greenville, SC 29607
|
2,302 sq. feet
|
2 baths 4 beds |
show details | |

|
#35
Twin Falls Dr
Simpsonville, SC 29680
|
1,255 sq. feet
|
2 baths 3 beds |
show details | |

|
#36
Old Easley Bridge Rd
Easley, SC 29642
|
1,152 sq. feet
|
2 baths 2 beds |
show details | |

|
#37
Hyde Park Ln
Mauldin, SC 29662
|
1,808 sq. feet
|
2 baths 3 beds |
show details | |

|
#38
Collinson Rd
Greenville, SC 29605
|
884 sq. feet
|
1 baths 2 beds |
show details | |

|
#39
Potomac Ave
Greenville, SC 29605
|
1,123 sq. feet
|
1 baths 2 beds |
show details | |

|
#40
Bishop Dr
Mauldin, SC 29662
|
1,728 sq. feet
|
2 baths 3 beds |
show details |
| Photo | Address | Area | Beds / Baths | Price | Details |
|---|---|---|---|---|---|

|
#41
Oak Dr
Greenville, SC 29611
|
1,000 sq. feet
|
1 baths 2 beds |
show details | |

|
#42
Cardinal Woods Way
Easley, SC 29642
|
1,505 sq. feet
|
2 baths 3 beds |
show details | |

|
#43
Rison Rd
Greenville, SC 29611
|
1,350 sq. feet
|
1 baths 3 beds |
show details | |

|
#44
Huck Ct
Mauldin, SC 29662
|
1,516 sq. feet
|
2 baths 3 beds |
show details | |

|
#45
Chuckwood Dr
Simpsonville, SC 29680
|
1,660 sq. feet
|
1 baths 4 beds |
show details | |

|
#46
Seminole Dr
Simpsonville, SC 29680
|
1,162 sq. feet
|
1 baths 3 beds |
show details | |

|
#47
Wallace St
Greenville, SC 29605
|
900 sq. feet
|
1 baths 3 beds |
show details | |

|
#48
Briarstone Ct
Mauldin, SC 29662
|
1,600 sq. feet
|
2 baths 3 beds |
show details | |

|
#49
Flora Ave
Greenville, SC 29611
|
775 sq. feet
|
1 baths 2 beds |
show details | |

|
Check over 1 million property listings on Foreclosure.com!
|
browse all offers | |||


 | What do you think is going on with the killings/shootings of the Murdaugh family? (60 replies) |
| Interstate 985 Anderson, SC Spur (36 replies) |
| Williamston (7 replies) |
| looking to relocate Greenville County (13 replies) |
| Anyone familiar with Pickens County????? (4 replies) |

Median year apartment built: 1986
Household type by relationship:
Households: 1,183- Male householders: 201 (38 living alone), Female householders: 224 (76 living alone)
202 spouses (202 opposite-sex spouses), 65 unmarried partners, (65 opposite-sex unmarried partners), 389 children (332 natural, 18 adopted, 37 stepchildren), 22 grandchildren, 11 brothers or sisters, 4 parents, 0 foster children, 29 other relatives, 31 non-relatives
Size of family households: 115 2-persons, 117 3-persons, 49 4-persons, 23 5-persons, 10 6-persons.
Size of nonfamily households: 114 1-person, 5 2-persons, 1 3-persons.
165 married couples with children.
146 single-parent households (22 men, 124 women).
80.5% of residents of West Pelzer speak English at home.
8.0% of residents speak Spanish at home (42% speak English very well, 46% speak English well, 12% speak English not well).
14.2% of residents speak other language at home (7% speak English very well, 27% speak English well, 66% speak English not well).
Foreign born population: 191 (16.1%)
(24.6% of them are naturalized citizens)
| Here: | 5.8 |
| State: | 6.4 |
| Here: | 4.0 |
| State: | 4.5 |

- Bedrooms in owner-occupied houses and condos in West Pelzer, South Carolina
- 0no bedroom
- 01 bedroom
- 1042 bedrooms
- 1203 bedrooms
- 164 bedrooms
- 05+ bedrooms

- Bedrooms in renter-occupied apartments in West Pelzer, South Carolina
- 0no bedroom
- 391 bedroom
- 1132 bedrooms
- 463 bedrooms
- 34 bedrooms
- 05+ bedrooms

- Cars and other vehicles available in West Pelzer in owner-occupied houses/condos
- 8no vehicle
- 491 vehicle
- 1022 vehicles
- 533 vehicles
- 164 vehicles
- 125+ vehicles

- Cars and other vehicles available in West Pelzer in renter-occupied apartments
- 23no vehicle
- 1121 vehicle
- 552 vehicles
- 113 vehicles
- 04 vehicles
- 05+ vehicles

- Rooms in owner-occupied houses in West Pelzer, South Carolina
- 01 room
- 02 rooms
- 03 rooms
- 494 rooms
- 595 rooms
- 686 rooms
- 577 rooms
- 38 rooms
- 39+ rooms

- Rooms in renter-occupied apartments in West Pelzer, South Carolina
- 01 room
- 02 rooms
- 163 rooms
- 1014 rooms
- 305 rooms
- 336 rooms
- 177 rooms
- 58 rooms
- 09+ rooms


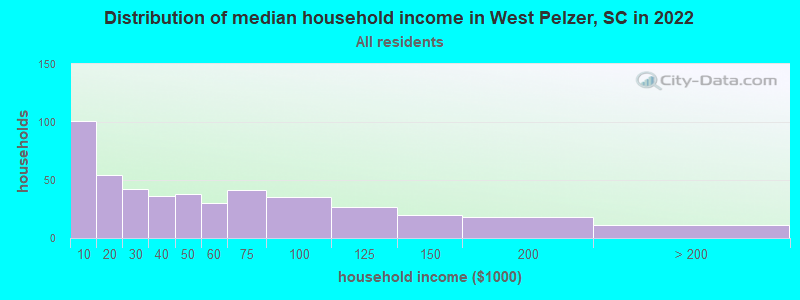
West Pelzer, SC household income distribution

- 101Less than $10,000
- 54$10,000 to $19,999
- 42$20,000 to $29,999
- 36$30,000 to $39,999
- 38$40,000 to $49,999
- 30$50,000 to $59,999
- 41$60,000 to $74,999
- 35$75,000 to $99,999
- 27$100,000 to $124,999
- 20$125,000 to $149,999
- 18$150,000 to $199,999
- 11$200,000 or more
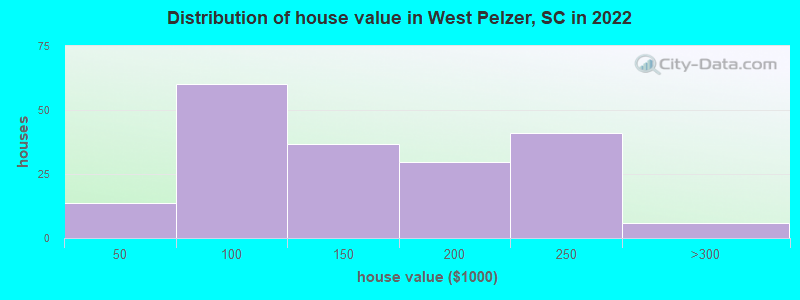
Home value of owner - occupied houses in 2022 in West Pelzer, SC
-
- 4Less than $10,000
- 3$15,000 to $19,999
- 3$20,000 to $24,999
- 1$35,000 to $39,999
- 18$50,000 to $59,999
- 5$60,000 to $69,999
- 3$70,000 to $79,999
- 14$80,000 to $89,999
- 18$90,000 to $99,999
- 21$100,000 to $124,999
- 14$125,000 to $149,999
- 13$150,000 to $174,999
- 16$175,000 to $199,999
- 40$200,000 to $249,999
- 5$250,000 to $299,999
Rent paid by renters in 2022 in West Pelzer, SC
-
- 15$100 to $149
- 4$200 to $249
- 7$350 to $399
- 11$400 to $449
- 12$450 to $499
- 23$500 to $549
- 25$550 to $599
- 10$600 to $649
- 8$650 to $699
- 36$700 to $749
- 2$750 to $799
- 8$800 to $899
- 5$1,000 to $1,249
- 10No cash rent


Percentage of workers working in this county: 47.7%
Number of people working at home: 15 (2.9% of all workers)
Travel time to work (commute)
- Less than 5 minutes: 35
- 5 to 9 minutes: 24
- 10 to 14 minutes: 26
- 15 to 19 minutes: 16
- 20 to 24 minutes: 130
- 25 to 29 minutes: 23
- 30 to 34 minutes: 212
- 35 to 39 minutes: 21
- 40 to 44 minutes: 3
- 45 to 59 minutes: 8
- 60 to 89 minutes: 6
- 90 or more minutes: 9
Means of transportation to work:
- Drove a car alone: 302 (80.1%)
- Carpooled: 57 (15.1%)
- Bicycle: 4 (1.1%)
- Walked: 7 (1.9%)
- Other means: 1 (0.3%)
- Worked at home: 6 (1.6%)

- Unemployment by race in 2022
- Unemployment rate for White non-Hispanic residents
- 2.5%Males
- Unemployment rate for Black residents
- 48.5%Males

- Year of entry for the foreign-born population in West Pelzer, South Carolina
- 1712010 or later
- 72000 to 2009
- 131990 to 1999
- 81980 to 1989
- 01970 to 1979
- 0Before 1970

First ancestries reported:
- English: 101 (17.4%)
- American: 86 (14.8%)
- Irish: 53 (9.1%)
- Egyptian: 43 (7.4%)
- Scottish: 28 (4.8%)
- Jordanian: 20 (3.4%)
- German: 8 (1.4%)
- French: 7 (1.2%)
- Scotch-Irish: 7 (1.2%)
- Greek: 6 (1.0%)
- Italian: 6 (1.0%)
- European: 3 (0.5%)
- Polish: 2 (0.3%)
- Canadian: 1 (0.2%)
- Northern European: 1 (0.2%)
Most common places of birth for foreign-born residents (%):
| West Pelzer: | 56.5% (105) |
| South Carolina: | 0.4% (1,208) |
| West Pelzer: | 31.7% (59) |
| South Carolina: | 0.1% (353) |
| West Pelzer: | 19.9% (37) |
| South Carolina: | 22.5% (60,774) |
| West Pelzer: | 11.3% (21) |
| South Carolina: | 1.1% (2,998) |
Place of birth for U.S.-born residents:
- This state: 737
- Other state: 221
- Northeast: 23
- Midwest: 31
- South: 137
- West: 23
82.3% of West Pelzer residents lived in the same house 1 years ago.
Out of people who lived in different houses, 31.8% lived in this county.
Out of people who lived in different counties, 91.2% lived in South Carolina.
| West Pelzer: | 82.3% |
| State average: | 86.5% |
Education attainment for males 25 years and older:
- No schooling: 8
- Nursery to 4th grade: 0
- 5th and 6th grade: 8
- 7th and 8th grade: 0
- 9th grade: 3
- 10th grade: 8
- 11th grade: 1
- 12th grade, no diploma: 16
- High school graduate (or equivalency): 146
- Less than 1 year of college: 54
- Some college more than 1 year, no degree: 31
- Associate degree: 12
- Bachelor's degree: 67
- Master's degree: 8
- Professional school degree: 0
- Doctorate degree: 0

Education attainment for females 25 years and older:
- No schooling: 15
- Nursery to 4th grade: 0
- 5th and 6th grade: 0
- 7th and 8th grade: 7
- 9th grade: 16
- 10th grade: 17
- 11th grade: 27
- 12th grade, no diploma: 6
- High school graduate (or equivalency): 151
- Less than 1 year of college: 19
- Some college more than 1 year, no degree: 46
- Associate degree: 25
- Bachelor's degree: 46
- Master's degree: 2
- Professional school degree: 0
- Doctorate degree: 0


Housing units in structures:
- One, detached: 299
- Two: 17
- 3 or 4: 13
- 5 to 9: 83
- 10 to 19: 4
- Mobile homes: 42
Median worth of mobile homes: $101,224
House/condo owner moved in on average 9 years ago
Renter moved in on average 3 years ago

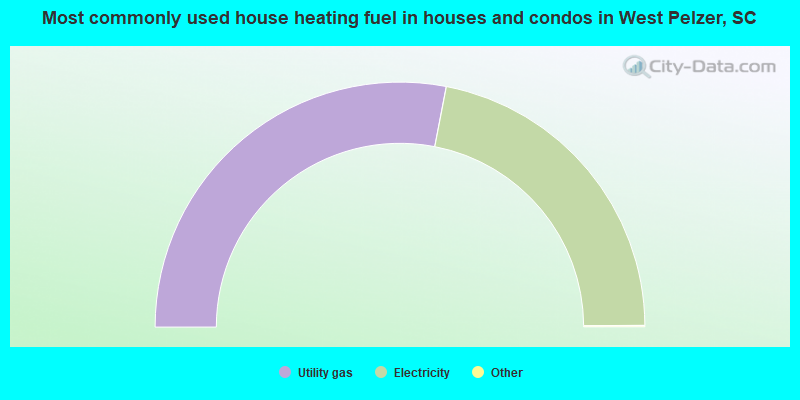
- 56.2%Utility gas
- 43.8%Electricity
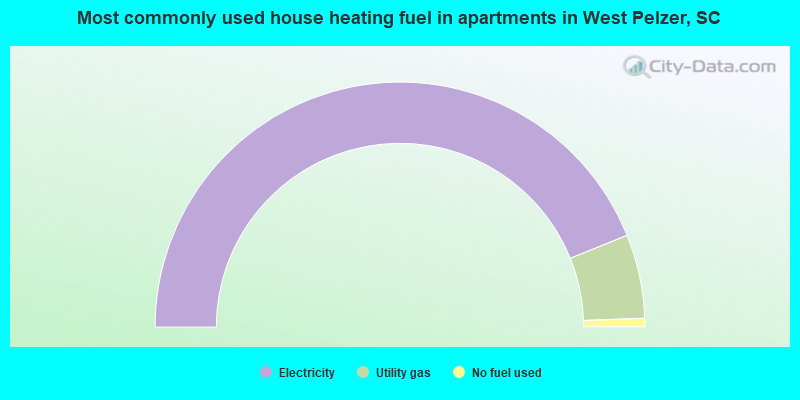
- 87.9%Electricity
- 11.1%Utility gas
- 1.1%No fuel used
Private vs. public school enrollment:
| Here: | 0.9% |
| South Carolina: | 14.4% |
| Here: | 0.0% |
| South Carolina: | 11.1% |
| Here: | 0.0% |
| South Carolina: | 21.9% |


