Housing density: 131 houses/condos per square mile
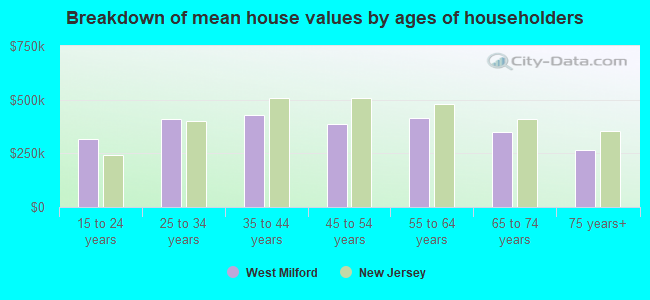
Median price asked for vacant for-sale houses and condos in 2022 in this county: $113,595.
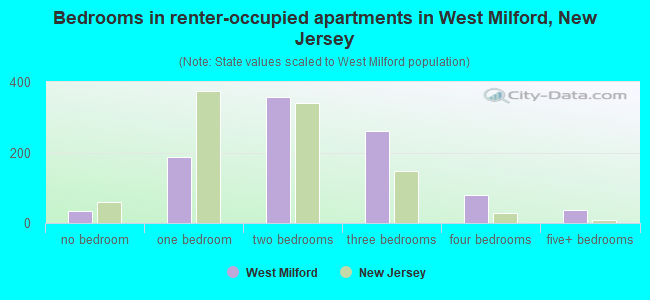
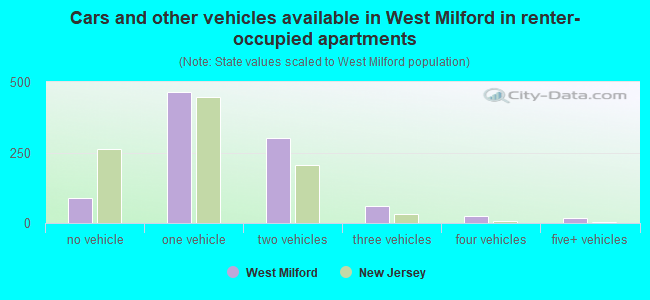
Median contract rent in 2022: $1,512 (lower quartile is $1,051, upper quartile is over $2,000)
Median rent asked for vacant for-rent units in 2022: $1,303
Median gross rent in West Milford, NJ in 2022: $1,616
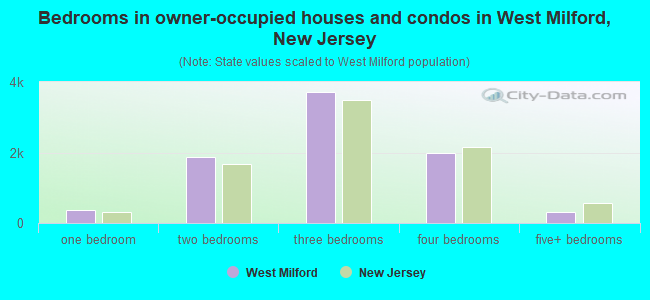
Housing units in West Milford with a mortgage: 6,388 (625 second mortgage, 916 home equity loan, 0 both second mortgage and home equity loan) Houses without a mortgage: 1,195
In family households: 433,190 (75,969 male householders, 44,871 female householders)
81,287 spouses, 163,062 children (155,233 natural, 2,777 adopted, 5,052 stepchildren), 12,822 grandchildren, 9,893 brothers or sisters, 9,550 parents, foster children, 13,805 other relatives, 16,122 non-relatives
In nonfamily households: 57,017 (20,561 male householders (15,848 living alone)), 25,384 female householders (21,858 living alone)), 11,072 nonrelatives
In group quarters: 11,019 (3,291 institutionalized population)
79,516 married couples with children.
30,640 single-parent households (6,238 men, 24,402 women).
90.4% of residents of West Milford speak English at home.
3.0% of residents speak Spanish at home (67% speak English very well, 15% speak English well, 14% speak English not well, 4% don't speak English at all).
5.6% of residents speak other Indo-European language at home (75% speak English very well, 14% speak English well, 9% speak English not well, 2% don't speak English at all).
0.4% of residents speak Asian or Pacific Island language at home (69% speak English very well, 4% speak English well, 26% speak English not well).
0.6% of residents speak other language at home (86% speak English very well, 14% speak English well).
Foreign born population: 1,910 (6.9%)
(75.9% of them are naturalized citizens)
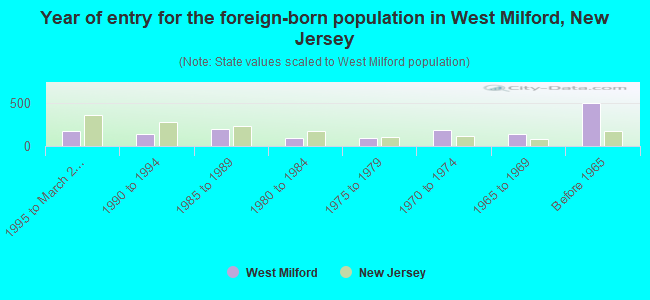
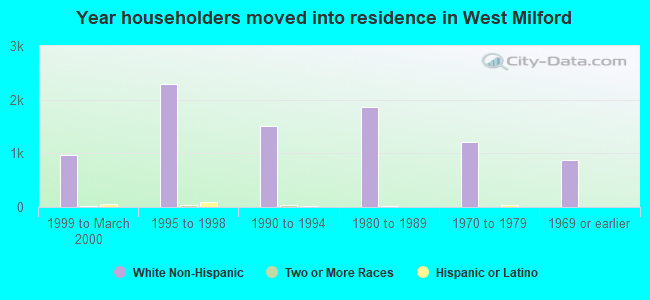
Year of entry for the foreign-born population in West Milford, New Jersey
1751995 to March 2000
1381990 to 1994
2001985 to 1989
901980 to 1984
961975 to 1979
1901970 to 1974
1431965 to 1969
496Before 1965
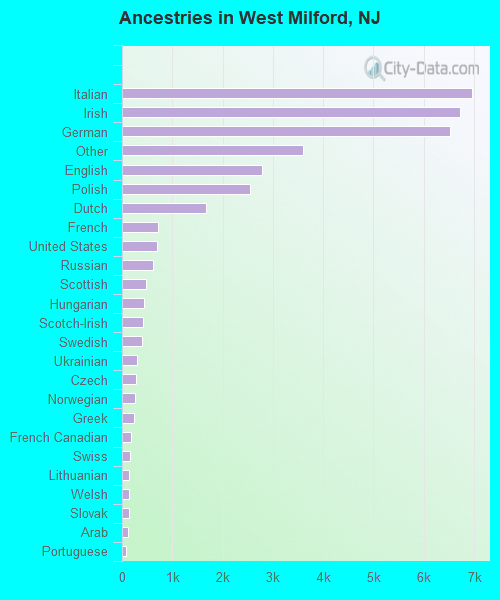
First ancestries reported:
Italian: 6,950 (19.0%)
Irish: 6,717 (18.3%)
German: 6,514 (17.8%)
Other: 3,599 (9.8%)
English: 2,779 (7.6%)
Polish: 2,555 (7.0%)
Dutch: 1,668 (4.6%)
French: 707 (1.9%)
United States: 690 (1.9%)
Russian: 609 (1.7%)
Scottish: 471 (1.3%)
Hungarian: 443 (1.2%)
Scotch-Irish: 417 (1.1%)
Swedish: 396 (1.1%)
Ukrainian: 304 (0.8%)
Czech: 281 (0.8%)
Norwegian: 251 (0.7%)
Greek: 229 (0.6%)
French Canadian: 175 (0.5%)
Swiss: 168 (0.5%)
Lithuanian: 148 (0.4%)
Welsh: 141 (0.4%)
Slovak: 140 (0.4%)
Arab: 120 (0.3%)
Portuguese: 70 (0.2%)
Danish: 65 (0.2%)
Subsaharan African: 20 (0.05%)
West Indian: 6 (0.02%)
Most common places of birth for foreign-born residents (%):
Poland
West Milford:
16.9% (258)
New Jersey:
3.8% (55,466)
Germany
West Milford:
13.6% (208)
New Jersey:
2.3% (33,531)
Italy
West Milford:
9.2% (141)
New Jersey:
4.0% (58,395)
United Kingdom
West Milford:
6.0% (92)
New Jersey:
2.1% (30,355)
Peru
West Milford:
4.2% (64)
New Jersey:
3.1% (45,151)
France
West Milford:
3.8% (58)
New Jersey:
0.5% (6,765)
India
West Milford:
3.5% (54)
New Jersey:
8.1% (119,497)
Other Eastern Europe
West Milford:
3.5% (53)
New Jersey:
1.2% (17,647)
Philippines
West Milford:
3.1% (47)
New Jersey:
4.7% (69,773)
Mexico
West Milford:
2.9% (45)
New Jersey:
4.6% (67,667)
Canada
West Milford:
2.7% (41)
New Jersey:
1.1% (16,333)
Romania
West Milford:
1.8% (28)
New Jersey:
0.4% (6,115)
Dominican Republic
West Milford:
1.7% (26)
New Jersey:
6.2% (91,316)
Place of birth for U.S.-born residents:
This state: 17,941
Other state: 6,791
Northeast: 5,254
Midwest: 541
South: 647
West: 349
69% of West Milford residents lived in the same house 5 years ago. Out of people who lived in different houses, 44% lived in this county. Out of people who lived in different counties, 74% lived in New Jersey.
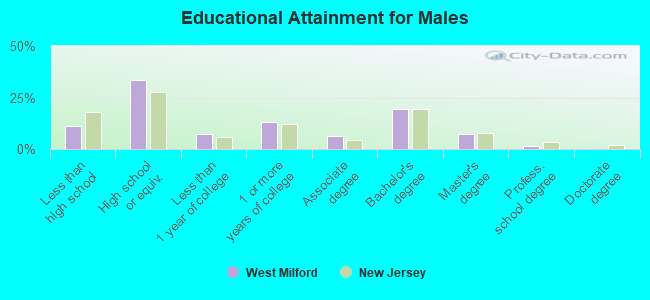
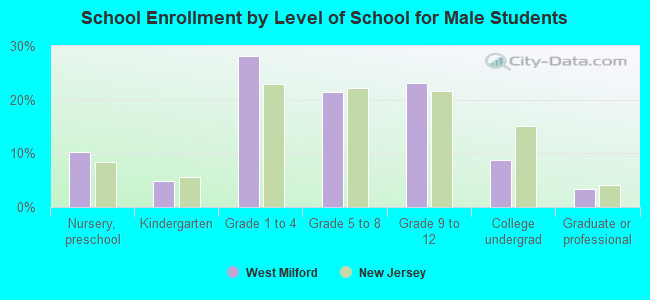
Education attainment for males 25 years and older:
No schooling: 28
Nursery to 4th grade: 0
5th and 6th grade: 13
7th and 8th grade: 213
9th grade: 151
10th grade: 166
11th grade: 160
12th grade, no diploma: 251
High school graduate (or equivalency): 2,896
Less than 1 year of college: 618
Some college more than 1 year, no degree: 1,151
Associate degree: 535
Bachelor's degree: 1,679
Master's degree: 637
Professional school degree: 123
Doctorate degree: 17
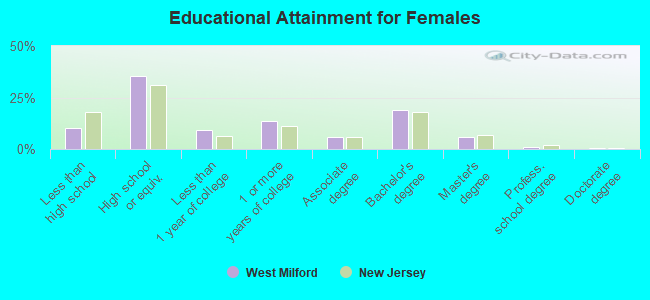
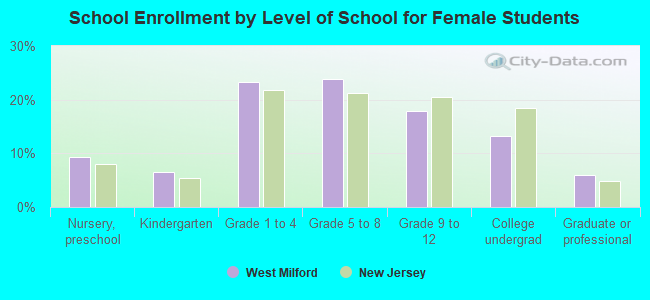
Education attainment for females 25 years and older:
No schooling: 43
Nursery to 4th grade: 0
5th and 6th grade: 29
7th and 8th grade: 135
9th grade: 66
10th grade: 229
11th grade: 209
12th grade, no diploma: 203
High school graduate (or equivalency): 3,205
Less than 1 year of college: 837
Some college more than 1 year, no degree: 1,212
Associate degree: 506
Bachelor's degree: 1,703
Master's degree: 519
Professional school degree: 89
Doctorate degree: 34
Housing units in structures:
One, detached: 8,701
One, attached: 452
Two: 221
3 or 4: 100
5 to 9: 165
10 to 19: 10
20 to 49: 95
50 or more: 146
Mobile homes: 19
Median worth of mobile homes: $1,244,860
Housing units lacking complete plumbing facilities: 1.0%
Housing units lacking complete kitchen facilities: 0.8%