Housing density: 665 houses/condos per square mile
Median price asked for vacant for-sale houses and condos in 2022 in this county: $628,500.
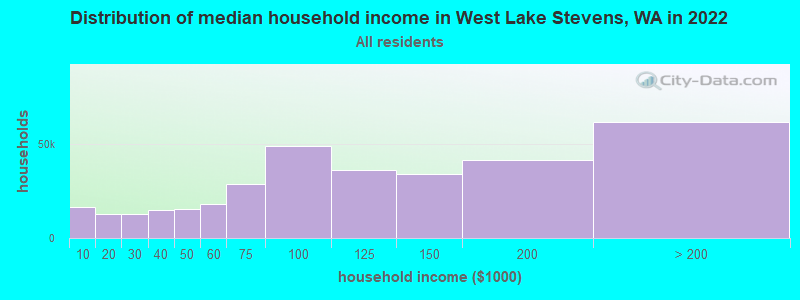
Median contract rent in 2022: $1,876 (lower quartile is $1,368, upper quartile is over $2,000)
Median rent asked for vacant for-rent units in 2022: $245
Median gross rent in West Lake Stevens, WA in 2022: over $2,000
Housing units in West Lake Stevens with a mortgage: 3,515 (580 second mortgage, 365 home equity loan, 22 both second mortgage and home equity loan) Houses without a mortgage: 441
Compare current foreclosures near West Lake Stevens, WA:
In family households: 589,694 (132,675 male householders, 49,607 female householders)
140,500 spouses, 208,748 children (193,212 natural, 5,027 adopted, 10,509 stepchildren), 9,881 grandchildren, 6,965 brothers or sisters, 6,533 parents, foster children, 9,131 other relatives, 20,713 non-relatives
In nonfamily households: 113,244 (43,016 male householders (30,707 living alone)), 43,027 female householders (34,612 living alone)), 27,201 nonrelatives
In group quarters: 10,397 (5,769 institutionalized population)
121,078 married couples with children.
33,184 single-parent households (9,051 men, 24,133 women).
93.5% of residents of West Lake Stevens speak English at home.
2.1% of residents speak Spanish at home (65% speak English very well, 13% speak English well, 19% speak English not well, 3% don't speak English at all).
2.2% of residents speak other Indo-European language at home (69% speak English very well, 25% speak English well, 7% speak English not well).
1.8% of residents speak Asian or Pacific Island language at home (62% speak English very well, 22% speak English well, 16% speak English not well).
0.3% of residents speak other language at home (100% speak English very well).
Foreign born population: 2,247 (9.1%)
(59.6% of them are naturalized citizens)
Year of entry for the foreign-born population in West Lake Stevens, Washington
941995 to March 2000
1781990 to 1994
1641985 to 1989
1401980 to 1984
341975 to 1979
561970 to 1974
521965 to 1969
144Before 1965
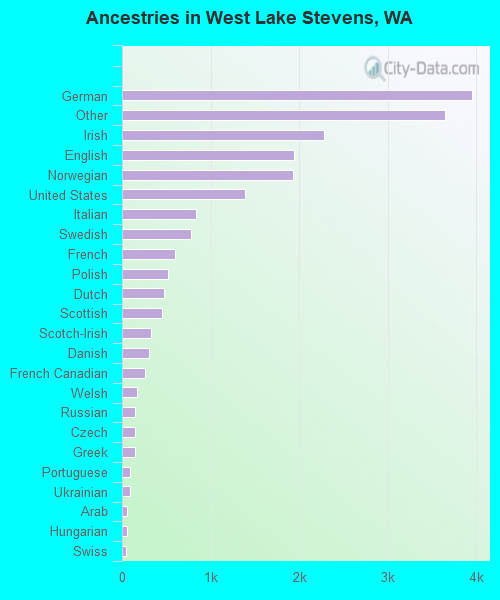
First ancestries reported:
German: 3,947 (19.1%)
Other: 3,643 (17.6%)
Irish: 2,283 (11.0%)
English: 1,944 (9.4%)
Norwegian: 1,932 (9.3%)
United States: 1,388 (6.7%)
Italian: 835 (4.0%)
Swedish: 775 (3.7%)
French: 600 (2.9%)
Polish: 518 (2.5%)
Dutch: 478 (2.3%)
Scottish: 450 (2.2%)
Scotch-Irish: 331 (1.6%)
Danish: 301 (1.5%)
French Canadian: 263 (1.3%)
Welsh: 169 (0.8%)
Russian: 148 (0.7%)
Czech: 147 (0.7%)
Greek: 147 (0.7%)
Portuguese: 89 (0.4%)
Ukrainian: 85 (0.4%)
Arab: 56 (0.3%)
Hungarian: 52 (0.3%)
Swiss: 50 (0.2%)
Slovak: 25 (0.1%)
West Indian: 13 (0.06%)
Subsaharan African: 12 (0.06%)
Lithuanian: 8 (0.04%)
Most common places of birth for foreign-born residents (%):
Philippines
West Lake Stevens:
18.7% (161)
Washington:
7.6% (46,733)
Vietnam
West Lake Stevens:
10.7% (92)
Washington:
6.7% (40,879)
Canada
West Lake Stevens:
10.4% (90)
Washington:
7.7% (47,568)
Ukraine
West Lake Stevens:
9.6% (83)
Washington:
3.0% (18,572)
Mexico
West Lake Stevens:
9.3% (80)
Washington:
24.1% (148,115)
Other Northern Europe
West Lake Stevens:
3.6% (31)
Washington:
1.0% (6,393)
United Kingdom
West Lake Stevens:
3.2% (28)
Washington:
3.3% (20,321)
Czechoslovakia (includes Czech Republic and Slovakia)
West Lake Stevens:
2.9% (25)
Washington:
0.3% (2,041)
Russia
West Lake Stevens:
2.8% (24)
Washington:
2.5% (15,491)
Poland
West Lake Stevens:
2.6% (22)
Washington:
0.7% (4,092)
Germany
West Lake Stevens:
2.4% (21)
Washington:
3.4% (21,167)
Korea
West Lake Stevens:
2.3% (20)
Washington:
6.2% (38,172)
Lebanon
West Lake Stevens:
1.9% (16)
Washington:
0.1% (913)
China, excluding Hong Kong and Taiwan
West Lake Stevens:
1.7% (15)
Washington:
3.3% (20,530)
Greece
West Lake Stevens:
1.6% (14)
Washington:
0.2% (1,387)
Honduras
West Lake Stevens:
1.5% (13)
Washington:
0.2% (1,381)
Place of birth for U.S.-born residents:
This state: 10,176
Other state: 6,674
Northeast: 483
Midwest: 1,627
South: 1,101
West: 3,463
43% of West Lake Stevens residents lived in the same house 5 years ago. Out of people who lived in different houses, 64% lived in this county. Out of people who lived in different counties, 55% lived in Washington.
Education attainment for males 25 years and older:
No schooling: 6
Nursery to 4th grade: 17
5th and 6th grade: 36
7th and 8th grade: 97
9th grade: 93
10th grade: 60
11th grade: 70
12th grade, no diploma: 233
High school graduate (or equivalency): 1,758
Less than 1 year of college: 449
Some college more than 1 year, no degree: 1,015
Associate degree: 507
Bachelor's degree: 809
Master's degree: 136
Professional school degree: 68
Doctorate degree: 11
Education attainment for females 25 years and older:
No schooling: 20
Nursery to 4th grade: 0
5th and 6th grade: 27
7th and 8th grade: 38
9th grade: 71
10th grade: 75
11th grade: 199
12th grade, no diploma: 136
High school graduate (or equivalency): 1,688
Less than 1 year of college: 591
Some college more than 1 year, no degree: 1,251
Associate degree: 474
Bachelor's degree: 622
Master's degree: 269
Professional school degree: 70
Doctorate degree: 0
Housing units in structures:
One, detached: 4,810
One, attached: 284
Two: 311
3 or 4: 236
5 to 9: 224
10 to 19: 13
20 to 49: 46
50 or more: 12
Mobile homes: 501
Median worth of mobile homes: $207,774
Housing units lacking complete plumbing facilities: 0.3%
Housing units lacking complete kitchen facilities: 0.2%