West Jordan, UT (Utah) Houses and Residents
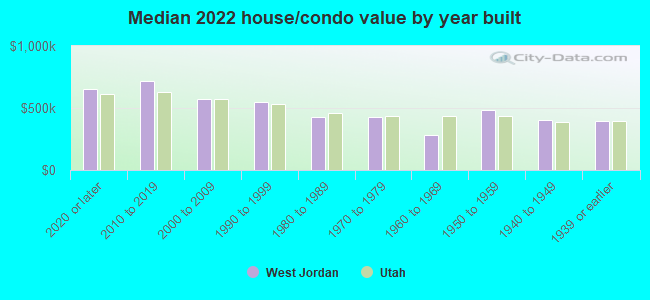
| West Jordan: | $499,000 |
| Utah: | $499,500 |
Mean price in 2022:
Detached houses: $545,203
Here: $545,203 State: $607,750 Townhouses or other attached units: $412,092
Here: $412,092 State: $444,505 In 3-to-4-unit structures: $415,576
Here: $415,576 State: $362,850 In 5-or-more-unit structures: $353,659
Here: $353,659 State: $412,810 Mobile homes: $140,710
Here: $140,710 State: $113,475
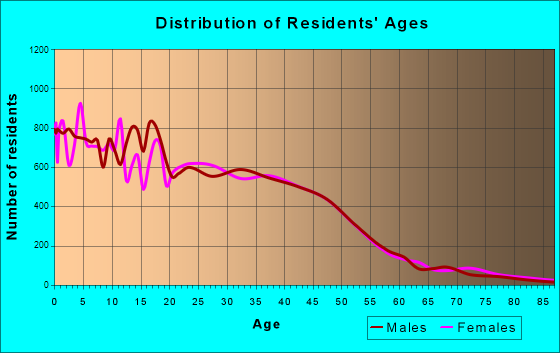
Total population: 110,920 (Urban population: 68,106, Rural population: 110 (all nonfarm))
Houses: 38,559 (37,031 occupied: 29,233 owner occupied, 7,798 renter occupied)
| % of renters here: | 21% |
| State: | 29% |
Housing density: 1,248 houses/condos per square mile
Median price asked for vacant for-sale houses and condos in 2022: $575,837.
Median contract rent in 2022: $1,518 (lower quartile is $1,191, upper quartile is $1,816)
Median rent asked for vacant for-rent units in 2022: $1,725
Median gross rent in West Jordan, UT in 2022: $1,613
Housing units in West Jordan with a mortgage: 22,192 (3,812 second mortgage, 51 home equity loan, 3,109 both second mortgage and home equity loan)
Houses without a mortgage: 413
Median household income for houses/condos with a mortgage: $118,189
Median household income for apartments without a mortgage: $81,664
Median monthly housing costs: $1,587
Compare current foreclosures in West Jordan, UT:
| Photo | Address | Area | Beds / Baths | Price | Details |
|---|---|---|---|---|---|

|
#1
W 6785 S
West Jordan, UT 84084
|
1,516 sq. feet
|
1 baths 3 beds |
show details | |

|
#2
S Sorrento Way
West Jordan, UT 84081
|
1,332 sq. feet
|
2 baths 4 beds |
show details | |

|
#3
S Interlochin Ln
West Jordan, UT 84084
|
2,054 sq. feet
|
2 baths 3 beds |
show details | |

|
#4
W Cottage Point Dr
West Jordan, UT 84081
|
1,548 sq. feet
|
2 baths 5 beds |
show details | |

|
#5
Westland Dr
West Jordan, UT 84088
|
3,053 sq. feet
|
5 baths 8 beds |
show details | |

|
#6
S 2870 W
West Jordan, UT 84088
|
1,310 sq. feet
|
2 baths 4 beds |
show details | |

|
#7
Saddle Hollow Pl
West Jordan, UT 84081
|
1,830 sq. feet
|
2 baths 3 beds |
show details | |

|
#8
W 7000 S
West Jordan, UT 84081
|
1,044 sq. feet
|
1 baths 3 beds |
show details | |

|
#9
S 1850 W
West Jordan, UT 84088
|
3,296 sq. feet
|
2 baths 3 beds |
show details | |

|
#10
W Kentucky Dr
West Jordan, UT 84084
|
1,427 sq. feet
|
2 baths 4 beds |
show details |
| Photo | Address | Area | Beds / Baths | Price | Details |
|---|---|---|---|---|---|

|
#11
W 8525 S
West Jordan, UT 84088
|
1,338 sq. feet
|
1 baths 3 beds |
show details | |

|
#12
W Valley Maple Dr
West Jordan, UT 84081
|
2,171 sq. feet
|
2 baths 4 beds |
show details | |

|
#13
S 5095 W
West Jordan, UT 84081
|
1,534 sq. feet
|
1 baths 3 beds |
show details | |

|
#14
W Van St
West Jordan, UT 84088
|
1,466 sq. feet
|
2 baths 3 beds |
show details | |

|
#15
S 2700 W # South
West Jordan, UT 84088
|
2,936 sq. feet
|
5 baths 6 beds |
show details | |

|
#16
S Callie Dr
West Jordan, UT 84084
|
1,560 sq. feet
|
1 baths 3 beds |
show details | |

|
#17
River Ridge Dr
West Jordan, UT 84088
|
1,221 sq. feet
|
1 baths 3 beds |
show details | |

|
#18
S Bromley Rd
West Jordan, UT 84084
|
1,892 sq. feet
|
4 baths 3 beds |
show details | |

|
#19
S Wakefield Way
West Jordan, UT 84081
|
2,462 sq. feet
|
2 baths 6 beds |
show details | |

|
#20
W 8620 S
West Jordan, UT 84081
|
2,354 sq. feet
|
2 baths 4 beds |
show details |
| Photo | Address | Area | Beds / Baths | Price | Details |
|---|---|---|---|---|---|

|
#21
W Athleen Dr
West Jordan, UT 84084
|
1,350 sq. feet
|
1 baths 4 beds |
show details | |

|
#22
S 3335 W
West Jordan, UT 84084
|
1,415 sq. feet
|
2 baths 3 beds |
show details | |

|
#23
S 2400 W
West Jordan, UT 84084
|
1,894 sq. feet
|
2 baths 4 beds |
show details | |

|
#24
S Clematis Way
West Jordan, UT 84081
|
1,660 sq. feet
|
1 baths 4 beds |
show details | |

|
#25
Copper Pot Ln
West Jordan, UT 84088
|
1,676 sq. feet
|
2 baths 3 beds |
show details | |

|
#26
Green Acre Dr
West Jordan, UT 84088
|
1,797 sq. feet
|
1 baths 4 beds |
show details | |

|
#27
S Brittany Town Dr
West Jordan, UT 84084
|
656 sq. feet
|
2 baths 3 beds |
show details | |

|
#28
S Firenze Pl
West Jordan, UT 84081
|
1,537 sq. feet
|
2 baths 3 beds |
show details | |

|
#29
W Liza Ln
West Jordan, UT 84081
|
1,068 sq. feet
|
2 baths 3 beds |
show details | |

|
#30
W Green Acre Dr
West Jordan, UT 84088
|
1,304 sq. feet
|
1 baths 3 beds |
show details |
| Photo | Address | Area | Beds / Baths | Price | Details |
|---|---|---|---|---|---|

|
#31
Running Springs Dr
West Jordan, UT 84084
|
1,634 sq. feet
|
2 baths 4 beds |
show details | |

|
#32
W Black Elk Way
West Jordan, UT 84088
|
2,652 sq. feet
|
2 baths 5 beds |
show details | |

|
#33
S Robert Cir
West Jordan, UT 84084
|
1,753 sq. feet
|
2 baths 5 beds |
show details | |

|
#34
W Lower Huntly Way
West Jordan, UT 84088
|
1,510 sq. feet
|
2 baths 3 beds |
show details | |

|
#35
W 8600 S
West Jordan, UT 84088
|
2,172 sq. feet
|
4 baths 5 beds |
show details | |

|
#36
Moreland Cir
West Jordan, UT 84084
|
1,677 sq. feet
|
2 baths 4 beds |
show details | |

|
#37
S Traveler Ln
West Jordan, UT 84081
|
665 sq. feet
|
2 baths 3 beds |
show details | |

|
#38
W 7550 S
West Jordan, UT 84084
|
1,816 sq. feet
|
2 baths 4 beds |
show details | |

|
#39
W 7095 S
West Jordan, UT 84084
|
2,000 sq. feet
|
3 baths 3 beds |
show details | |

|
#40
Madison Nan Dr
West Jordan, UT 84081
|
1,350 sq. feet
|
2 baths 3 beds |
show details |
| Photo | Address | Area | Beds / Baths | Price | Details |
|---|---|---|---|---|---|

|
#41
W Saguaro Dr
West Jordan, UT 84081
|
1,360 sq. feet
|
1 baths 4 beds |
show details | |

|
#42
W Yellow Poppy Dr
West Jordan, UT 84081
|
644 sq. feet
|
2 baths 3 beds |
show details | |

|
#43
W 7990 S
West Jordan, UT 84088
|
898 sq. feet
|
2 baths 4 beds |
show details | |

|
#44
W 7600 S Apt 416
West Jordan, UT 84084
|
643 sq. feet
|
2 baths 3 beds |
show details | |

|
#45
S Mcginnis Ln
West Jordan, UT 84081
|
2,264 sq. feet
|
3 baths 4 beds |
show details | |

|
#46
S 3420 W
West Jordan, UT 84084
|
1,000 sq. feet
|
1 baths 3 beds |
show details | |

|
#47
Westfield Cir
West Jordan, UT 84084
|
1,032 sq. feet
|
1 baths 3 beds |
show details | |

|
#48
W Vistawest Dr
West Jordan, UT 84088
|
1,803 sq. feet
|
2 baths 3 beds |
show details | |

|
#49
S 1500 W
West Jordan, UT 84088
|
1,095 sq. feet
|
1 baths 3 beds |
show details | |

|
Check over 1 million property listings on Foreclosure.com!
|
browse all offers | |||


 | Are homes in West Valley City the most affordable in the Salt Lake City metro area ? (7 replies) |
| Areas around Draper for Apartments? (2 replies) |
| Apartment recommendations near West Jordan with/near dog park (15 replies) |
| Best apartments in SLC (14 replies) |
| Sites to find houses for rent? (6 replies) |
| Good areas with new construction homes? (10 replies) |
Median year apartment built: 2000
Household type by relationship:
Households: 116,662- Male householders: 19,225 (3,159 living alone), Female householders: 17,806 (2,638 living alone)
22,231 spouses (21,661 opposite-sex spouses), 2,484 unmarried partners, (2,374 opposite-sex unmarried partners), 38,822 children (35,680 natural, 1,405 adopted, 1,737 stepchildren), 3,851 grandchildren, 1,325 brothers or sisters, 2,615 parents, 0 foster children, 4,031 other relatives, 3,636 non-relatives
- In group quarters: 636
Size of family households: 9,105 2-persons, 6,212 3-persons, 6,706 4-persons, 3,821 5-persons, 1,706 6-persons, 1,506 7-or-more-persons.
Size of nonfamily households: 5,797 1-person, 1,674 2-persons, 239 3-persons, 137 4-persons, 128 6-persons.
23,006 married couples with children.
4,337 single-parent households (1,764 men, 2,573 women).
79.0% of residents of West Jordan speak English at home.
15.8% of residents speak Spanish at home (61% speak English very well, 18% speak English well, 14% speak English not well, 7% don't speak English at all).
1.4% of residents speak other Indo-European language at home (83% speak English very well, 9% speak English well, 9% speak English not well).
3.0% of residents speak Asian or Pacific Island language at home (64% speak English very well, 21% speak English well, 11% speak English not well, 4% don't speak English at all).
0.3% of residents speak other language at home (87% speak English very well, 11% speak English well, 2% don't speak English at all).
Foreign born population: 13,665 (11.7%)
(45.3% of them are naturalized citizens)
| Here: | 7.6 |
| State: | 7.6 |
| Here: | 4.2 |
| State: | 4.3 |
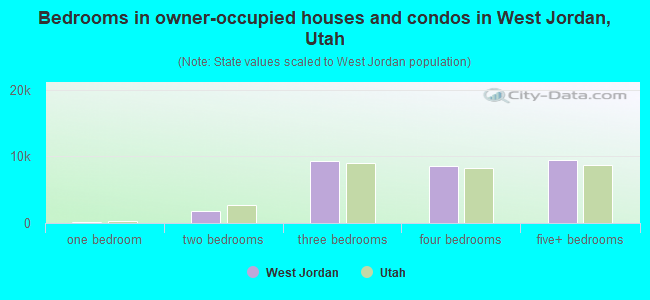
- Bedrooms in owner-occupied houses and condos in West Jordan, Utah
- 0no bedroom
- 841 bedroom
- 1,8322 bedrooms
- 9,3453 bedrooms
- 8,5754 bedrooms
- 9,3975+ bedrooms
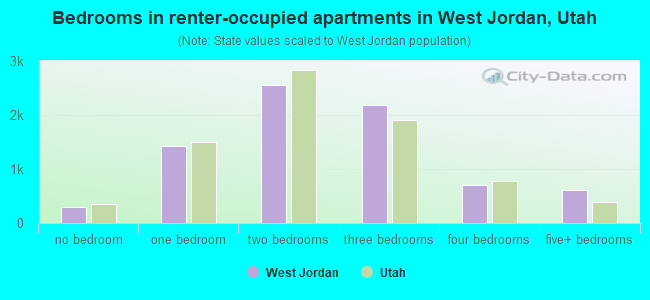
- Bedrooms in renter-occupied apartments in West Jordan, Utah
- 303no bedroom
- 1,4341 bedroom
- 2,5612 bedrooms
- 2,1803 bedrooms
- 7114 bedrooms
- 6095+ bedrooms
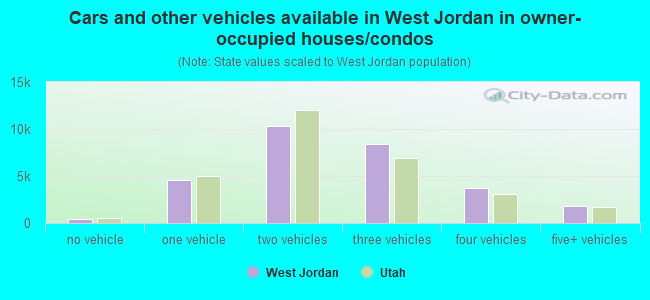
- Cars and other vehicles available in West Jordan in owner-occupied houses/condos
- 379no vehicle
- 4,5471 vehicle
- 10,3482 vehicles
- 8,4453 vehicles
- 3,6844 vehicles
- 1,8305+ vehicles
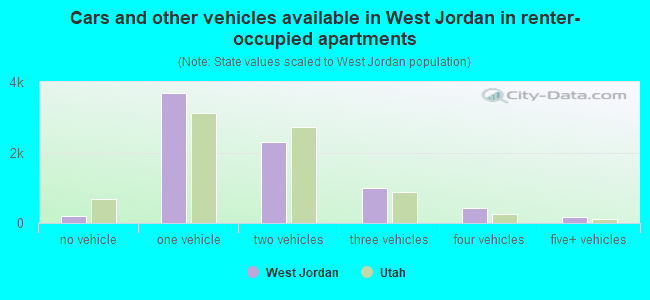
- Cars and other vehicles available in West Jordan in renter-occupied apartments
- 208no vehicle
- 3,6941 vehicle
- 2,2932 vehicles
- 1,0073 vehicles
- 4344 vehicles
- 1625+ vehicles
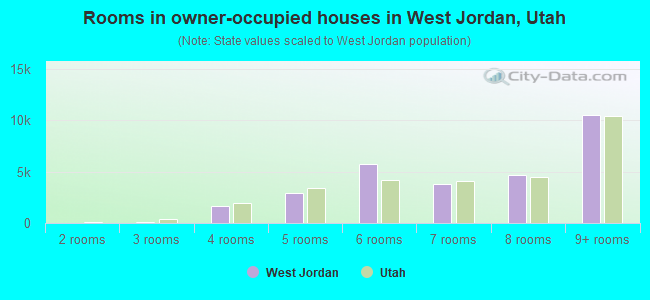
- Rooms in owner-occupied houses in West Jordan, Utah
- 01 room
- 02 rooms
- 1363 rooms
- 1,6354 rooms
- 2,8815 rooms
- 5,6896 rooms
- 3,7637 rooms
- 4,6278 rooms
- 10,5029+ rooms
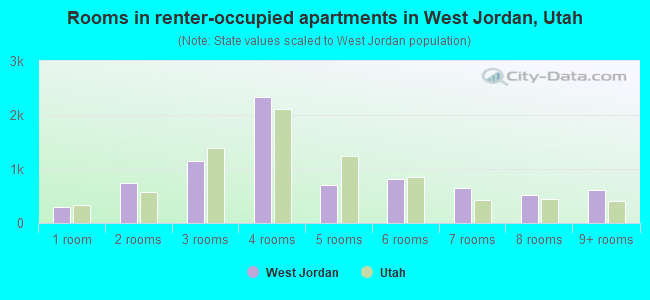
- Rooms in renter-occupied apartments in West Jordan, Utah
- 3031 room
- 7472 rooms
- 1,1473 rooms
- 2,3294 rooms
- 6955 rooms
- 8106 rooms
- 6407 rooms
- 5198 rooms
- 6089+ rooms
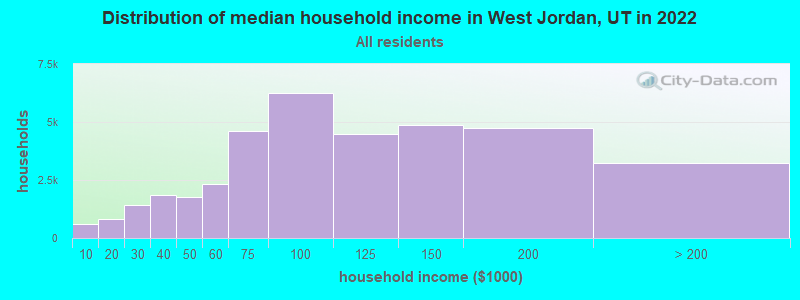
West Jordan, UT household income distribution

- 590Less than $10,000
- 808$10,000 to $19,999
- 1,408$20,000 to $29,999
- 1,873$30,000 to $39,999
- 1,781$40,000 to $49,999
- 2,349$50,000 to $59,999
- 4,595$60,000 to $74,999
- 6,265$75,000 to $99,999
- 4,489$100,000 to $124,999
- 4,883$125,000 to $149,999
- 4,759$150,000 to $199,999
- 3,231$200,000 or more
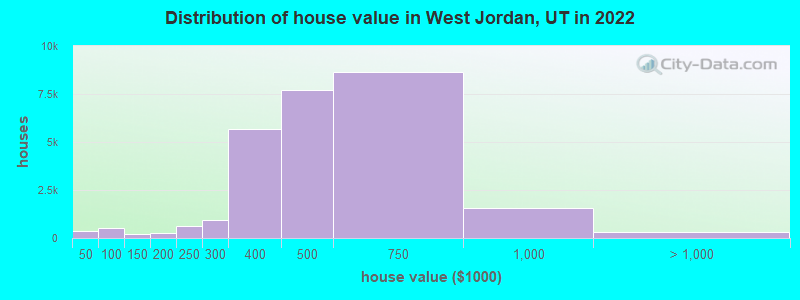
Home value of owner - occupied houses in 2022 in West Jordan, UT
-
- 63Less than $10,000
- 13$10,000 to $14,999
- 31$15,000 to $19,999
- 34$20,000 to $24,999
- 33$25,000 to $29,999
- 35$30,000 to $34,999
- 60$35,000 to $39,999
- 98$40,000 to $49,999
- 121$50,000 to $59,999
- 26$60,000 to $69,999
- 77$70,000 to $79,999
- 187$80,000 to $89,999
- 11$90,000 to $99,999
- 136$100,000 to $124,999
- 70$125,000 to $149,999
- 82$150,000 to $174,999
- 185$175,000 to $199,999
- 637$200,000 to $249,999
- 949$250,000 to $299,999
- 5,697$300,000 to $399,999
- 7,724$400,000 to $499,999
- 8,626$500,000 to $749,999
- 1,562$750,000 to $999,999
- 133$1,000,000 to $1,499,999
- 22$1,500,000 to $1,999,999
- 143$2,000,000 or more
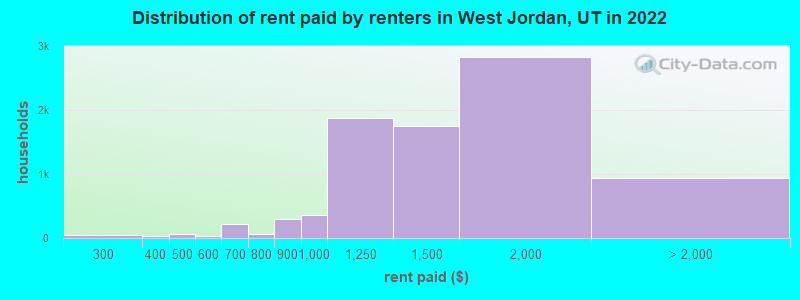
Rent paid by renters in 2022 in West Jordan, UT
-
- 30$200 to $249
- 11$250 to $299
- 11$300 to $349
- 17$350 to $399
- 23$400 to $449
- 38$450 to $499
- 6$500 to $549
- 27$550 to $599
- 172$600 to $649
- 44$650 to $699
- 34$700 to $749
- 35$750 to $799
- 303$800 to $899
- 359$900 to $999
- 1,871$1,000 to $1,249
- 1,744$1,250 to $1,499
- 2,823$1,500 to $1,999
- 729$2,000 to $2,499
- 49$2,500 to $2,999
- 157No cash rent
Percentage of workers working in this county: 93.2%
Number of people working at home: 12,031 (18.6% of all workers)
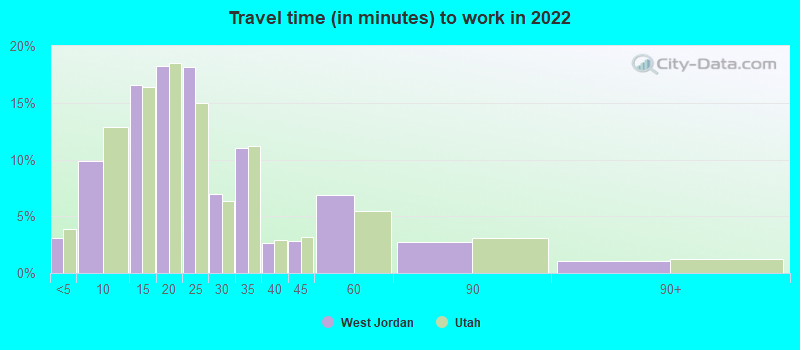
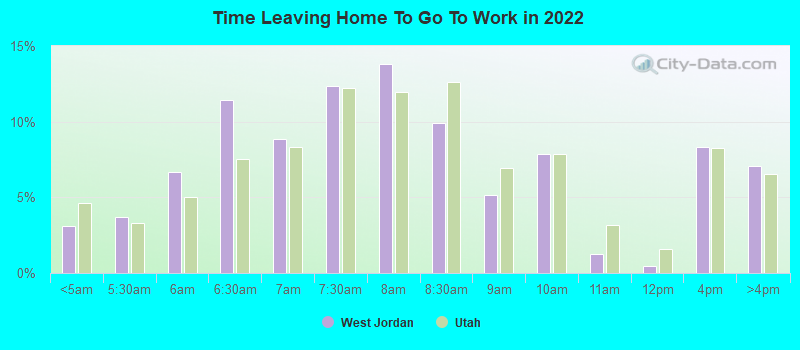
Travel time to work (commute)
- Less than 5 minutes: 1,091
- 5 to 9 minutes: 4,608
- 10 to 14 minutes: 5,249
- 15 to 19 minutes: 7,910
- 20 to 24 minutes: 11,466
- 25 to 29 minutes: 4,528
- 30 to 34 minutes: 9,402
- 35 to 39 minutes: 735
- 40 to 44 minutes: 1,643
- 45 to 59 minutes: 2,470
- 60 to 89 minutes: 1,919
- 90 or more minutes: 359
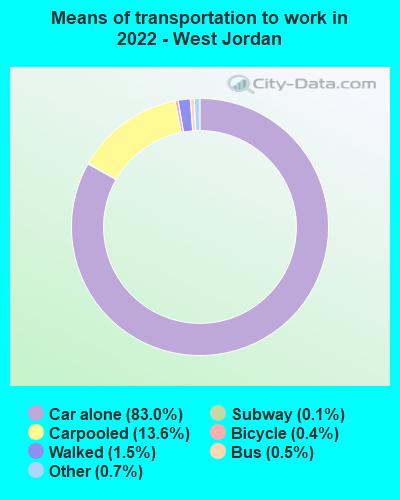
Means of transportation to work:
- Drove a car alone: 25,161 (61.2%)
- Carpooled: 4,434 (10.8%)
- Bus: 101 (0.2%)
- Long-distance train or commuter rail: 21 (0.1%)
- Light rail, streetcar or trolley: 1 (0.0%)
- Ferryboat: 14 (0.0%)
- Taxi: 234 (0.6%)
- Bicycle: 114 (0.3%)
- Walked: 474 (1.2%)
- Worked at home: 12,031 (29.3%)
- Unemployment by race in 2022
- Unemployment rate for White non-Hispanic residents
- 2.1%Males
- 4.4%Females
- Unemployment rate for Black residents
- 4.6%Males
- 1.9%Females
- Unemployment rate for American Indian and Alaska Native residents
- 20.4%Males
- Unemployment rate for Asian residents
- 0.4%Females
- Unemployment rate for other race residents
- 4.9%Males
- 9.8%Females
- Unemployment rate for two or more race residents
- 4.9%Males
- 10.0%Females
- Unemployment rate for Hispanic or Latino residents
- 4.9%Males
- 9.6%Females
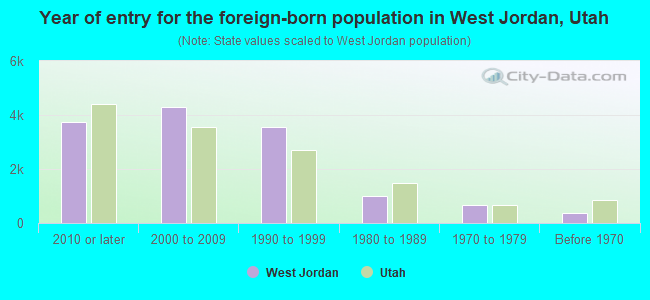
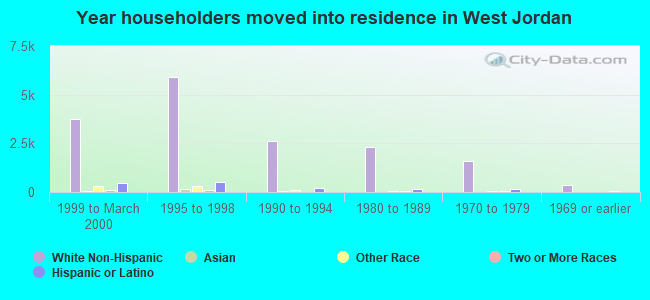
- Year of entry for the foreign-born population in West Jordan, Utah
- 3,7572010 or later
- 4,2952000 to 2009
- 3,5411990 to 1999
- 1,0141980 to 1989
- 6731970 to 1979
- 380Before 1970
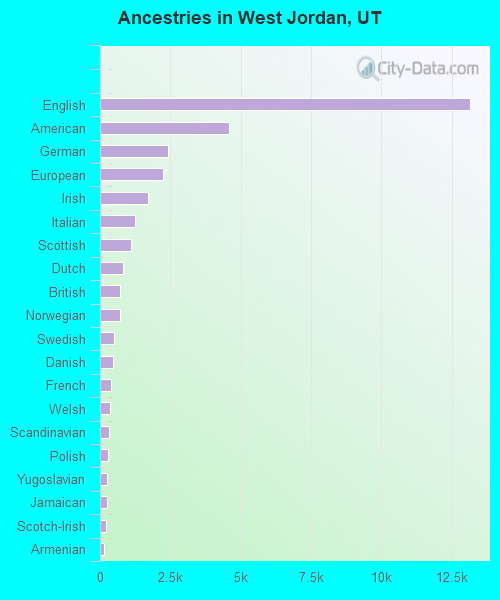
First ancestries reported:
- English: 13,166 (22.4%)
- American: 4,586 (7.8%)
- German: 2,417 (4.1%)
- European: 2,248 (3.8%)
- Irish: 1,693 (2.9%)
- Italian: 1,255 (2.1%)
- Scottish: 1,085 (1.8%)
- Dutch: 815 (1.4%)
- British: 725 (1.2%)
- Norwegian: 718 (1.2%)
- Swedish: 502 (0.9%)
- Danish: 471 (0.8%)
- French: 400 (0.7%)
- Welsh: 363 (0.6%)
- Scandinavian: 321 (0.5%)
- Polish: 290 (0.5%)
- Yugoslavian: 239 (0.4%)
- Jamaican: 239 (0.4%)
- Scotch-Irish: 202 (0.3%)
- Armenian: 137 (0.2%)
- Northern European: 113 (0.2%)
- Greek: 104 (0.2%)
- Swiss: 90 (0.2%)
- Belgian: 73 (0.1%)
- Syrian: 70 (0.1%)
- Brazilian: 69 (0.1%)
- Czech: 64 (0.1%)
- Slovak: 63 (0.1%)
- Iranian: 59 (0.1%)
- French Canadian: 52 (0.09%)
- Croatian: 49 (0.08%)
- Trinidadian and Tobagonian: 49 (0.08%)
- Latvian: 45 (0.08%)
- Lebanese: 44 (0.07%)
- Canadian: 39 (0.07%)
- Romanian: 35 (0.06%)
- Turkish: 34 (0.06%)
- Slavic: 34 (0.06%)
- Portuguese: 32 (0.05%)
- Russian: 32 (0.05%)
- African: 27 (0.05%)
- Ukrainian: 25 (0.04%)
- Iraqi: 23 (0.04%)
- Eastern European: 21 (0.04%)
- Israeli: 21 (0.04%)
- Egyptian: 18 (0.03%)
- Basque: 17 (0.03%)
- Hungarian: 14 (0.02%)
- Lithuanian: 12 (0.02%)
- Maltese: 9 (0.02%)
- Ghanaian: 9 (0.02%)
- Sudanese: 8 (0.01%)
- Australian: 6 (0.01%)
- Albanian: 4 (0.01%)
Most common places of birth for foreign-born residents (%):
| West Jordan: | 39.6% (5,723) |
| Utah: | 36.1% (99,740) |
| West Jordan: | 14.1% (2,033) |
| Utah: | 3.2% (8,804) |
| West Jordan: | 5.5% (791) |
| Utah: | 2.0% (5,555) |
| West Jordan: | 4.4% (631) |
| Utah: | 2.6% (7,211) |
| West Jordan: | 3.7% (535) |
| Utah: | 2.3% (6,468) |
| West Jordan: | 2.8% (403) |
| Utah: | 1.3% (3,570) |
| West Jordan: | 2.8% (400) |
| Utah: | 1.3% (3,479) |
| West Jordan: | 2.6% (377) |
| Utah: | 2.1% (5,902) |
| West Jordan: | 2.1% (305) |
| Utah: | 2.6% (7,062) |
| West Jordan: | 1.7% (253) |
| Utah: | 0.2% (527) |
| West Jordan: | 1.7% (252) |
| Utah: | 3.0% (8,341) |
| West Jordan: | 1.7% (245) |
| Utah: | 2.9% (7,901) |
| West Jordan: | 1.5% (217) |
| Utah: | 2.7% (7,472) |
Place of birth for U.S.-born residents:
- This state: 75,606
- Other state: 27,078
- Northeast: 2,072
- Midwest: 3,197
- South: 3,742
- West: 18,067
87.7% of West Jordan residents lived in the same house 1 years ago.
Out of people who lived in different houses, 42.1% lived in this county.
Out of people who lived in different counties, 51.4% lived in Utah.
| West Jordan: | 87.7% |
| State average: | 85.7% |
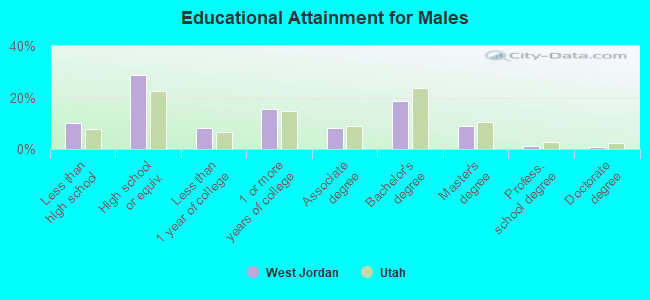
Education attainment for males 25 years and older:
- No schooling: 527
- Nursery to 4th grade: 40
- 5th and 6th grade: 431
- 7th and 8th grade: 62
- 9th grade: 211
- 10th grade: 46
- 11th grade: 427
- 12th grade, no diploma: 1,974
- High school graduate (or equivalency): 10,710
- Less than 1 year of college: 3,116
- Some college more than 1 year, no degree: 5,793
- Associate degree: 3,082
- Bachelor's degree: 6,936
- Master's degree: 3,371
- Professional school degree: 373
- Doctorate degree: 305
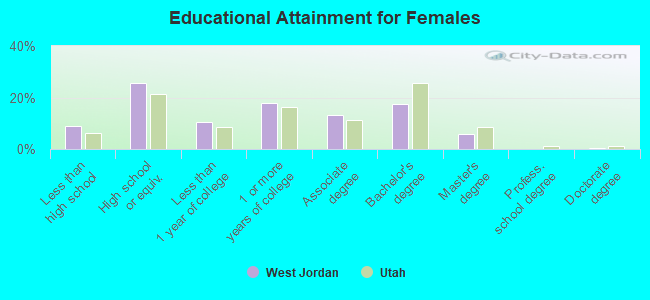
Education attainment for females 25 years and older:
- No schooling: 627
- Nursery to 4th grade: 57
- 5th and 6th grade: 532
- 7th and 8th grade: 0
- 9th grade: 325
- 10th grade: 416
- 11th grade: 229
- 12th grade, no diploma: 1,154
- High school graduate (or equivalency): 9,567
- Less than 1 year of college: 3,937
- Some college more than 1 year, no degree: 6,778
- Associate degree: 4,979
- Bachelor's degree: 6,571
- Master's degree: 2,259
- Professional school degree: 67
- Doctorate degree: 113
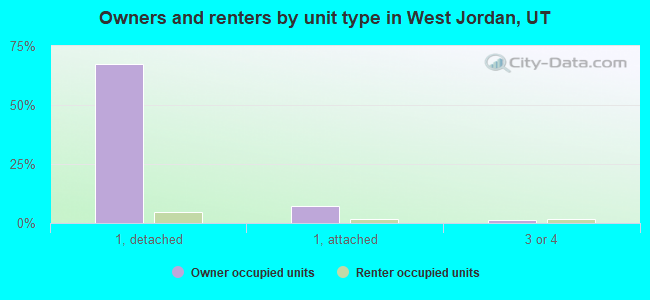
Housing units in structures:
- One, detached: 26,964
- One, attached: 3,582
- 3 or 4: 1,396
- 5 to 9: 255
- 10 to 19: 1,630
- 20 to 49: 1,936
- 50 or more: 1,636
- Mobile homes: 1,160
Median worth of mobile homes: $118,400
Housing units lacking complete kitchen facilities in 2022: 0.7%
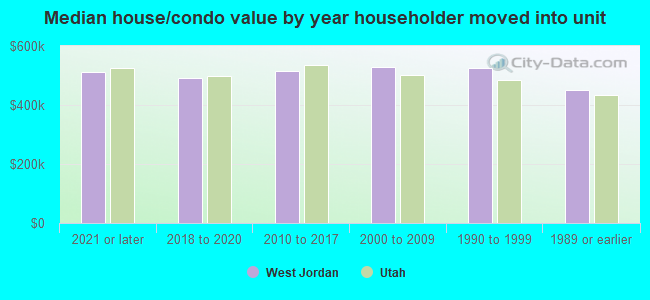
House/condo owner moved in on average 11 years ago
Renter moved in on average 2 years ago
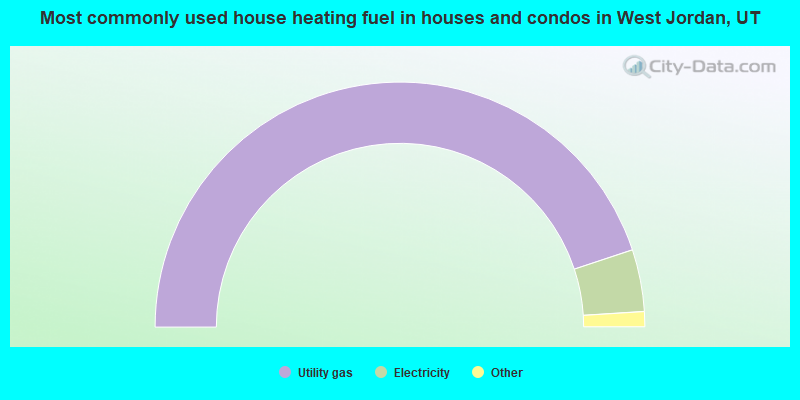
- 89.9%Utility gas
- 8.2%Electricity
- 1.2%Bottled, tank, or LP gas
- 0.5%Solar energy
- 0.1%Wood
- 0.1%No fuel used
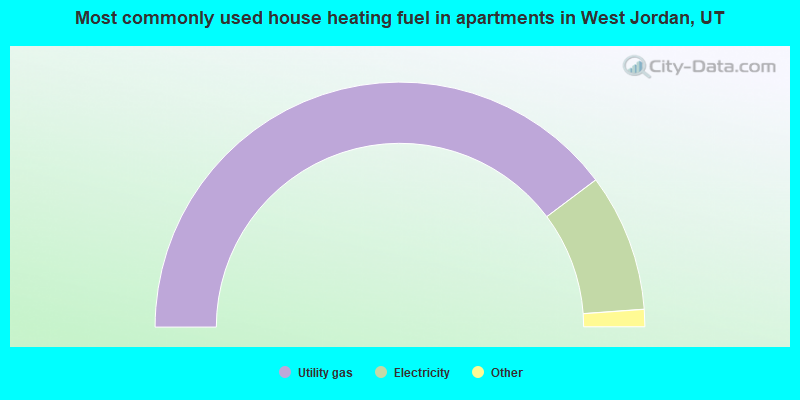
- 79.5%Utility gas
- 18.2%Electricity
- 1.3%Bottled, tank, or LP gas
- 0.6%No fuel used
- 0.2%Wood
- 0.1%Other fuel
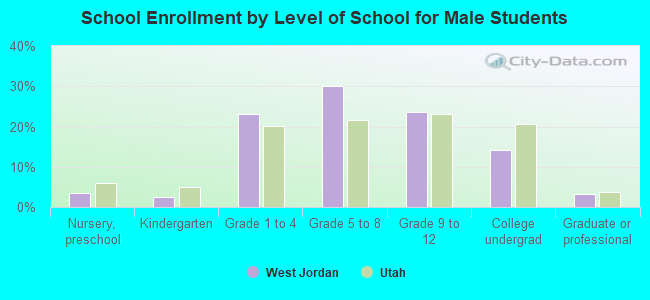
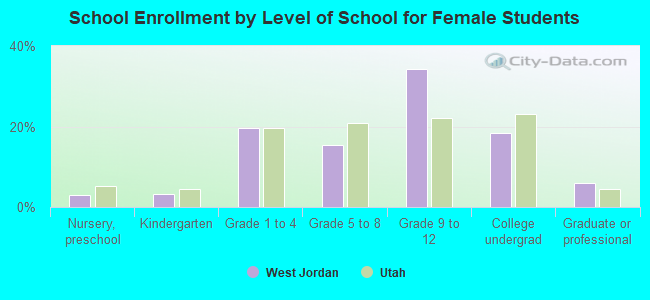
Private vs. public school enrollment:
| Here: | 11.2% |
| Utah: | 7.2% |
| Here: | 8.7% |
| Utah: | 5.3% |
| Here: | 17.3% |
| Utah: | 26.7% |