West Haven, CT (Connecticut) Houses and Residents
| West Haven: | $265,790 |
| Connecticut: | $347,200 |
Mean price in 2022:
Detached houses: $278,915
Here: $278,915 State: $503,946 Townhouses or other attached units: $212,351
Here: $212,351 State: $304,959 In 2-unit structures: $220,151
Here: $220,151 State: $304,133 In 3-to-4-unit structures: $186,853
Here: $186,853 State: $272,970 In 5-or-more-unit structures: $161,604
Here: $161,604 State: $249,308 Mobile homes: $173,809
Here: $173,809 State: $151,361
Total population: 54,905 (Urban population: 52,360, Rural population: 0)
Houses: 22,020 (20,524 occupied: 10,804 owner occupied, 9,945 renter occupied)
| % of renters here: | 48% |
| State: | 34% |
Housing density: 2,032 houses/condos per square mile
Median price asked for vacant for-sale houses and condos in 2022: $343,600.
Median contract rent in 2022: $1,120 (lower quartile is $909, upper quartile is $1,346)
Median rent asked for vacant for-rent units in 2022: $1,083
Median gross rent in West Haven, CT in 2022: $1,308
Housing units in West Haven with a mortgage: 7,266 (797 second mortgage, 12 home equity loan, 622 both second mortgage and home equity loan)
Houses without a mortgage: 903
Median household income for houses/condos with a mortgage: $114,503
Median household income for apartments without a mortgage: $77,072
Median monthly housing costs: $1,421
Compare current foreclosures in West Haven, CT:
| Photo | Address | Area | Beds / Baths | Price | Details |
|---|---|---|---|---|---|

|
#1
Ellsworth St
West Haven, CT 06516
|
960 sq. feet
|
1 baths 3 beds |
$365,000
|
show details |

|
#2
Center St
West Haven, CT 06516
|
1,874 sq. feet
|
1 baths 4 beds |
show details | |

|
#3
Forest Hills Rd
West Haven, CT 06516
|
1,638 sq. feet
|
1 baths 3 beds |
show details | |

|
#4
Boylston St
West Haven, CT 06516
|
1,420 sq. feet
|
3 baths 2 beds |
show details | |

|
#5
Prindle Rd
West Haven, CT 06516
|
1,682 sq. feet
|
1 baths 4 beds |
show details | |

|
#6
3rd Ave
West Haven, CT 06516
|
959 sq. feet
|
1 baths 3 beds |
show details | |

|
#7
Milton Ave
West Haven, CT 06516
|
1,984 sq. feet
|
1 baths 3 beds |
show details | |

|
#8
Martin St
West Haven, CT 06516
|
1,528 sq. feet
|
1 baths 3 beds |
show details | |

|
#9
Fay St
West Haven, CT 06516
|
996 sq. feet
|
1 baths 3 beds |
show details | |

|
#10
Chauncey St
West Haven, CT 06516
|
938 sq. feet
|
1 baths 2 beds |
show details |
| Photo | Address | Area | Beds / Baths | Price | Details |
|---|---|---|---|---|---|

|
#11
Ocean Ave
West Haven, CT 06516
|
2,234 sq. feet
|
2 baths 3 beds |
show details | |

|
#12
Savin Park
West Haven, CT 06516
|
1,386 sq. feet
|
1 baths 3 beds |
show details | |

|
#13
Union Ave
West Haven, CT 06516
|
1,618 sq. feet
|
2 baths 3 beds |
show details | |

|
#14
Jones Hill Rd
West Haven, CT 06516
|
1,016 sq. feet
|
2 baths 3 beds |
show details | |

|
#15
Jones Hill Rd
West Haven, CT 06516
|
1,416 sq. feet
|
1 baths 3 beds |
show details | |

|
#16
California St
West Haven, CT 06516
|
1,260 sq. feet
|
1 baths 3 beds |
show details | |

|
#17
2nd Ave
West Haven, CT 06516
|
1,148 sq. feet
|
1 baths 2 beds |
show details | |

|
#18
Contact Dr
West Haven, CT 06516
|
936 sq. feet
|
1 baths 3 beds |
show details | |

|
#19
Green Hill Ln
West Haven, CT 06516
|
1,420 sq. feet
|
2 baths 3 beds |
show details | |

|
#20
Saw Mill Rd
West Haven, CT 06516
|
3,208 sq. feet
|
3 baths 4 beds |
show details |
| Photo | Address | Area | Beds / Baths | Price | Details |
|---|---|---|---|---|---|

|
#21
Plainfield Ave Unit 36
West Haven, CT 06516
|
718 sq. feet
|
1 baths 2 beds |
show details | |

|
#22
Platt Ave
West Haven, CT 06516
|
3,176 sq. feet
|
3 baths 4 beds |
show details | |

|
#23
Alden Rd
West Haven, CT 06516
|
1,548 sq. feet
|
1 baths 2 beds |
show details | |

|
#24
West Walk
West Haven, CT 06516
|
1,093 sq. feet
|
1 baths 2 beds |
show details | |

|
#25
3rd Ave # 1
West Haven, CT 06516
|
2,989 sq. feet
|
3 baths 5 beds |
show details | |

|
#26
Crest St # B10
West Haven, CT 06516
|
1,128 sq. feet
|
1 baths 2 beds |
show details | |

|
#27
Alling Street Ext
West Haven, CT 06516
|
1,068 sq. feet
|
1 baths 3 beds |
show details | |

|
#28
Rockdale Rd
West Haven, CT 06516
|
1,132 sq. feet
|
1 baths 4 beds |
show details | |

|
#29
Grove Pl
West Haven, CT 06516
|
1,120 sq. feet
|
1 baths 4 beds |
show details | |

|
#30
Saw Mill Rd
West Haven, CT 06516
|
3,240 sq. feet
|
1 baths 2 beds |
show details |
| Photo | Address | Area | Beds / Baths | Price | Details |
|---|---|---|---|---|---|

|
#31
Swampscott St
West Haven, CT 06516
|
960 sq. feet
|
1 baths 3 beds |
show details | |

|
#32
Beatrice Dr
West Haven, CT 06516
|
1,056 sq. feet
|
1 baths 3 beds |
show details | |

|
#33
Tuthill St
West Haven, CT 06516
|
1,283 sq. feet
|
1 baths 3 beds |
show details | |

|
#34
Washington Manor Ave
West Haven, CT 06516
|
1,567 sq. feet
|
1 baths 3 beds |
show details | |

|
#35
Jaffrey St
West Haven, CT 06516
|
1,192 sq. feet
|
1 baths 2 beds |
show details | |

|
#36
Ocean Ave # 2
West Haven, CT 06516
|
- sq. feet
|
- baths - beds |
show details | |

|
#37
Campbell Ave Apt 53
West Haven, CT 06516
|
- sq. feet
|
- baths - beds |
show details | |

|
#38
Park St Apt 1
West Haven, CT 06516
|
- sq. feet
|
- baths - beds |
show details | |

|
#39
Main St Apt F102
West Haven, CT 06516
|
- sq. feet
|
- baths - beds |
show details | |

|
#40
Cordone Cir
West Haven, CT 06516
|
- sq. feet
|
- baths - beds |
show details |
| Photo | Address | Area | Beds / Baths | Price | Details |
|---|---|---|---|---|---|

|
#41
Crest St Apt 24d
West Haven, CT 06516
|
- sq. feet
|
- baths - beds |
show details | |

|
#42
Claudia Dr Apt 248
West Haven, CT 06516
|
- sq. feet
|
- baths - beds |
show details | |

|
#43
Country Hill Dr
West Haven, CT 06516
|
- sq. feet
|
- baths - beds |
show details | |

|
#44
Elm St Apt 27
West Haven, CT 06516
|
- sq. feet
|
- baths - beds |
show details | |

|
#45
Elizabeth St
West Haven, CT 06516
|
- sq. feet
|
- baths - beds |
show details | |

|
#46
Savin Ave # 2
West Haven, CT 06516
|
- sq. feet
|
- baths - beds |
show details | |

|
#47
2nd Ave # 2
West Haven, CT 06516
|
- sq. feet
|
- baths - beds |
show details | |

|
#48
Main St Apt 202
West Haven, CT 06516
|
- sq. feet
|
- baths - beds |
show details | |

|
#49
Bull Hill Ln Apt 310
West Haven, CT 06516
|
- sq. feet
|
- baths - beds |
show details | |

|
Check over 1 million property listings on Foreclosure.com!
|
browse all offers | |||


Median year apartment built: 1963
Household type by relationship:
Households: 55,564- Male householders: 10,027 (2,847 living alone), Female householders: 10,461 (3,115 living alone)
8,275 spouses (8,079 opposite-sex spouses), 1,221 unmarried partners, (1,160 opposite-sex unmarried partners), 15,919 children (14,999 natural, 286 adopted, 633 stepchildren), 841 grandchildren, 748 brothers or sisters, 1,166 parents, 0 foster children, 1,003 other relatives, 2,076 non-relatives
- In group quarters: 3,822
Size of family households: 4,994 2-persons, 3,222 3-persons, 2,589 4-persons, 1,271 5-persons, 426 6-persons, 321 7-or-more-persons.
Size of nonfamily households: 6,296 1-person, 1,298 2-persons, 185 3-persons, 21 4-persons, 71 5-persons, 79 6-persons, 28 7-or-more-persons.
5,860 married couples with children.
3,876 single-parent households (712 men, 3,164 women).
70.0% of residents of West Haven speak English at home.
18.2% of residents speak Spanish at home (61% speak English very well, 23% speak English well, 12% speak English not well, 4% don't speak English at all).
4.2% of residents speak other Indo-European language at home (61% speak English very well, 19% speak English well, 12% speak English not well, 8% don't speak English at all).
2.8% of residents speak Asian or Pacific Island language at home (40% speak English very well, 30% speak English well, 9% speak English not well, 22% don't speak English at all).
4.9% of residents speak other language at home (63% speak English very well, 15% speak English well, 20% speak English not well, 3% don't speak English at all).
Foreign born population: 11,064 (19.9%)
(49.9% of them are naturalized citizens)
| Here: | 6.0 |
| State: | 6.5 |
| Here: | 3.7 |
| State: | 4.0 |

- Bedrooms in owner-occupied houses and condos in West Haven, Connecticut
- 58no bedroom
- 4851 bedroom
- 2,8952 bedrooms
- 5,3523 bedrooms
- 1,7504 bedrooms
- 2645+ bedrooms

- Bedrooms in renter-occupied apartments in West Haven, Connecticut
- 489no bedroom
- 3,5321 bedroom
- 4,5232 bedrooms
- 1,0173 bedrooms
- 3464 bedrooms
- 395+ bedrooms

- Cars and other vehicles available in West Haven in owner-occupied houses/condos
- 241no vehicle
- 3,5191 vehicle
- 4,3012 vehicles
- 1,7783 vehicles
- 7604 vehicles
- 2055+ vehicles

- Cars and other vehicles available in West Haven in renter-occupied apartments
- 1,945no vehicle
- 4,6961 vehicle
- 2,7922 vehicles
- 3383 vehicles
- 1154 vehicles
- 595+ vehicles

- Rooms in owner-occupied houses in West Haven, Connecticut
- 581 room
- 392 rooms
- 4193 rooms
- 8274 rooms
- 2,6135 rooms
- 2,9696 rooms
- 1,9487 rooms
- 9828 rooms
- 9499+ rooms

- Rooms in renter-occupied apartments in West Haven, Connecticut
- 4441 room
- 7742 rooms
- 2,8333 rooms
- 3,1314 rooms
- 1,8255 rooms
- 6126 rooms
- 1867 rooms
- 568 rooms
- 839+ rooms


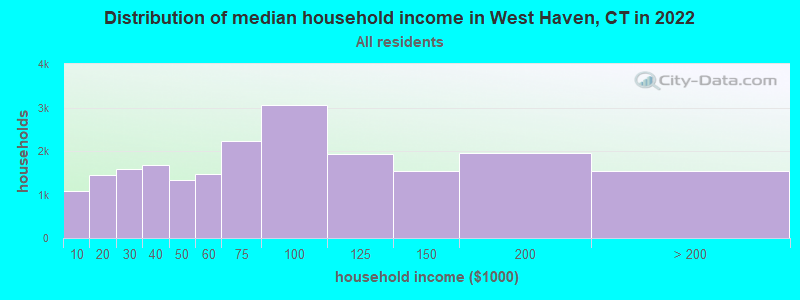
West Haven, CT household income distribution

- 1,079Less than $10,000
- 1,441$10,000 to $19,999
- 1,578$20,000 to $29,999
- 1,683$30,000 to $39,999
- 1,343$40,000 to $49,999
- 1,479$50,000 to $59,999
- 2,219$60,000 to $74,999
- 3,057$75,000 to $99,999
- 1,936$100,000 to $124,999
- 1,542$125,000 to $149,999
- 1,960$150,000 to $199,999
- 1,540$200,000 or more
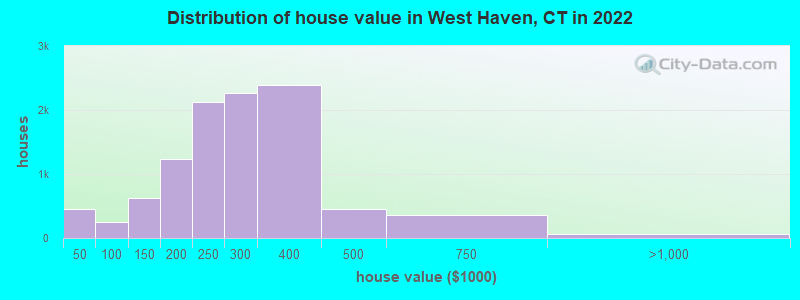
Home value of owner - occupied houses in 2022 in West Haven, CT
-
- 297Less than $10,000
- 25$10,000 to $14,999
- 15$15,000 to $19,999
- 54$20,000 to $24,999
- 30$25,000 to $29,999
- 17$35,000 to $39,999
- 11$40,000 to $49,999
- 11$50,000 to $59,999
- 22$60,000 to $69,999
- 49$70,000 to $79,999
- 55$80,000 to $89,999
- 93$90,000 to $99,999
- 345$100,000 to $124,999
- 275$125,000 to $149,999
- 701$150,000 to $174,999
- 537$175,000 to $199,999
- 2,122$200,000 to $249,999
- 2,266$250,000 to $299,999
- 2,398$300,000 to $399,999
- 459$400,000 to $499,999
- 360$500,000 to $749,999
- 49$750,000 to $999,999
- 14$2,000,000 or more
Rent paid by renters in 2022 in West Haven, CT
-
- 8Less than $100
- 43$100 to $149
- 75$150 to $199
- 201$200 to $249
- 138$250 to $299
- 132$300 to $349
- 212$350 to $399
- 54$400 to $449
- 101$450 to $499
- 19$500 to $549
- 163$550 to $599
- 17$600 to $649
- 31$650 to $699
- 177$700 to $749
- 224$750 to $799
- 534$800 to $899
- 855$900 to $999
- 3,234$1,000 to $1,249
- 1,984$1,250 to $1,499
- 631$1,500 to $1,999
- 182$2,000 to $2,499
- 112$2,500 to $2,999
- 23$3,000 to $3,499
- 18$3,500 or more
- 534No cash rent

Percentage of workers working in this county: 79.3%
Number of people working at home: 2,220 (8.3% of all workers)
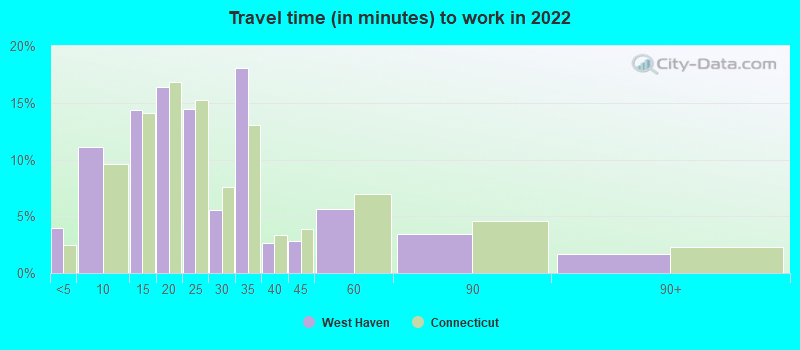
Travel time to work (commute)
- Less than 5 minutes: 819
- 5 to 9 minutes: 2,131
- 10 to 14 minutes: 3,786
- 15 to 19 minutes: 4,576
- 20 to 24 minutes: 3,750
- 25 to 29 minutes: 1,831
- 30 to 34 minutes: 3,506
- 35 to 39 minutes: 517
- 40 to 44 minutes: 434
- 45 to 59 minutes: 1,163
- 60 to 89 minutes: 1,085
- 90 or more minutes: 474
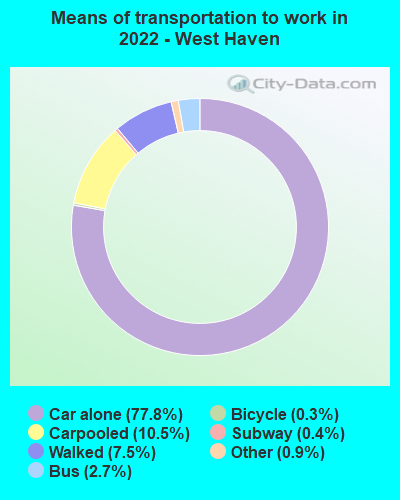
Means of transportation to work:
- Drove a car alone: 12,354 (66.9%)
- Carpooled: 1,769 (9.6%)
- Bus: 430 (2.3%)
- Long-distance train or commuter rail: 43 (0.2%)
- Taxi: 174 (0.9%)
- Bicycle: 37 (0.2%)
- Walked: 1,269 (6.9%)
- Worked at home: 2,220 (12.0%)
- Unemployment by race in 2022
- Unemployment rate for White non-Hispanic residents
- 4.0%Males
- 6.2%Females
- Unemployment rate for Black residents
- 8.9%Males
- 3.5%Females
- Unemployment rate for American Indian and Alaska Native residents
- 100.0%Females
- Unemployment rate for Asian residents
- 1.6%Males
- 1.4%Females
- Unemployment rate for other race residents
- 5.9%Males
- 7.2%Females
- Unemployment rate for two or more race residents
- 14.9%Males
- 4.8%Females
- Unemployment rate for Hispanic or Latino residents
- 9.7%Males
- 7.7%Females

- Year of entry for the foreign-born population in West Haven, Connecticut
- 3,9722010 or later
- 2,8112000 to 2009
- 2,3141990 to 1999
- 1,4111980 to 1989
- 6901970 to 1979
- 1,093Before 1970

First ancestries reported:
- Italian: 4,490 (15.8%)
- Irish: 1,433 (5.1%)
- American: 947 (3.3%)
- Jamaican: 909 (3.2%)
- Ghanaian: 801 (2.8%)
- English: 541 (1.9%)
- Polish: 468 (1.7%)
- German: 445 (1.6%)
- Portuguese: 397 (1.4%)
- African: 338 (1.2%)
- Ethiopian: 320 (1.1%)
- Moroccan: 292 (1.0%)
- Brazilian: 273 (1.0%)
- Cape Verdean: 223 (0.8%)
- Senegalese: 199 (0.7%)
- Afghan: 180 (0.6%)
- Romanian: 153 (0.5%)
- Palestinian: 143 (0.5%)
- Egyptian: 142 (0.5%)
- Canadian: 124 (0.4%)
- French: 114 (0.4%)
- Nigerian: 103 (0.4%)
- Sudanese: 102 (0.4%)
- European: 83 (0.3%)
- Ukrainian: 74 (0.3%)
- Guyanese: 73 (0.3%)
- Greek: 69 (0.2%)
- Eastern European: 68 (0.2%)
- Hungarian: 67 (0.2%)
- Northern European: 61 (0.2%)
- Russian: 60 (0.2%)
- French Canadian: 58 (0.2%)
- British: 48 (0.2%)
- Slovak: 38 (0.1%)
- Croatian: 37 (0.1%)
- British West Indian: 37 (0.1%)
- Turkish: 34 (0.1%)
- Dutch: 34 (0.1%)
- Arab: 30 (0.1%)
- Lebanese: 26 (0.09%)
- Austrian: 25 (0.09%)
- Finnish: 25 (0.09%)
- Lithuanian: 25 (0.09%)
- Welsh: 24 (0.08%)
- Serbian: 21 (0.07%)
- Haitian: 21 (0.07%)
- Norwegian: 19 (0.07%)
- Czechoslovakian: 18 (0.06%)
- Carpatho Rusyn: 18 (0.06%)
- Yugoslavian: 18 (0.06%)
- Swedish: 16 (0.06%)
- Scotch-Irish: 12 (0.04%)
- Scottish: 11 (0.04%)
- Australian: 10 (0.04%)
- Armenian: 8 (0.03%)
- Czech: 8 (0.03%)
- Syrian: 6 (0.02%)
- Trinidadian and Tobagonian: 6 (0.02%)
- Iranian: 5 (0.02%)
- Belgian: 5 (0.02%)
- Liberian: 4 (0.01%)
- South African: 3 (0.01%)
- Kenyan: 2 (0.01%)
Most common places of birth for foreign-born residents (%):
| West Haven: | 10.0% (1,103) |
| Connecticut: | 4.8% (25,802) |
| West Haven: | 9.8% (1,088) |
| Connecticut: | 7.5% (40,568) |
| West Haven: | 8.1% (896) |
| Connecticut: | 4.4% (24,026) |
| West Haven: | 6.4% (707) |
| Connecticut: | 1.0% (5,651) |
| West Haven: | 5.2% (573) |
| Connecticut: | 4.4% (24,001) |
| West Haven: | 4.8% (530) |
| Connecticut: | 3.3% (18,124) |
| West Haven: | 4.1% (457) |
| Connecticut: | 3.2% (17,617) |
| West Haven: | 4.0% (443) |
| Connecticut: | 0.4% (1,914) |
| West Haven: | 3.9% (437) |
| Connecticut: | 1.3% (7,003) |
| West Haven: | 3.9% (437) |
| Connecticut: | 7.3% (39,879) |
| West Haven: | 3.5% (382) |
| Connecticut: | 1.9% (10,545) |
| West Haven: | 3.1% (344) |
| Connecticut: | 5.0% (27,361) |
| West Haven: | 2.9% (322) |
| Connecticut: | 1.7% (9,214) |
| West Haven: | 2.7% (296) |
| Connecticut: | 4.7% (25,461) |
| West Haven: | 2.6% (284) |
| Connecticut: | 0.7% (3,904) |
| West Haven: | 2.5% (276) |
| Connecticut: | 2.5% (13,591) |
| West Haven: | 2.5% (274) |
| Connecticut: | 0.4% (1,946) |
| West Haven: | 2.2% (241) |
| Connecticut: | 2.8% (15,141) |
| West Haven: | 2.1% (235) |
| Connecticut: | 0.1% (769) |
| West Haven: | 1.7% (184) |
| Connecticut: | 0.3% (1,703) |
| West Haven: | 1.6% (172) |
| Connecticut: | 1.1% (6,024) |
Place of birth for U.S.-born residents:
- This state: 30,990
- Other state: 11,422
- Northeast: 8,532
- Midwest: 502
- South: 1,583
- West: 822
85.1% of West Haven residents lived in the same house 1 years ago.
Out of people who lived in different houses, 30.9% lived in this county.
Out of people who lived in different counties, 32.2% lived in Connecticut.
| West Haven: | 85.1% |
| State average: | 88.4% |
Education attainment for males 25 years and older:
- No schooling: 474
- Nursery to 4th grade: 252
- 5th and 6th grade: 339
- 7th and 8th grade: 159
- 9th grade: 380
- 10th grade: 333
- 11th grade: 150
- 12th grade, no diploma: 383
- High school graduate (or equivalency): 6,740
- Less than 1 year of college: 1,604
- Some college more than 1 year, no degree: 1,986
- Associate degree: 838
- Bachelor's degree: 2,407
- Master's degree: 1,309
- Professional school degree: 268
- Doctorate degree: 311

Education attainment for females 25 years and older:
- No schooling: 340
- Nursery to 4th grade: 224
- 5th and 6th grade: 155
- 7th and 8th grade: 200
- 9th grade: 96
- 10th grade: 366
- 11th grade: 176
- 12th grade, no diploma: 250
- High school graduate (or equivalency): 5,792
- Less than 1 year of college: 1,069
- Some college more than 1 year, no degree: 2,044
- Associate degree: 1,799
- Bachelor's degree: 3,277
- Master's degree: 1,675
- Professional school degree: 435
- Doctorate degree: 111


Housing units in structures:
- One, detached: 10,133
- One, attached: 613
- Two: 2,763
- 3 or 4: 2,197
- 5 to 9: 938
- 10 to 19: 1,334
- 20 to 49: 1,950
- 50 or more: 2,001
- Mobile homes: 86
Housing units lacking complete kitchen facilities in 2022: 1.0%
House/condo owner moved in on average 15 years ago
Renter moved in on average 2 years ago

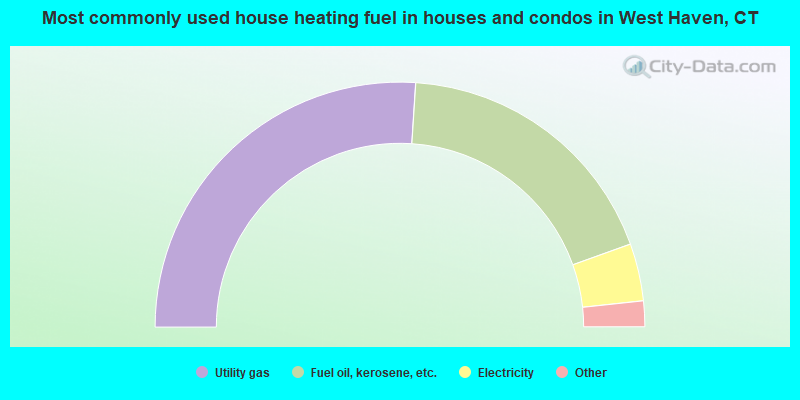
- 52.1%Utility gas
- 37.0%Fuel oil, kerosene, etc.
- 7.6%Electricity
- 2.1%Bottled, tank, or LP gas
- 0.6%Other fuel
- 0.3%Solar energy
- 0.2%Wood
- 0.1%No fuel used
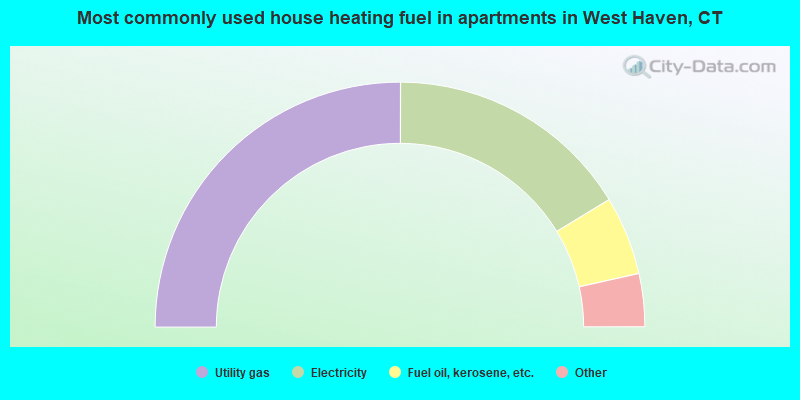
- 50.1%Utility gas
- 32.5%Electricity
- 10.4%Fuel oil, kerosene, etc.
- 3.4%Bottled, tank, or LP gas
- 2.6%No fuel used
- 0.7%Other fuel
- 0.2%Solar energy
Private vs. public school enrollment:
| Here: | 6.4% |
| Connecticut: | 9.5% |
| Here: | 13.1% |
| Connecticut: | 12.9% |
| Here: | 68.2% |
| Connecticut: | 35.5% |


