West Hartford, CT (Connecticut) Houses and Residents
| West Hartford: | $397,398 |
| Connecticut: | $347,200 |
Mean price in 2022:
Detached houses: $433,362
Here: $433,362 State: $503,946 Townhouses or other attached units: $281,313
Here: $281,313 State: $304,959 In 2-unit structures: $375,241
Here: $375,241 State: $304,133 In 3-to-4-unit structures: $119,108
Here: $119,108 State: $272,970 In 5-or-more-unit structures: $286,081
Here: $286,081 State: $249,308
Total population: 63,268 (All urban)
Houses: 27,659 (26,252 occupied: 18,207 owner occupied, 8,333 renter occupied)
| % of renters here: | 31% |
| State: | 34% |
Housing density: 1,258 houses/condos per square mile
Median price asked for vacant for-sale houses and condos in 2022: $400,469.
Median contract rent in 2022: $1,385 (lower quartile is $1,074, upper quartile is $1,839)
Median rent asked for vacant for-rent units in 2022: $1,660
Median gross rent in West Hartford, CT in 2022: $1,591
Housing units in West Hartford with a mortgage: 11,138 (1,231 second mortgage, 47 home equity loan, 1,112 both second mortgage and home equity loan)
Houses without a mortgage: 431
Median household income for houses/condos with a mortgage: $172,738
Median household income for apartments without a mortgage: $120,615
Median monthly housing costs: $1,776
Compare current foreclosures near West Hartford, CT:
| Photo | Address | Area | Beds / Baths | Price | Details |
|---|---|---|---|---|---|

|
#1
W Point Ter
West Hartford, CT 06107
|
1,082 sq. feet
|
1 baths 3 beds |
show details | |

|
#2
Prescott St
West Hartford, CT 06110
|
2,575 sq. feet
|
3 baths 5 beds |
show details | |

|
#3
Yale St
West Hartford, CT 06110
|
1,182 sq. feet
|
1 baths 3 beds |
show details | |

|
#4
Ridgewood Rd
West Hartford, CT 06107
|
1,590 sq. feet
|
1 baths 3 beds |
show details | |

|
#5
Hillsboro Dr
West Hartford, CT 06107
|
3,362 sq. feet
|
3 baths 3 beds |
show details | |

|
#6
Foley St
West Hartford, CT 06110
|
738 sq. feet
|
1 baths 2 beds |
show details | |

|
#7
Price Blvd
West Hartford, CT 06119
|
1,373 sq. feet
|
2 baths 3 beds |
show details | |

|
#8
Hamlin Dr
West Hartford, CT 06117
|
1,696 sq. feet
|
2 baths 3 beds |
show details | |

|
#9
E Normandy Dr
West Hartford, CT 06107
|
1,597 sq. feet
|
2 baths 4 beds |
show details | |

|
#10
Fawn Brk
West Hartford, CT 06117
|
3,513 sq. feet
|
3 baths 4 beds |
show details |
| Photo | Address | Area | Beds / Baths | Price | Details |
|---|---|---|---|---|---|

|
#11
E Maxwell Dr
West Hartford, CT 06107
|
1,222 sq. feet
|
1 baths 3 beds |
show details | |

|
#12
Edgemont Ave
West Hartford, CT 06110
|
1,630 sq. feet
|
1 baths 3 beds |
show details | |

|
#13
Hillcrest Ave Apt D
West Hartford, CT 06110
|
- sq. feet
|
- baths - beds |
show details | |

|
#14
W Ridge Dr
West Hartford, CT 06117
|
- sq. feet
|
- baths - beds |
show details | |

|
#15
Geneva Ave
West Hartford, CT 06107
|
- sq. feet
|
- baths - beds |
show details | |

|
#16
S Main St Apt 117
West Hartford, CT 06107
|
- sq. feet
|
- baths - beds |
show details | |

|
#17
Mozart St
West Hartford, CT 06110
|
- sq. feet
|
- baths - beds |
show details | |

|
#18
Oakwood Ave Apt T1
West Hartford, CT 06119
|
- sq. feet
|
- baths - beds |
show details | |

|
#19
Souh Main Street
West Hartford, CT 06110
|
- sq. feet
|
- baths - beds |
show details | |

|
#20
Peck St
Berlin, CT 06037
|
608 sq. feet
|
1 baths 1 beds |
$144,900
|
show details |
| Photo | Address | Area | Beds / Baths | Price | Details |
|---|---|---|---|---|---|

|
#21
Roosevelt St
New Britain, CT 06051
|
1,536 sq. feet
|
2 baths 3 beds |
$299,900
|
show details |

|
#22
Shares Ln
South Windsor, CT 06074
|
1,850 sq. feet
|
2 baths 4 beds |
$365,000
|
show details |

|
#23
Newberry Rd
South Windsor, CT 06074
|
3,386 sq. feet
|
2 baths 4 beds |
$649,900
|
show details |

|
#24
Dowd Ave
Canton, CT 06019
|
1,190 sq. feet
|
1 baths 2 beds |
$239,900
|
show details |

|
#25
Reservoir Rd
Vernon Rockville, CT 06066
|
1,288 sq. feet
|
2 baths 3 beds |
$379,900
|
show details |

|
#26
Willis Ave
Meriden, CT 06450
|
1,008 sq. feet
|
1 baths 2 beds |
$299,900
|
show details |

|
#27
Allen St
Bristol, CT 06010
|
1,092 sq. feet
|
1 baths 3 beds |
$215,000
|
show details |

|
#28
Mountain Rd
Windsor, CT 06095
|
1,144 sq. feet
|
2 baths 3 beds |
$230,000
|
show details |

|
#29
Winthrop Blvd
Cromwell, CT 06416
|
1,092 sq. feet
|
1 baths 3 beds |
$220,000
|
show details |

|
#30
Irving St
Manchester, CT 06042
|
1,335 sq. feet
|
2 baths 3 beds |
$251,750
|
show details |
| Photo | Address | Area | Beds / Baths | Price | Details |
|---|---|---|---|---|---|

|
#31
Edgemont Ave
West Hartford, CT 06110
|
- sq. feet
|
- baths - beds |
show details | |

|
#32
Robbins Ave
Newington, CT 06111
|
1,346 sq. feet
|
2 baths 3 beds |
show details | |

|
#33
Vanderbilt Rd
Bristol, CT 06010
|
1,803 sq. feet
|
1 baths 5 beds |
show details | |

|
#34
High St
South Windsor, CT 06074
|
1,338 sq. feet
|
2 baths 3 beds |
show details | |

|
#35
Jones Hollow Rd
Marlborough, CT 06447
|
1,984 sq. feet
|
2 baths 3 beds |
show details | |

|
#36
Cedarwood Ln
Newington, CT 06111
|
2,111 sq. feet
|
1 baths 2 beds |
show details | |

|
#37
Surrey Dr
Bristol, CT 06010
|
1,079 sq. feet
|
1 baths 3 beds |
show details | |

|
#38
Main St
Newington, CT 06111
|
1,880 sq. feet
|
1 baths 3 beds |
show details | |

|
#39
Pratt St
Meriden, CT 06450
|
1,040 sq. feet
|
2 baths 3 beds |
show details | |

|
#40
Pond St
New Britain, CT 06051
|
2,400 sq. feet
|
2 baths 6 beds |
show details |
| Photo | Address | Area | Beds / Baths | Price | Details |
|---|---|---|---|---|---|

|
#41
W Main St
New Britain, CT 06053
|
1,584 sq. feet
|
2 baths 4 beds |
show details | |

|
#42
Richard St Apt 2
Newington, CT 06111
|
710 sq. feet
|
1 baths 1 beds |
show details | |

|
#43
Sylvan Ave
Terryville, CT 06786
|
1,691 sq. feet
|
1 baths 4 beds |
show details | |

|
#44
Parents Way
Bloomfield, CT 06002
|
1,230 sq. feet
|
3 baths 4 beds |
show details | |

|
#45
Hollister Dr
East Hartford, CT 06118
|
1,300 sq. feet
|
1 baths 3 beds |
show details | |

|
#46
Park Ave
Windsor, CT 06095
|
969 sq. feet
|
2 baths 3 beds |
show details | |

|
#47
Glendale Cir
Windsor Locks, CT 06096
|
1,277 sq. feet
|
1 baths 2 beds |
show details | |

|
#48
Melinda Ln
Bristol, CT 06010
|
- sq. feet
|
2 baths 4 beds |
show details | |

|
#49
Saville St
Windsor, CT 06095
|
1,181 sq. feet
|
2 baths 3 beds |
show details | |

|
Check over 1 million property listings on Foreclosure.com!
|
browse all offers | |||


Median year apartment built: 1961
Household type by relationship:
Households: 64,352- Male householders: 11,840 (2,707 living alone), Female householders: 14,366 (5,048 living alone)
12,581 spouses (12,502 opposite-sex spouses), 1,801 unmarried partners, (1,733 opposite-sex unmarried partners), 18,378 children (17,565 natural, 399 adopted, 413 stepchildren), 363 grandchildren, 375 brothers or sisters, 657 parents, 0 foster children, 571 other relatives, 1,819 non-relatives
- In group quarters: 1,595
Size of family households: 6,526 2-persons, 4,137 3-persons, 3,847 4-persons, 1,010 5-persons, 257 6-persons, 111 7-or-more-persons.
Size of nonfamily households: 8,188 1-person, 2,227 2-persons, 188 3-persons, 50 4-persons, 24 5-persons, 28 7-or-more-persons.
9,734 married couples with children.
3,711 single-parent households (819 men, 2,892 women).
74.9% of residents of West Hartford speak English at home.
10.8% of residents speak Spanish at home (68% speak English very well, 17% speak English well, 11% speak English not well, 4% don't speak English at all).
9.1% of residents speak other Indo-European language at home (69% speak English very well, 16% speak English well, 10% speak English not well, 5% don't speak English at all).
4.2% of residents speak Asian or Pacific Island language at home (64% speak English very well, 25% speak English well, 8% speak English not well, 3% don't speak English at all).
1.2% of residents speak other language at home (79% speak English very well, 11% speak English well, 8% speak English not well, 2% don't speak English at all).
Foreign born population: 11,676 (18.1%)
(64.8% of them are naturalized citizens)
| Here: | 6.9 |
| State: | 6.5 |
| Here: | 4.1 |
| State: | 4.0 |

- Bedrooms in owner-occupied houses and condos in West Hartford, Connecticut
- 22no bedroom
- 2641 bedroom
- 2,8052 bedrooms
- 8,8383 bedrooms
- 4,8194 bedrooms
- 1,4595+ bedrooms

- Bedrooms in renter-occupied apartments in West Hartford, Connecticut
- 443no bedroom
- 2,9671 bedroom
- 2,9912 bedrooms
- 1,5153 bedrooms
- 2824 bedrooms
- 1355+ bedrooms

- Cars and other vehicles available in West Hartford in owner-occupied houses/condos
- 543no vehicle
- 5,0401 vehicle
- 8,9402 vehicles
- 2,8953 vehicles
- 6714 vehicles
- 1195+ vehicles

- Cars and other vehicles available in West Hartford in renter-occupied apartments
- 1,704no vehicle
- 3,7491 vehicle
- 2,2852 vehicles
- 4293 vehicles
- 1484 vehicles
- 175+ vehicles

- Rooms in owner-occupied houses in West Hartford, Connecticut
- 221 room
- 672 rooms
- 3093 rooms
- 8194 rooms
- 2,2915 rooms
- 4,2986 rooms
- 3,4197 rooms
- 2,7598 rooms
- 4,2239+ rooms

- Rooms in renter-occupied apartments in West Hartford, Connecticut
- 4021 room
- 6512 rooms
- 1,9403 rooms
- 1,6594 rooms
- 1,6655 rooms
- 1,0486 rooms
- 4627 rooms
- 2438 rooms
- 2649+ rooms


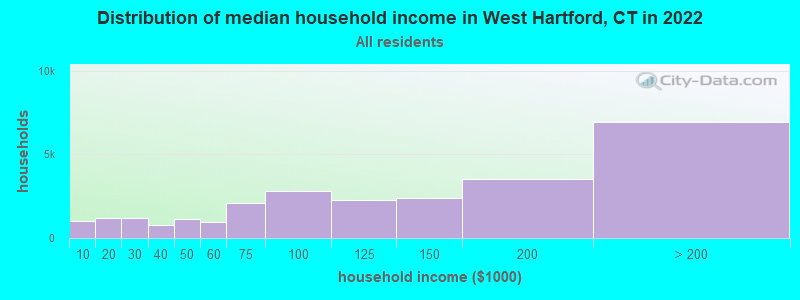
West Hartford, CT household income distribution

- 1,023Less than $10,000
- 1,191$10,000 to $19,999
- 1,202$20,000 to $29,999
- 800$30,000 to $39,999
- 1,140$40,000 to $49,999
- 951$50,000 to $59,999
- 2,112$60,000 to $74,999
- 2,803$75,000 to $99,999
- 2,273$100,000 to $124,999
- 2,403$125,000 to $149,999
- 3,527$150,000 to $199,999
- 6,930$200,000 or more
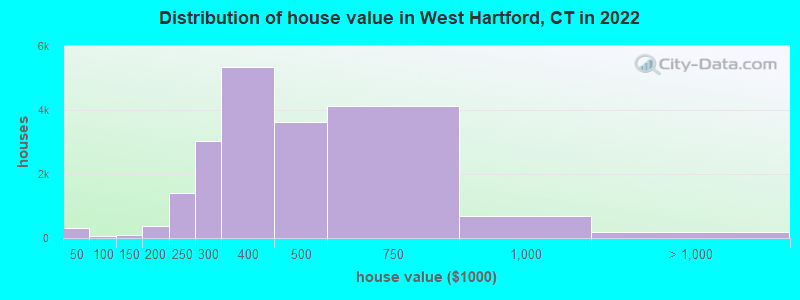
Home value of owner - occupied houses in 2022 in West Hartford, CT
-
- 128Less than $10,000
- 12$10,000 to $14,999
- 104$20,000 to $24,999
- 9$25,000 to $29,999
- 47$30,000 to $34,999
- 7$40,000 to $49,999
- 10$50,000 to $59,999
- 5$70,000 to $79,999
- 27$90,000 to $99,999
- 40$100,000 to $124,999
- 45$125,000 to $149,999
- 117$150,000 to $174,999
- 265$175,000 to $199,999
- 1,409$200,000 to $249,999
- 3,036$250,000 to $299,999
- 5,347$300,000 to $399,999
- 3,611$400,000 to $499,999
- 4,113$500,000 to $749,999
- 676$750,000 to $999,999
- 145$1,000,000 to $1,499,999
- 23$1,500,000 to $1,999,999
- 16$2,000,000 or more
Rent paid by renters in 2022 in West Hartford, CT
-
- 29Less than $100
- 19$100 to $149
- 60$150 to $199
- 329$200 to $249
- 75$250 to $299
- 20$300 to $349
- 24$400 to $449
- 27$450 to $499
- 73$500 to $549
- 25$550 to $599
- 192$600 to $649
- 135$650 to $699
- 119$700 to $749
- 48$750 to $799
- 127$800 to $899
- 183$900 to $999
- 1,585$1,000 to $1,249
- 1,698$1,250 to $1,499
- 1,948$1,500 to $1,999
- 633$2,000 to $2,499
- 244$2,500 to $2,999
- 175$3,000 to $3,499
- 277$3,500 or more
- 247No cash rent


Percentage of workers working in this county: 91.7%
Number of people working at home: 7,629 (22.2% of all workers)
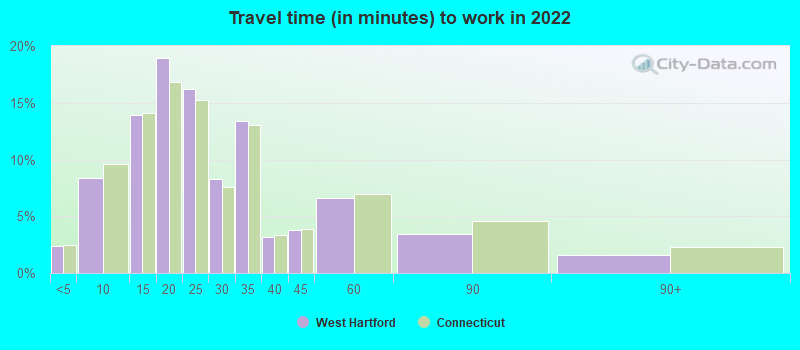
Travel time to work (commute)
- Less than 5 minutes: 528
- 5 to 9 minutes: 2,229
- 10 to 14 minutes: 5,532
- 15 to 19 minutes: 5,341
- 20 to 24 minutes: 4,934
- 25 to 29 minutes: 2,365
- 30 to 34 minutes: 2,871
- 35 to 39 minutes: 482
- 40 to 44 minutes: 496
- 45 to 59 minutes: 992
- 60 to 89 minutes: 693
- 90 or more minutes: 562
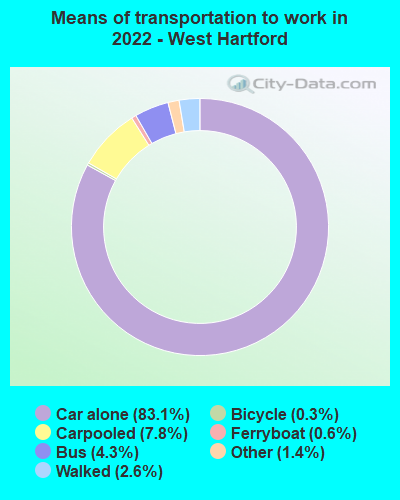
Means of transportation to work:
- Drove a car alone: 23,535 (65.7%)
- Carpooled: 2,351 (6.6%)
- Bus: 1,197 (3.3%)
- Subway or elevated rail: 16 (0.0%)
- Long-distance train or commuter rail: 6 (0.0%)
- Ferryboat: 177 (0.5%)
- Taxi: 472 (1.3%)
- Bicycle: 74 (0.2%)
- Walked: 781 (2.2%)
- Worked at home: 7,629 (21.3%)

- Unemployment by race in 2022
- Unemployment rate for White non-Hispanic residents
- 3.3%Males
- 3.0%Females
- Unemployment rate for Black residents
- 8.5%Males
- 0.8%Females
- Unemployment rate for Asian residents
- 0.3%Males
- 0.9%Females
- Unemployment rate for other race residents
- 3.6%Males
- 4.2%Females
- Unemployment rate for two or more race residents
- 0.7%Males
- 4.3%Females
- Unemployment rate for Hispanic or Latino residents
- 1.1%Males
- 2.9%Females

- Year of entry for the foreign-born population in West Hartford, Connecticut
- 2,7462010 or later
- 2,4352000 to 2009
- 2,3461990 to 1999
- 2,3181980 to 1989
- 1,1941970 to 1979
- 2,553Before 1970

First ancestries reported:
- Irish: 2,561 (8.6%)
- Italian: 1,901 (6.4%)
- American: 1,496 (5.0%)
- English: 1,353 (4.6%)
- German: 1,023 (3.4%)
- Polish: 989 (3.3%)
- European: 739 (2.5%)
- Russian: 587 (2.0%)
- Portuguese: 543 (1.8%)
- Haitian: 462 (1.6%)
- French Canadian: 379 (1.3%)
- Eastern European: 367 (1.2%)
- Ukrainian: 366 (1.2%)
- Albanian: 345 (1.2%)
- Jamaican: 274 (0.9%)
- Brazilian: 264 (0.9%)
- Greek: 243 (0.8%)
- Guyanese: 218 (0.7%)
- French: 215 (0.7%)
- Swedish: 183 (0.6%)
- Arab: 173 (0.6%)
- Scottish: 162 (0.5%)
- Armenian: 159 (0.5%)
- British: 157 (0.5%)
- Northern European: 157 (0.5%)
- Ethiopian: 148 (0.5%)
- Hungarian: 144 (0.5%)
- Nigerian: 132 (0.4%)
- Lithuanian: 122 (0.4%)
- Bulgarian: 114 (0.4%)
- Norwegian: 94 (0.3%)
- Afghan: 94 (0.3%)
- Israeli: 92 (0.3%)
- Serbian: 78 (0.3%)
- Romanian: 75 (0.3%)
- Canadian: 71 (0.2%)
- Iranian: 60 (0.2%)
- Dutch: 46 (0.2%)
- Somali: 45 (0.2%)
- Lebanese: 44 (0.1%)
- Austrian: 43 (0.1%)
- Danish: 39 (0.1%)
- Finnish: 37 (0.1%)
- Syrian: 36 (0.1%)
- Belizean: 36 (0.1%)
- Yugoslavian: 32 (0.1%)
- Ghanaian: 31 (0.1%)
- Barbadian: 31 (0.1%)
- Estonian: 30 (0.1%)
- Scotch-Irish: 28 (0.09%)
- Palestinian: 25 (0.08%)
- Slovak: 25 (0.08%)
- West Indian: 21 (0.07%)
- Swiss: 19 (0.06%)
- South African: 18 (0.06%)
- African: 17 (0.06%)
- Trinidadian and Tobagonian: 16 (0.05%)
- Belgian: 14 (0.05%)
- Welsh: 12 (0.04%)
- Senegalese: 11 (0.04%)
- Scandinavian: 10 (0.03%)
- Turkish: 9 (0.03%)
- Australian: 9 (0.03%)
- Croatian: 8 (0.03%)
- Moroccan: 6 (0.02%)
- Slovene: 5 (0.02%)
- Czechoslovakian: 2 (0.01%)
Most common places of birth for foreign-born residents (%):
| West Hartford: | 6.5% (755) |
| Connecticut: | 4.4% (24,001) |
| West Hartford: | 6.1% (716) |
| Connecticut: | 7.3% (39,879) |
| West Hartford: | 5.5% (643) |
| Connecticut: | 0.2% (939) |
| West Hartford: | 5.0% (586) |
| Connecticut: | 4.7% (25,461) |
| West Hartford: | 4.2% (489) |
| Connecticut: | 7.5% (40,568) |
| West Hartford: | 3.2% (373) |
| Connecticut: | 4.8% (25,802) |
| West Hartford: | 3.1% (364) |
| Connecticut: | 1.2% (6,448) |
| West Hartford: | 3.1% (358) |
| Connecticut: | 2.5% (13,591) |
| West Hartford: | 3.1% (357) |
| Connecticut: | 1.2% (6,448) |
| West Hartford: | 2.9% (341) |
| Connecticut: | 5.0% (27,361) |
| West Hartford: | 2.7% (310) |
| Connecticut: | 0.4% (2,278) |
| West Hartford: | 2.5% (296) |
| Connecticut: | 0.9% (5,088) |
| West Hartford: | 2.5% (294) |
| Connecticut: | 1.7% (9,214) |
| West Hartford: | 2.4% (286) |
| Connecticut: | 3.3% (18,124) |
| West Hartford: | 2.4% (283) |
| Connecticut: | 1.3% (7,149) |
| West Hartford: | 2.2% (256) |
| Connecticut: | 1.0% (5,447) |
| West Hartford: | 2.1% (248) |
| Connecticut: | 2.3% (12,380) |
| West Hartford: | 2.1% (244) |
| Connecticut: | 4.0% (21,729) |
| West Hartford: | 1.7% (199) |
| Connecticut: | 4.4% (24,026) |
| West Hartford: | 1.6% (186) |
| Connecticut: | 1.2% (6,551) |
| West Hartford: | 1.5% (177) |
| Connecticut: | 0.4% (2,170) |
Place of birth for U.S.-born residents:
- This state: 31,143
- Other state: 19,667
- Northeast: 11,669
- Midwest: 2,189
- South: 3,435
- West: 2,345
87.8% of West Hartford residents lived in the same house 1 years ago.
Out of people who lived in different houses, 30.9% lived in this county.
Out of people who lived in different counties, 19.8% lived in Connecticut.
| West Hartford: | 87.8% |
| State average: | 88.4% |
Education attainment for males 25 years and older:
- No schooling: 344
- Nursery to 4th grade: 27
- 5th and 6th grade: 84
- 7th and 8th grade: 69
- 9th grade: 17
- 10th grade: 114
- 11th grade: 35
- 12th grade, no diploma: 340
- High school graduate (or equivalency): 2,734
- Less than 1 year of college: 921
- Some college more than 1 year, no degree: 1,257
- Associate degree: 1,192
- Bachelor's degree: 7,352
- Master's degree: 3,475
- Professional school degree: 2,450
- Doctorate degree: 1,073

Education attainment for females 25 years and older:
- No schooling: 604
- Nursery to 4th grade: 37
- 5th and 6th grade: 83
- 7th and 8th grade: 122
- 9th grade: 153
- 10th grade: 218
- 11th grade: 12
- 12th grade, no diploma: 335
- High school graduate (or equivalency): 2,769
- Less than 1 year of college: 1,016
- Some college more than 1 year, no degree: 1,478
- Associate degree: 1,482
- Bachelor's degree: 7,726
- Master's degree: 5,887
- Professional school degree: 1,685
- Doctorate degree: 1,135


Housing units in structures:
- One, detached: 17,887
- One, attached: 1,066
- Two: 1,489
- 3 or 4: 1,886
- 5 to 9: 714
- 10 to 19: 1,124
- 20 to 49: 1,642
- 50 or more: 1,820
- Mobile homes: 28
Housing units lacking complete kitchen facilities in 2022: 1.0%
House/condo owner moved in on average 14 years ago
Renter moved in on average 1 years ago

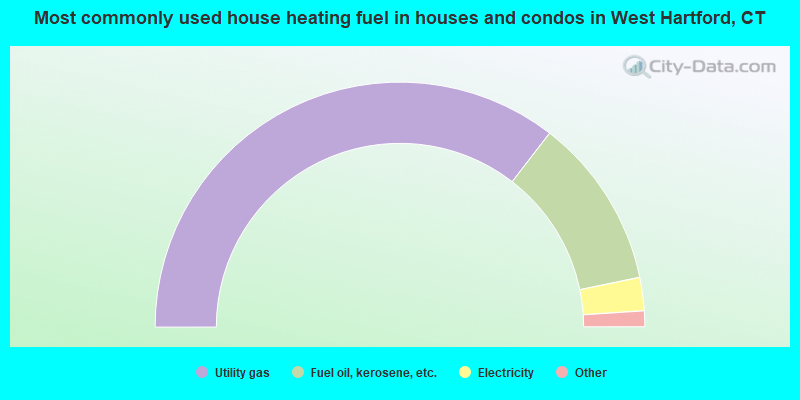
- 71.0%Utility gas
- 22.6%Fuel oil, kerosene, etc.
- 4.4%Electricity
- 1.2%Bottled, tank, or LP gas
- 0.5%Wood
- 0.2%No fuel used
- 0.1%Solar energy
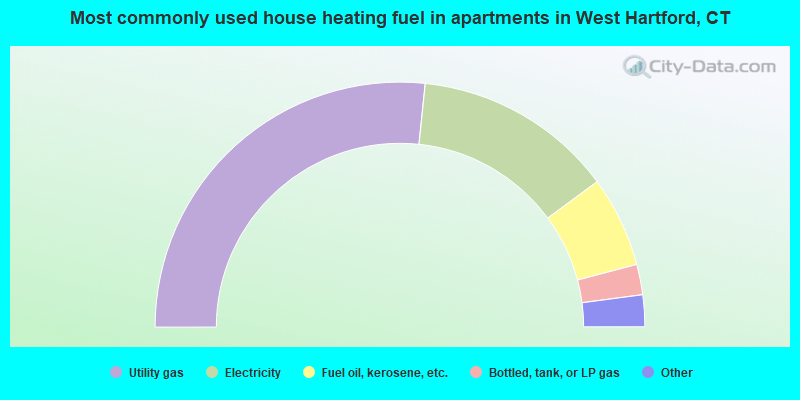
- 53.3%Utility gas
- 26.5%Electricity
- 12.0%Fuel oil, kerosene, etc.
- 4.0%Bottled, tank, or LP gas
- 3.4%Other fuel
- 0.8%No fuel used
Private vs. public school enrollment:
| Here: | 9.7% |
| Connecticut: | 9.5% |
| Here: | 13.2% |
| Connecticut: | 12.9% |
| Here: | 30.6% |
| Connecticut: | 35.5% |


