Jump to a detailed profile or search site with Google Custom Search

West Gate, VA (Virginia) Houses and Residents

Estimated median house or condo value in 2022: $417,554 (it was $120,500 in 2000)
West Gate:

$417,554
Virginia:

$365,700
Lower value quartile - upper value quartile: $268,266 - $494,276

Total population: 9,504 (Urban population: 7,286, Rural population: 0)

Houses: 2,539 (2,470 occupied: 1,220 owner occupied, 1,250 renter occupied)

% of renters here:

51%
State:

33%

Housing density: 2,165 houses/condos per square mile

Median price asked for vacant for-sale houses and condos in 2022 in this county: $448,286.

Median contract rent in 2022: $1,606 (lower quartile is $1,382, upper quartile is over $2,000)


Median rent asked for vacant for-rent units in 2022: $1,664


Median gross rent in West Gate, VA in 2022: $1,770

Housing units in West Gate with a mortgage: 1,026 (138 second mortgage, 77 home equity loan, 0 both second mortgage and home equity loan)
Houses without a mortgage: 132

Compare current foreclosures near West Gate, VA:

Check out more offers near West Gate, VA.
Powered by Foreclosure.com


West Gate, Virginia Age and Sex of Residents

Household type by relationship:

Households: 399,482
  • In family households: 359,197 (72,572 male householders, 28,026 female householders)
    78,037 spouses, 134,746 children (126,129 natural, 2,614 adopted, 6,003 stepchildren), 7,606 grandchildren, 5,919 brothers or sisters, 5,345 parents, foster children, 9,643 other relatives, 13,401 non-relatives
  • In nonfamily households: 40,285 (14,683 male householders (10,546 living alone)), 15,504 female householders (12,598 living alone)), 10,098 nonrelatives
  • In group quarters: 2,520 (1,511 institutionalized population)

62,340 married couples with children.
15,682 single-parent households (3,642 men, 12,040 women).

73.0% of residents of West Gate speak English at home.
20.4% of residents speak Spanish at home (33% speak English very well, 22% speak English well, 29% speak English not well, 17% don't speak English at all).
4.2% of residents speak other Indo-European language at home (57% speak English very well, 27% speak English well, 13% speak English not well, 3% don't speak English at all).
1.4% of residents speak Asian or Pacific Island language at home (45% speak English very well, 13% speak English well, 36% speak English not well, 6% don't speak English at all).
1.0% of residents speak other language at home (71% speak English very well, 29% don't speak English at all).

Foreign born population: 6,099 (48.3%)
(36.1% of them are naturalized citizens)

Median number of rooms in houses and condos:
Here:

6.7
State:

7.0

Median number of rooms in apartments
Here:

3.4
State:

4.3

Owner-occupied Renter-occupied
Bedrooms in owner-occupied houses and condos in West Gate, Virginia
  • Bedrooms in owner-occupied houses and condos in West Gate, Virginia
  • 7no bedroom
  • 91 bedroom
  • 642 bedrooms
  • 7283 bedrooms
  • 2854 bedrooms
  • 1275+ bedrooms
Bedrooms in renter-occupied apartments in West Gate, Virginia
  • Bedrooms in renter-occupied apartments in West Gate, Virginia
  • 158no bedroom
  • 3701 bedroom
  • 2832 bedrooms
  • 3893 bedrooms
  • 354 bedrooms
  • 155+ bedrooms
Owner-occupied Renter-occupied
Cars and other vehicles available in West Gate in owner-occupied houses/condos
  • Cars and other vehicles available in West Gate in owner-occupied houses/condos
  • 49no vehicle
  • 2421 vehicle
  • 5472 vehicles
  • 2823 vehicles
  • 684 vehicles
  • 325+ vehicles
Cars and other vehicles available in West Gate in renter-occupied apartments
  • Cars and other vehicles available in West Gate in renter-occupied apartments
  • 288no vehicle
  • 5141 vehicle
  • 2942 vehicles
  • 1143 vehicles
  • 254 vehicles
  • 155+ vehicles
Owner-occupied Renter-occupied
Rooms in owner-occupied houses in West Gate, Virginia
  • Rooms in owner-occupied houses in West Gate, Virginia
  • 01 room
  • 52 rooms
  • 443 rooms
  • 214 rooms
  • 2405 rooms
  • 3106 rooms
  • 2217 rooms
  • 1728 rooms
  • 2079+ rooms
Rooms in renter-occupied apartments in West Gate, Virginia
  • Rooms in renter-occupied apartments in West Gate, Virginia
  • 1381 room
  • 2042 rooms
  • 2203 rooms
  • 2024 rooms
  • 1285 rooms
  • 2606 rooms
  • 527 rooms
  • 138 rooms
  • 339+ rooms
Year house built
Breakdown of mean house values by ages of householders
Owners and renters by unit type in West Gate, VA
  • West Gate, VA household income distribution

  • Distribution of median household income in West Gate, VA in 2022
  • 2,917Less than $10,000
  • 2,492$10,000 to $19,999
  • 3,456$20,000 to $29,999
  • 3,202$30,000 to $39,999
  • 4,950$40,000 to $49,999
  • 6,459$50,000 to $59,999
  • 8,062$60,000 to $74,999
  • 14,512$75,000 to $99,999
  • 13,046$100,000 to $124,999
  • 10,739$125,000 to $149,999
  • 18,335$150,000 to $199,999
  • 26,457$200,000 or more

Percentage of workers working in this county: 58.8%
Number of people working at home: 1,297 (20.2% of all workers)

Travel time to work (commute)

  • Less than 5 minutes: 112
  • 5 to 9 minutes: 279
  • 10 to 14 minutes: 506
  • 15 to 19 minutes: 515
  • 20 to 24 minutes: 395
  • 25 to 29 minutes: 166
  • 30 to 34 minutes: 492
  • 35 to 39 minutes: 122
  • 40 to 44 minutes: 198
  • 45 to 59 minutes: 496
  • 60 to 89 minutes: 239
  • 90 or more minutes: 256

Means of transportation to work:

  • Drove a car alone: 2,602 (67.9%)
  • Carpooled: 897 (23.4%)
  • Bus or trolley bus: 40 (1.0%)
  • Subway or elevated: 17 (0.4%)
  • Railroad: 26 (0.7%)
  • Bicycle: 44 (1.1%)
  • Walked: 124 (3.2%)
  • Other means: 26 (0.7%)
  • Worked at home: 57 (1.5%)
Class of Workers in 2000
Year of entry for the foreign-born population in West Gate, Virginia
  • Year of entry for the foreign-born population in West Gate, Virginia
  • 6291995 to March 2000
  • 2901990 to 1994
  • 2941985 to 1989
  • 2011980 to 1984
  • 441975 to 1979
  • 581970 to 1974
  • 371965 to 1969
  • 63Before 1965
Ancestries in West Gate, VA <small>(Other ancestries excluded from the graph)</small>

First ancestries reported:

  • Other: 3,282 (46.2%)
  • German: 702 (9.9%)
  • United States: 689 (9.7%)
  • Irish: 566 (8.0%)
  • English: 460 (6.5%)
  • Polish: 223 (3.1%)
  • Scotch-Irish: 171 (2.4%)
  • Italian: 155 (2.2%)
  • Scottish: 141 (2.0%)
  • French: 114 (1.6%)
  • Subsaharan African: 114 (1.6%)
  • West Indian: 100 (1.4%)
  • Arab: 85 (1.2%)
  • Dutch: 79 (1.1%)
  • Welsh: 50 (0.7%)
  • French Canadian: 45 (0.6%)
  • Greek: 33 (0.5%)
  • Swedish: 33 (0.5%)
  • Swiss: 17 (0.2%)
  • Lithuanian: 16 (0.2%)
  • Russian: 15 (0.2%)
  • Norwegian: 14 (0.2%)
  • Czech: 7 (0.10%)

Most common places of birth for foreign-born residents (%):

El Salvador
West Gate:

32.4% (524)
Virginia:

9.6% (54,704)

Mexico
West Gate:

20.2% (327)
Virginia:

5.7% (32,598)

Honduras
West Gate:

4.5% (73)
Virginia:

1.7% (9,555)

India
West Gate:

4.5% (72)
Virginia:

5.4% (30,611)

Philippines
West Gate:

3.8% (62)
Virginia:

6.4% (36,325)

Germany
West Gate:

3.8% (61)
Virginia:

3.4% (19,477)

Jamaica
West Gate:

2.9% (47)
Virginia:

0.9% (5,248)

Guatemala
West Gate:

2.4% (38)
Virginia:

2.1% (11,799)

Dominican Republic
West Gate:

2.0% (33)
Virginia:

0.5% (2,622)

Bangladesh
West Gate:

2.0% (32)
Virginia:

0.6% (3,539)

Costa Rica
West Gate:

1.9% (31)
Virginia:

0.2% (1,248)

United Kingdom
West Gate:

1.8% (29)
Virginia:

3.5% (19,911)

Other Northern Africa
West Gate:

1.7% (27)
Virginia:

1.1% (6,238)

Place of birth for U.S.-born residents:

  • This state: 3,061
  • Other state: 2,494
  • Northeast: 694
  • Midwest: 380
  • South: 1,110
  • West: 310

47% of West Gate residents lived in the same house 5 years ago.
   Out of people who lived in different houses, 42% lived in this county.
   Out of people who lived in different counties, 54% lived in Virginia.

Education attainment for males 25 years and older:

  • No schooling: 37
  • Nursery to 4th grade: 39
  • 5th and 6th grade: 83
  • 7th and 8th grade: 86
  • 9th grade: 70
  • 10th grade: 52
  • 11th grade: 74
  • 12th grade, no diploma: 151
  • High school graduate (or equivalency): 711
  • Less than 1 year of college: 136
  • Some college more than 1 year, no degree: 386
  • Associate degree: 82
  • Bachelor's degree: 203
  • Master's degree: 76
  • Professional school degree: 26
  • Doctorate degree: 30
Educational Attainment for Males

Education attainment for females 25 years and older:

  • No schooling: 71
  • Nursery to 4th grade: 8
  • 5th and 6th grade: 100
  • 7th and 8th grade: 74
  • 9th grade: 54
  • 10th grade: 111
  • 11th grade: 89
  • 12th grade, no diploma: 86
  • High school graduate (or equivalency): 730
  • Less than 1 year of college: 291
  • Some college more than 1 year, no degree: 282
  • Associate degree: 96
  • Bachelor's degree: 254
  • Master's degree: 70
  • Professional school degree: 0
  • Doctorate degree: 0
Educational Attainment for Females
West Gate marital status for males
West Gate marital status for females

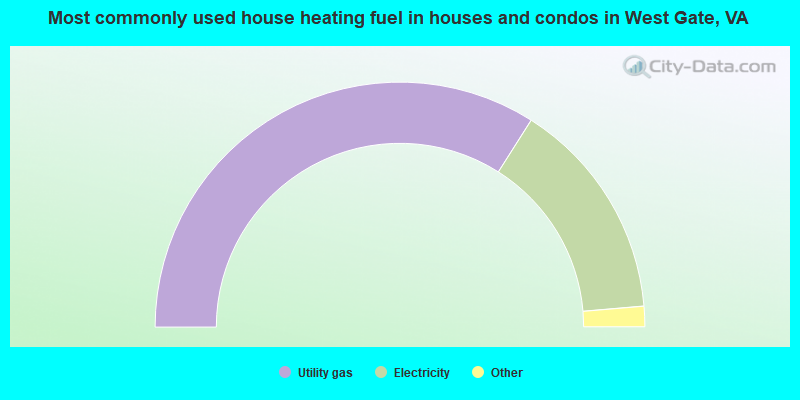
Housing units in structures:

  • One, detached: 843
  • One, attached: 886
  • Two: 31
  • 3 or 4: 21
  • 5 to 9: 110
  • 10 to 19: 397
  • 20 to 49: 31
  • 50 or more: 213
  • Mobile homes: 7
Housing units lacking complete plumbing facilities: 0.3%

Housing units lacking complete kitchen facilities: 9.3%
Year householders moved into residence in West Gate
Houses and condos Apartments
Most commonly used house heating fuel in houses and condos in West Gate, VA
  • 68.0%Utility gas
  • 29.3%Electricity
  • 1.1%Bottled, tank, or LP gas
  • 1.0%Wood
  • 0.7%Fuel oil, kerosene, etc.
Most commonly used house heating fuel in apartments in West Gate, VA
  • 61.2%Utility gas
  • 31.9%Electricity
  • 2.0%Bottled, tank, or LP gas
  • 2.0%No fuel used
  • 1.8%Other fuel
  • 1.0%Fuel oil, kerosene, etc.

Private vs. public school enrollment:

Students in private schools in grades 1 to 8 (elementary and middle school): 86
Here:

9.9%
Virginia:

9.5%

Students in private schools in grades 9 to 12 (high school): 9
Here:

2.7%
Virginia:

8.2%

Students in private undergraduate colleges: 25
Here:

9.4%
Virginia:

20.6%
School Enrollment by Level of School for Male Students
School Enrollment by Level of School for Female Students
Age and Sex of Sensory-Disabled Noninstitutionalized Residents
Age and Sex of Physically-Disabled Noninstitutionalized Residents
Age and Sex of Mentally-Disabled Noninstitutionalized Residents
Age and Sex of Self-Care Disabled Noninstitutionalized Residents
Age and Sex of Go-Outside-Home Disabled Noninstitutionalized Residents
Age and Sex of Noninstitutionalized Residents with Employment Disability