West Columbia, SC (South Carolina) Houses and Residents
Estimated median house or condo value in 2022: $200,790 (it was $79,200 in 2000 )
West Columbia:
$200,790South Carolina:
$254,600
Lower value quartile - upper value quartile: $134,596 - $261,801Mean price in 2022: Detached houses: $222,179 Here:
$222,179State:
$368,255
Townhouses or other attached units: $179,178 Here:
$179,178State:
$292,023
In 3-to-4-unit structures: $111,396 Here:
$111,396State:
$230,702
In 5-or-more-unit structures: $208,031 Here:
$208,031State:
$326,361
Mobile homes: $24,615 Here:
$24,615State:
$102,531
Total population: 15,920 (Urban population: 13,249, Rural population: 0)
Houses: 8,992 (8,461 occupied: 4,765 owner occupied, 3,689 renter occupied )
% of renters here:
44%State:
28%
Housing density: 1,480 houses/condos per square mile
Median price asked for vacant for-sale houses and condos in 2022: $454,531.
Median contract rent in 2022: $828 (lower quartile is $683, upper quartile is $1,130)
Median rent asked for vacant for-rent units in 2022: $1,388
Median gross rent in West Columbia, SC in 2022: $973
Housing units in West Columbia with a mortgage: 2,809 (354 second mortgage, 0 home equity loan, 358 both second mortgage and home equity loan )Houses without a mortgage: 87
Median household income for houses/condos with a mortgage: $77,538
Median household income for apartments without a mortgage: $56,131
Median monthly housing costs: $905
Data:
Median house or condo value ($)
Median house or condo value ($ change since 2000)
Median house or condo value ($) - White
Median house or condo value ($) - Black or African American
Median house or condo value ($) - Asian
Median house or condo value ($) - Hispanic or Latino
Median house or condo value ($) - American Indian and Alaska Native
Median house or condo value ($) - Multirace
Median house or condo value ($) - Other Race
Median price asked for mobile homes ($)
Household density (households per square mile)
Mean house or condo value by units in structure - 1, detached ($)
Mean house or condo value by units in structure - 1, attached ($)
Mean house or condo value by units in structure - 2 ($)
Mean house or condo value by units in structure by units in structure - 3 or 4 ($)
Mean house or condo value by units in structure - 5 or more ($)
Mean house or condo value by units in structure - Boat, RV, van, etc. ($)
Mean house or condo value by units in structure - Mobile home ($)
Median contract rent ($)
Median contract rent - Lower quartile ($)
Median contract rent - Upper quartile ($)
Median gross rent ($)
Urban houses (%)
Rural houses (%)
Houses occupied (%)
Houses occupied (% change since 2000)
Houses owner occupied (%)
Houses owner occupied (% change since 2000)
Houses renter occupied (%)
Houses renter occupied (% change since 2000)
Vacant housing units - For rent (%)
Vacant housing units - For rent (% change since 2000)
Vacant housing units - For sale only (%)
Vacant housing units - For sale only (% change since 2000)
Vacant housing units - Rented or sold, not occupied (%)
Vacant housing units - Rented or sold, not occupied (% change since 2000)
Vacant housing units - For seasonal, recreational, or occasional use (%)
Vacant housing units - For seasonal, recreational, or occasional use (% change since 2000)
Vacant housing units - For migrant workers (%)
Vacant housing units - For migrant workers (% change since 2000)
Vacant housing units - Other vacant (%)
Vacant housing units - Other vacant (% change since 2000)
Median monthly housing costs ($)
Median household income for houses/condos with a mortgage ($)
Median household income for houses/condos without a mortgage ($)
Median household income ($)
Median household income ($) - White
Median household income ($) - Black or African American
Median household income ($) - Asian
Median household income ($) - Hispanic or Latino
Median household income ($) - American Indian and Alaska Native
Median household income ($) - Multirace
Median household income ($) - Other Race
Mortgage status - with mortgage (%)
Mortgage status - with second mortgage (%)
Mortgage status - with home equity loan (%)
Mortgage status - with both second mortgage and home equity loan (%)
Mortgage status - without a mortgage (%)
Median year house/condo built
Median year apartment built
Household type by relationship - Male householder living alone (%)
Household type by relationship - Male householder not living alone (%)
Household type by relationship - Female householder living alone (%)
Household type by relationship - Female householder not living alone (%)
Household type by relationship - Opposite-Sex spouse (%)
Household type by relationship - Same-Sex spouse (%)
Household type by relationship - Opposite-Sex unmarried partner (%)
Household type by relationship - Same-Sex unmarried partner (%)
Household type by relationship - In group quarters (%)
Size of family households - 2-person household (%)
Size of family households - 3-person household (%)
Size of family households - 4-person household (%)
Size of family households - 5-person household (%)
Size of family households - 6-person household (%)
Size of family households - 7-or-more-person household (%)
Size of nonfamily households - 1-person household (%)
Size of nonfamily households - 2-person household (%)
Size of nonfamily households - 3-person household (%)
Size of nonfamily households - 4-person household (%)
Size of nonfamily households - 5-person household (%)
Size of nonfamily households - 6-person household (%)
Size of nonfamily households - 7-or-moreperson household (%)
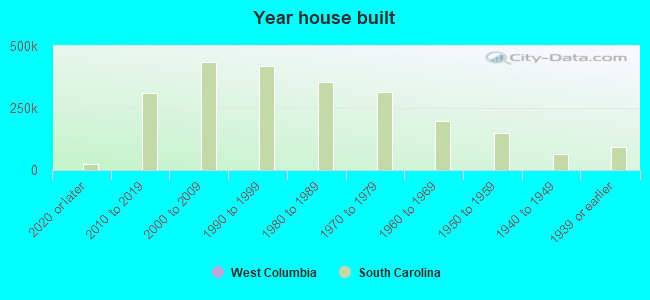
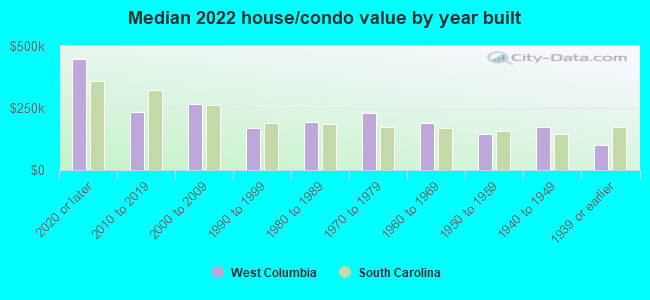
Year house built - Built 2010 or later (%)
Year house built - Built 2000 to 2009 (%)
Year house built - Built 1990 to 1999 (%)
Year house built - Built 1980 to 1989 (%)
Year house built - Built 1970 to 1979 (%)
Year house built - Built 1960 to 1969 (%)
Year house built - Built 1950 to 1959 (%)
Year house built - Built 1940 to 1949 (%)
Year house built - Built 1939 or earlier (%)
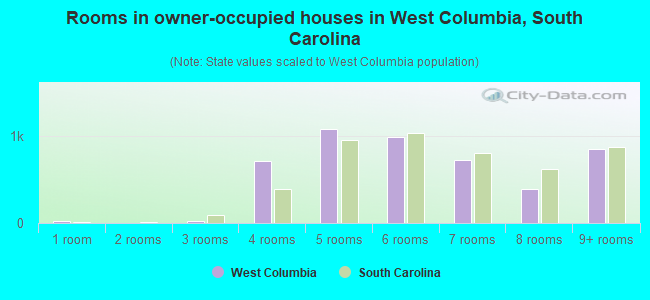
Median number of rooms in houses and condos
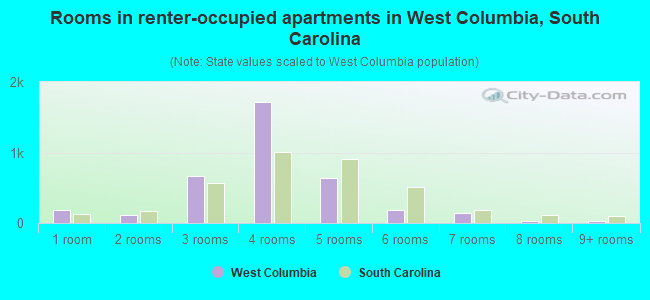
Median number of rooms in apartments
Median number of bedrooms in owner occupied houses
Mean number of bedrooms in owner occupied houses
Median number of bedrooms in renter occupied houses
Mean number of bedrooms in renter occupied houses
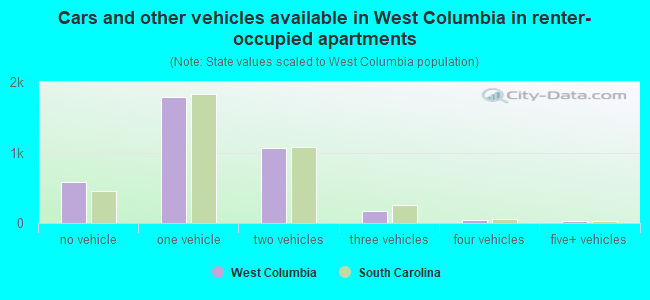
Median number of vehichles in owner occupied houses
Mean number of vehichles in owner occupied houses
Median number of vehichles in renter occupied houses
Mean number of vehichles in renter occupied houses
Rooms in owner-occupied houses - 1 room (%)
Rooms in owner-occupied houses - 2 rooms (%)
Rooms in owner-occupied houses - 3 rooms (%)
Rooms in owner-occupied houses - 4 rooms (%)
Rooms in owner-occupied houses - 5 rooms (%)
Rooms in owner-occupied houses - 6 rooms (%)
Rooms in owner-occupied houses - 7 rooms (%)
Rooms in owner-occupied houses - 8 rooms (%)
Rooms in owner-occupied houses - 9+ rooms (%)
Rooms in renter-occupied houses - 1 room (%)
Rooms in renter-occupied houses - 2 rooms (%)
Rooms in renter-occupied houses - 3 rooms (%)
Rooms in renter-occupied houses - 4 rooms (%)
Rooms in renter-occupied houses - 5 rooms (%)
Rooms in renter-occupied houses - 6 rooms (%)
Rooms in renter-occupied houses - 7 rooms (%)
Rooms in renter-occupied houses - 8 rooms (%)
Rooms in renter-occupied houses - 9+ rooms (%)
Bedrooms in owner-occupied houses - no bedrooms (%)
Bedrooms in owner-occupied houses - 1 bedroom (%)
Bedrooms in owner-occupied houses - 2 bedrooms (%)
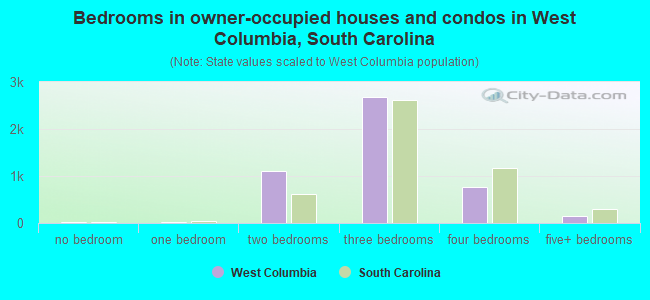
Bedrooms in owner-occupied houses - 3 bedrooms (%)
Bedrooms in owner-occupied houses - 4 bedrooms (%)
Bedrooms in owner-occupied houses - 5+ bedrooms (%)
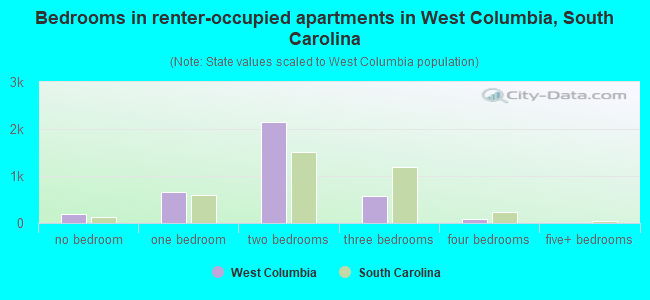
Bedrooms in renter-occupied houses - no bedrooms (%)
Bedrooms in renter-occupied houses - 1 bedroom (%)
Bedrooms in renter-occupied houses - 2 bedrooms (%)
Bedrooms in renter-occupied houses - 3 bedrooms (%)
Bedrooms in renter-occupied houses - 4 bedrooms (%)
Bedrooms in renter-occupied houses - 5+ bedrooms (%)
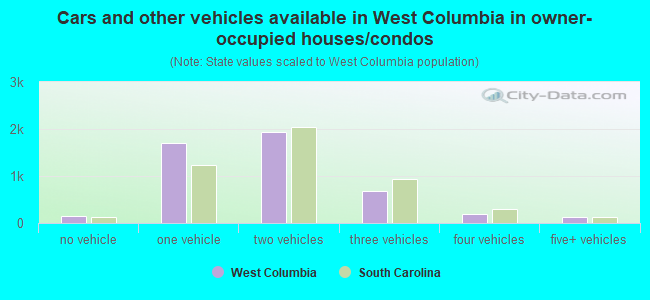
Vehicles available in owner-occupied houses - no vehicle available (%)
Vehicles available in owner-occupied houses - 1 vehicle available(%)
Vehicles available in owner-occupied houses - 2 Vehicles available (%)
Vehicles available in owner-occupied houses - 3 Vehicles available (%)
Vehicles available in owner-occupied houses - 4 Vehicles available (%)
Vehicles available in owner-occupied houses - 5+ Vehicles available (%)
Vehicles available in renter-occupied houses - no vehicle available (%)
Vehicles available in renter-occupied houses - 1 vehicle available (%)
Vehicles available in renter-occupied houses - 2 Vehicles available (%)
Vehicles available in renter-occupied houses - 3 Vehicles available (%)
Vehicles available in renter-occupied houses - 4 Vehicles available (%)
Vehicles available in renter-occupied houses - 5+ Vehicles available (%)
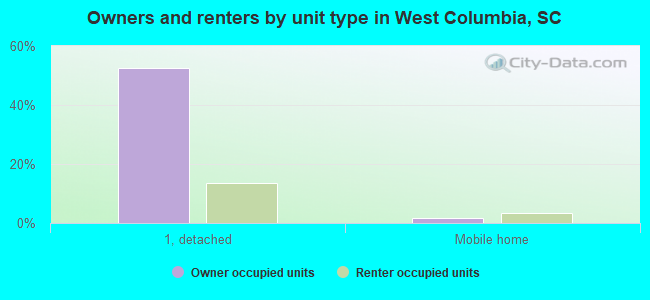
Housing units in structures - 1, detached (%)
Housing units in structures - 1, attached (%)
Housing units in structures - 2 (%)
Housing units in structures - 3 or 4 (%)
Housing units in structures - 5 to 9 (%)
Housing units in structures - 10 to 19 (%)
Housing units in structures - 20 to 49 (%)
Housing units in structures - 50 or more (%)
Housing units in structures - Mobile home (%)
Housing units in structures - Boat, RV, van, etc. (%)
Housing units in structures - Owners - 1, detached (%)
Housing units in structures - Owners - 1, attached (%)
Housing units in structures - Owners - 2 (%)
Housing units in structures - Owners - 3 or 4 (%)
Housing units in structures - Owners - 5 to 9 (%)
Housing units in structures - Owners - 10 to 19 (%)
Housing units in structures - Owners - 20 to 49 (%)
Housing units in structures - Owners - 50 or more (%)
Housing units in structures - Owners - Mobile home (%)
Housing units in structures - Owners - Boat, RV, van, etc. (%)
Housing units in structures - Renters - 1, detached (%)
Housing units in structures - Renters - 1, attached (%)
Housing units in structures - Renters - 2 (%)
Housing units in structures - Renters - 3 or 4 (%)
Housing units in structures - Renters - 5 to 9 (%)
Housing units in structures - Renters - 10 to 19 (%)
Housing units in structures - Renters - 20 to 49 (%)
Housing units in structures - Renters - 50 or more (%)
Housing units in structures - Renters - Mobile home (%)
Housing units in structures - Renters - Boat, RV, van, etc. (%)
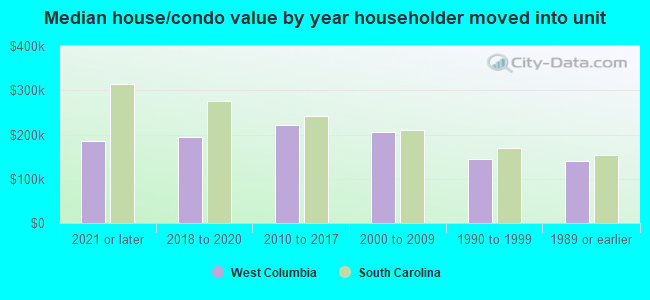
House/condo owner moved in on average (years ago)
Renter moved in on average (years ago)
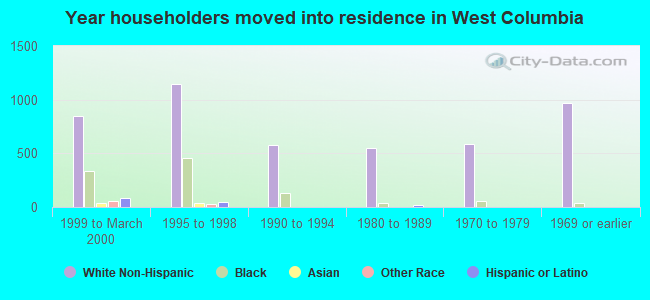
Year householder moved into unit - Moved in 1999 to March 2000 (%)
Year householder moved into unit - Moved in 1999 to March 2000 (%) - White
Year householder moved into unit - Moved in 1999 to March 2000 (%) - Black or African American
Year householder moved into unit - Moved in 1999 to March 2000 (%) - Asian
Year householder moved into unit - Moved in 1999 to March 2000 (%) - Hispanic or Latino
Year householder moved into unit - Moved in 1999 to March 2000 (%) - American Indian and Alaska Native
Year householder moved into unit - Moved in 1999 to March 2000 (%) - Multirace
Year householder moved into unit - Moved in 1999 to March 2000 (%) - Other Race
Year householder moved into unit - Moved in 1995 to 1998 (%)
Year householder moved into unit - Moved in 1995 to 1998 (%) - White
Year householder moved into unit - Moved in 1995 to 1998 (%) - Black or African American
Year householder moved into unit - Moved in 1995 to 1998 (%) - Asian
Year householder moved into unit - Moved in 1995 to 1998 (%) - Hispanic or Latino
Year householder moved into unit - Moved in 1995 to 1998 (%) - American Indian and Alaska Native
Year householder moved into unit - Moved in 1995 to 1998 (%) - Multirace
Year householder moved into unit - Moved in 1995 to 1998 (%) - Other Race
Year householder moved into unit - Moved in 1990 to 1994 (%)
Year householder moved into unit - Moved in 1990 to 1994 (%) - White
Year householder moved into unit - Moved in 1990 to 1994 (%) - Black or African American
Year householder moved into unit - Moved in 1990 to 1994 (%) - Asian
Year householder moved into unit - Moved in 1990 to 1994 (%) - Hispanic or Latino
Year householder moved into unit - Moved in 1990 to 1994 (%) - American Indian and Alaska Native
Year householder moved into unit - Moved in 1990 to 1994 (%) - Multirace
Year householder moved into unit - Moved in 1990 to 1994 (%) - Other Race
Year householder moved into unit - Moved in 1980 to 1989 (%)
Year householder moved into unit - Moved in 1980 to 1989 (%) - White
Year householder moved into unit - Moved in 1980 to 1989 (%) - Black or African American
Year householder moved into unit - Moved in 1980 to 1989 (%) - Asian
Year householder moved into unit - Moved in 1980 to 1989 (%) - Hispanic or Latino
Year householder moved into unit - Moved in 1980 to 1989 (%) - American Indian and Alaska Native
Year householder moved into unit - Moved in 1980 to 1989 (%) - Multirace
Year householder moved into unit - Moved in 1980 to 1989 (%) - Other Race
Year householder moved into unit - Moved in 1970 to 1979 (%)
Year householder moved into unit - Moved in 1970 to 1979 (%) - White
Year householder moved into unit - Moved in 1970 to 1979 (%) - Black or African American
Year householder moved into unit - Moved in 1970 to 1979 (%) - Asian
Year householder moved into unit - Moved in 1970 to 1979 (%) - Hispanic or Latino
Year householder moved into unit - Moved in 1970 to 1979 (%) - American Indian and Alaska Native
Year householder moved into unit - Moved in 1970 to 1979 (%) - Multirace
Year householder moved into unit - Moved in 1970 to 1979 (%) - Other Race
Year householder moved into unit - Moved in 1969 or earlier (%)
Year householder moved into unit - Moved in 1969 or earlier (%) - White
Year householder moved into unit - Moved in 1969 or earlier (%) - Black or African American
Year householder moved into unit - Moved in 1969 or earlier (%) - Asian
Year householder moved into unit - Moved in 1969 or earlier (%) - Hispanic or Latino
Year householder moved into unit - Moved in 1969 or earlier (%) - American Indian and Alaska Native
Year householder moved into unit - Moved in 1969 or earlier (%) - Multirace
Year householder moved into unit - Moved in 1969 or earlier (%) - Other Race
Housing units lacking complete plumbing facilities (%)
Housing units lacking complete kitchen facilities (%)
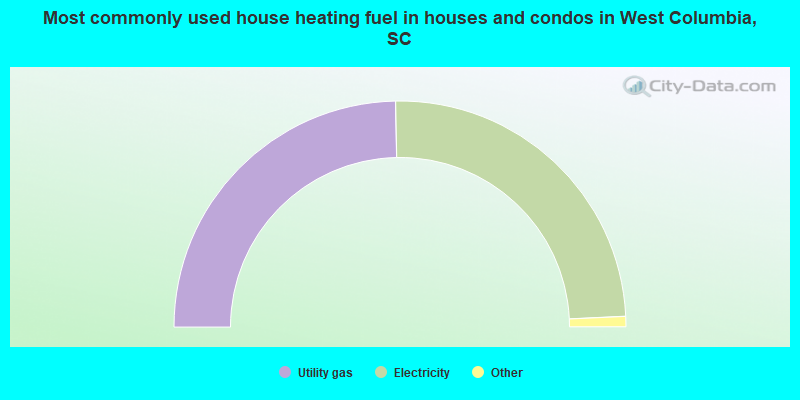
House heating fuel used in houses and condos - Utility gas (%)
House heating fuel used in houses and condos - Bottled, tank, or LP gas (%)
House heating fuel used in houses and condos - Electricity (%)
House heating fuel used in houses and condos - Fuel oil, kerosene, etc. (%)
House heating fuel used in houses and condos - Coal or coke (%)
House heating fuel used in houses and condos - Wood (%)
House heating fuel used in houses and condos - Solar energy (%)
House heating fuel used in houses and condos - Other fuel (%)
House heating fuel used in houses and condos - No fuel used (%)
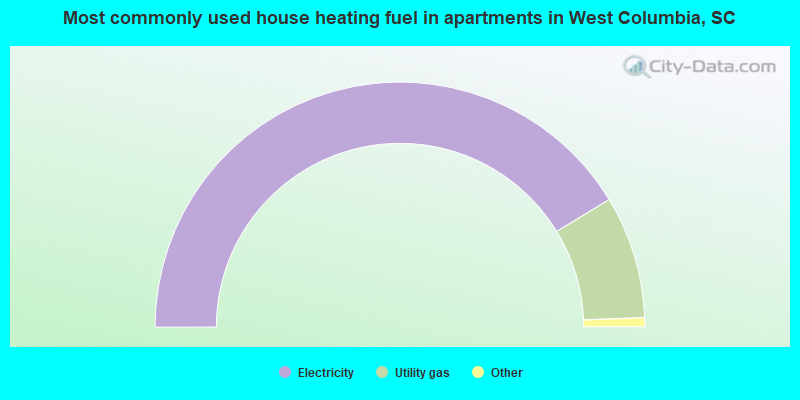
House heating fuel used in apartments - Utility gas (%)
House heating fuel used in apartments - Bottled, tank, or LP gas (%)
House heating fuel used in apartments - Electricity (%)
House heating fuel used in apartments - Fuel oil, kerosene, etc. (%)
House heating fuel used in apartments - Coal or coke (%)
House heating fuel used in apartments - Wood (%)
House heating fuel used in apartments - Solar energy (%)
House heating fuel used in apartments - Other fuel (%)
House heating fuel used in apartments - No fuel used (%)
Median year house/condo built: 1970Median year apartment built: 1977Household type by relationship:
Households: 17,981
Male householders: 3,768 (1,285 living alone ), Female householders: 4,637 (2,108 living alone )2,791 spouses (2,761 opposite-sex spouses ), 718 unmarried partners , (625 opposite-sex unmarried partners ), 3,771 children (3,602 natural , 108 adopted , 60 stepchildren ), 662 grandchildren , 157 brothers or sisters , 141 parents , 0 foster children , 139 other relatives , 844 non-relatives In group quarters: 349
Size of family households: 1,876 2-persons , 1,250 3-persons , 743 4-persons , 265 5-persons , 16 6-persons , 23 7-or-more-persons .
Size of nonfamily households: 3,305 1-person , 666 2-persons , 179 3-persons , 33 4-persons .
1,722 married couples with children. single-parent households (41 men , 939 women ).
86.7% of residents of West Columbia speak English at home. of residents speak Spanish at home (50% speak English very well , 26% speak English well , 24% speak English not well ).of residents speak other Indo-European language at home (96% speak English very well , 2% speak English well , 1% speak English not well ).of residents speak Asian or Pacific Island language at home (43% speak English very well , 53% speak English well , 4% speak English not well ).of residents speak other language at home (9% speak English very well , 70% speak English well , 21% speak English not well ).
Foreign born population: 1,563 (8.7%)of them are naturalized citizens )
Median number of rooms in houses and condos:
Median number of rooms in apartments
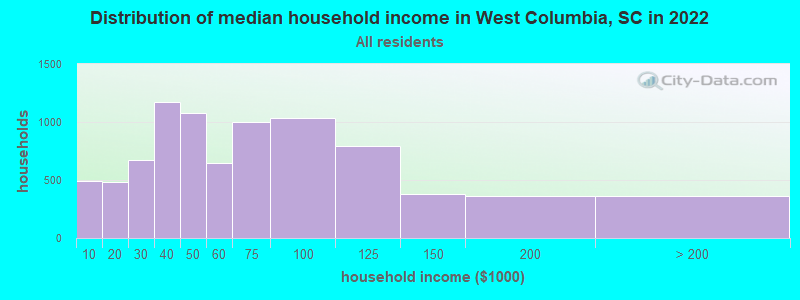
West Columbia, SC household income distribution 493 Less than $10,000481 $10,000 to $19,999676 $20,000 to $29,9991,169 $30,000 to $39,9991,075 $40,000 to $49,999645 $50,000 to $59,999996 $60,000 to $74,9991,035 $75,000 to $99,999790 $100,000 to $124,999378 $125,000 to $149,999360 $150,000 to $199,999358 $200,000 or more
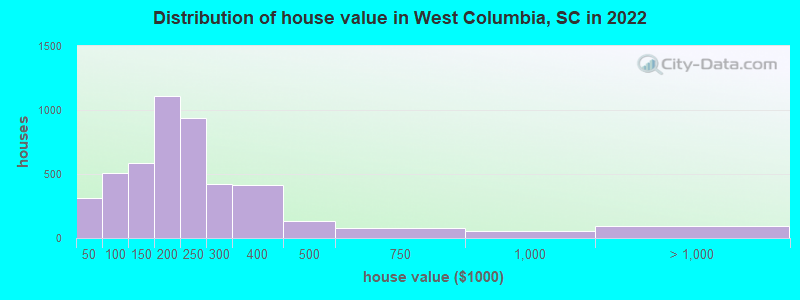
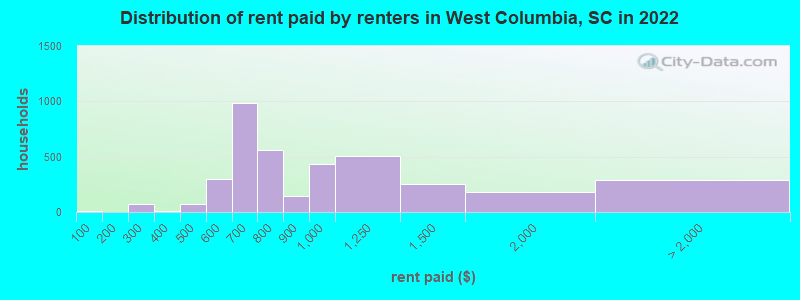
Home value of owner - occupied houses in 2022 in West Columbia, SC 145 Less than $10,00026 $10,000 to $14,99934 $15,000 to $19,99936 $20,000 to $24,99918 $25,000 to $29,99949 $40,000 to $49,99936 $50,000 to $59,99941 $60,000 to $69,99966 $70,000 to $79,999136 $80,000 to $89,999176 $90,000 to $99,999363 $100,000 to $124,999221 $125,000 to $149,999546 $150,000 to $174,999566 $175,000 to $199,999941 $200,000 to $249,999423 $250,000 to $299,999415 $300,000 to $399,999135 $400,000 to $499,99982 $500,000 to $749,99951 $750,000 to $999,99947 $1,000,000 to $1,499,99948 $1,500,000 to $1,999,999Rent paid by renters in 2022 in West Columbia, SC 11 Less than $10073 $200 to $2493 $300 to $3494 $350 to $39943 $400 to $44932 $450 to $499246 $500 to $54951 $550 to $599448 $600 to $649537 $650 to $699411 $700 to $749149 $750 to $799148 $800 to $899432 $900 to $999501 $1,000 to $1,249256 $1,250 to $1,499177 $1,500 to $1,99924 $2,000 to $2,49929 $2,500 to $2,99987 $3,500 or more150 No cash rent
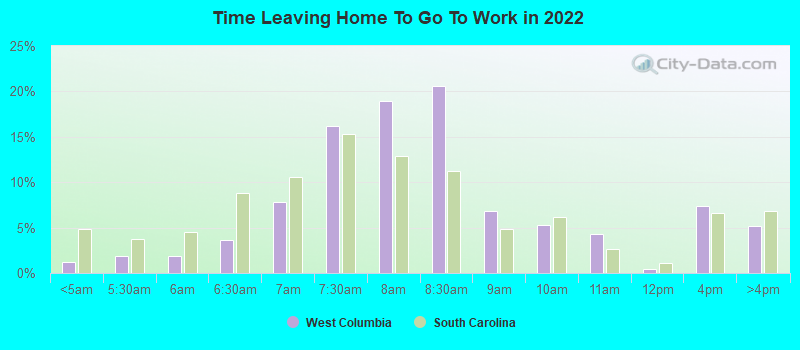
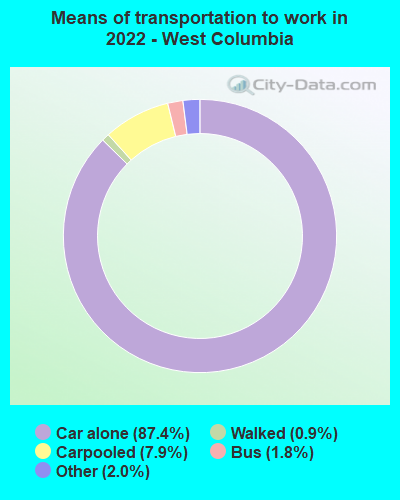
Percentage of workers working in this county: 60.3%Number of people working at home: 1,078 (11.8% of all workers )
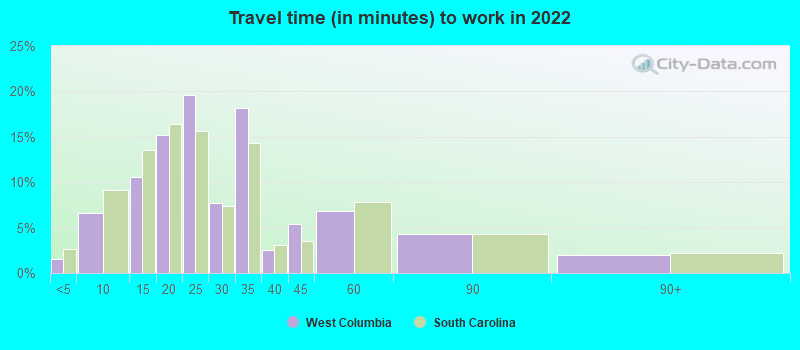
Travel time to work (commute)
Less than 5 minutes: 1095 to 9 minutes: 93110 to 14 minutes: 1,79915 to 19 minutes: 1,96420 to 24 minutes: 1,40425 to 29 minutes: 54130 to 34 minutes: 83435 to 39 minutes: 040 to 44 minutes: 6045 to 59 minutes: 15160 to 89 minutes: 17990 or more minutes: 35
Means of transportation to work:
Drove a car alone: 13,013 (80.5%)Carpooled: 1,026 (6.3%)Bus : 294 (1.8%)Taxi: 302 (1.9%)Bicycle: 7 (0.0%)Walked: 104 (0.6%)Worked at home: 1,078 (6.7%)
Unemployment by race in 2022
Unemployment rate for White non-Hispanic residents 1.8% Males3.5% FemalesUnemployment rate for Black residents 4.5% MalesUnemployment rate for Asian residents 16.3% MalesUnemployment rate for two or more race residents 5.6% FemalesUnemployment rate for Hispanic or Latino residents 1.2% Males
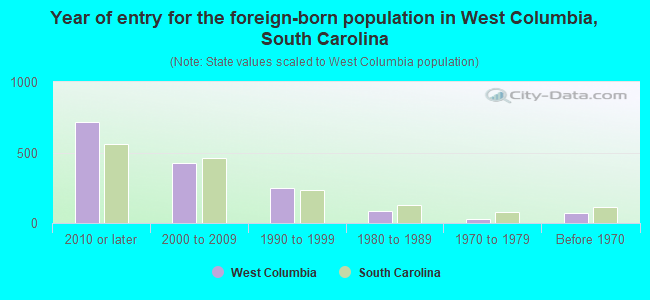
Year of entry for the foreign-born population in West Columbia, South Carolina
717 2010 or later 425 2000 to 2009 250 1990 to 1999 84 1980 to 1989 30 1970 to 1979 68 Before 1970
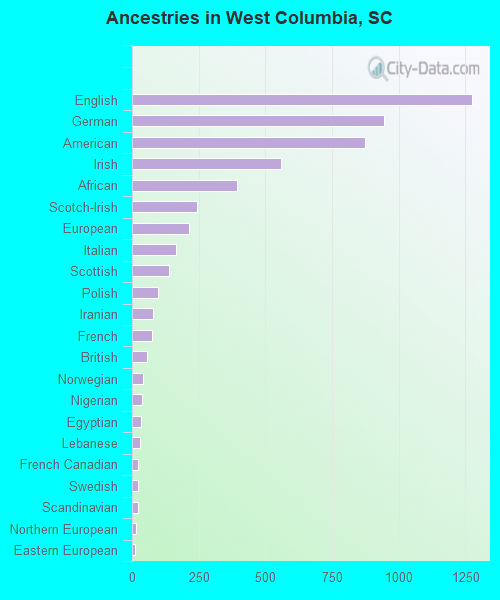
First ancestries reported:
English: 1,275 (13.6%)
German: 945 (10.1%)
American: 873 (9.3%)
Irish: 558 (6.0%)
African: 393 (4.2%)
Scotch-Irish: 244 (2.6%)
European: 215 (2.3%)
Italian: 164 (1.8%)
Scottish: 140 (1.5%)
Polish: 97 (1.0%)
Iranian: 80 (0.9%)
French: 76 (0.8%)
British: 56 (0.6%)
Norwegian: 41 (0.4%)
Nigerian: 38 (0.4%)
Egyptian: 35 (0.4%)
Lebanese: 31 (0.3%)
French Canadian: 24 (0.3%)
Swedish: 23 (0.2%)
Scandinavian: 21 (0.2%)
Northern European: 15 (0.2%)
Eastern European: 12 (0.1%)
Bulgarian: 8 (0.09%)
Dutch: 7 (0.07%)
Iraqi: 6 (0.06%)
Canadian: 6 (0.06%)
Danish: 5 (0.05%)
Latvian: 3 (0.03%) Most common places of birth for foreign-born residents (%): Mexico West Columbia:
25.6% (389)South Carolina:
22.5% (60,774)
China, excluding Hong Kong and Taiwan West Columbia:
8.8% (133)South Carolina:
3.2% (8,721)
Bangladesh West Columbia:
8.7% (132)South Carolina:
0.2% (628)
Guatemala West Columbia:
8.2% (124)South Carolina:
3.4% (9,058)
Honduras West Columbia:
7.4% (112)South Carolina:
4.8% (12,834)
India West Columbia:
6.8% (104)South Carolina:
6.8% (18,307)
Colombia West Columbia:
6.0% (91)South Carolina:
4.3% (11,533)
Germany West Columbia:
4.7% (72)South Carolina:
3.7% (9,982)
Iran West Columbia:
3.6% (54)South Carolina:
0.5% (1,270)
Venezuela West Columbia:
2.5% (38)South Carolina:
1.4% (3,822)
Korea West Columbia:
2.4% (36)South Carolina:
1.7% (4,513)
El Salvador West Columbia:
2.1% (32)South Carolina:
1.1% (2,998)
Canada West Columbia:
1.6% (25)South Carolina:
3.0% (8,193)
Egypt West Columbia:
1.6% (24)South Carolina:
0.4% (1,208)
South Africa West Columbia:
1.5% (23)South Carolina:
0.4% (1,091)
Place of birth for U.S.-born residents:
This state: 11,107Other state: 5,064Northeast: 1,105Midwest: 1,072South: 2,477West: 406 82.5% of West Columbia residents lived in the same house 1 years ago.
Out of people who lived in different houses, 29.4% lived in this county.
Out of people who lived in different counties, 53.7% lived in South Carolina.
West Columbia:
82.5%State average:
86.5%
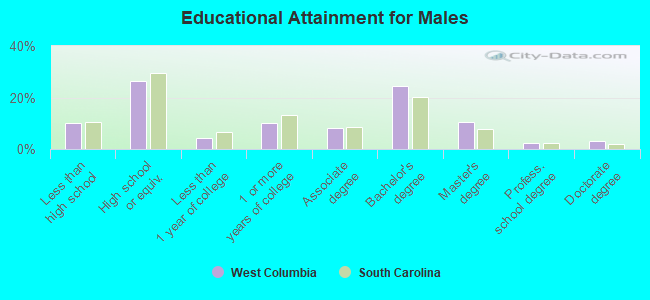
Education attainment for males 25 years and older:
No schooling: 25Nursery to 4th grade: 155th and 6th grade: 517th and 8th grade: 1189th grade: 7610th grade: 17611th grade: 5012th grade, no diploma: 60High school graduate (or equivalency): 1,503Less than 1 year of college: 251Some college more than 1 year, no degree: 577Associate degree: 467Bachelor's degree: 1,377Master's degree: 598Professional school degree: 135Doctorate degree: 187
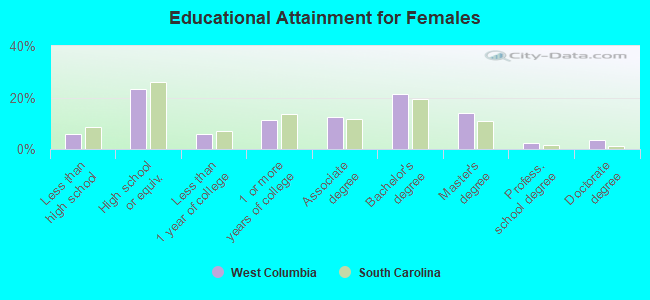
Education attainment for females 25 years and older:
No schooling: 33Nursery to 4th grade: 05th and 6th grade: 577th and 8th grade: 479th grade: 4510th grade: 8611th grade: 11812th grade, no diploma: 38High school graduate (or equivalency): 1,707Less than 1 year of college: 426Some college more than 1 year, no degree: 827Associate degree: 919Bachelor's degree: 1,570Master's degree: 1,035Professional school degree: 177Doctorate degree: 271
Housing units in structures:
One, detached: 5,378One, attached: 345Two: 4873 or 4: 6255 to 9: 32310 to 19: 57020 to 49: 41550 or more: 418Mobile homes: 428Housing units lacking complete plumbing facilities in 2022: 0.6%Housing units lacking complete kitchen facilities in 2022: 2.6%House/condo owner moved in on average 9 years ago
Renter moved in on average 2 years ago
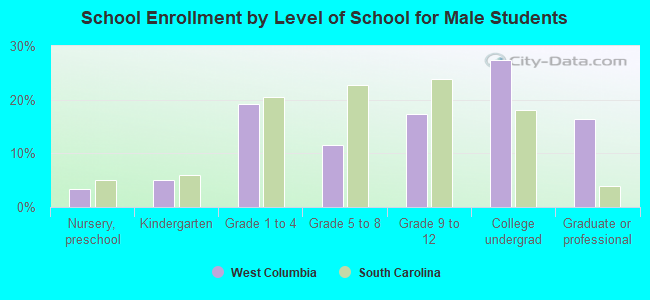
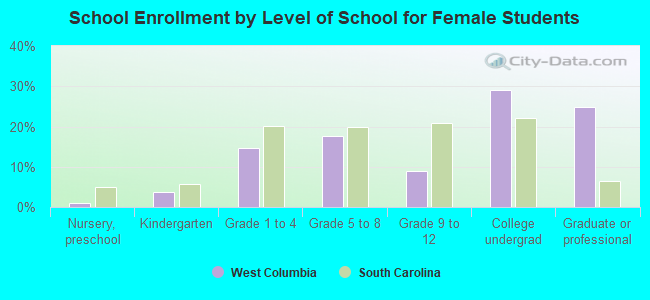
Private vs. public school enrollment:
Students in private schools in grades 1 to 8 (elementary and middle school): 137 Here:
12.1%South Carolina:
14.4%
Students in private schools in grades 9 to 12 (high school): 66 Here:
14.2%South Carolina:
11.1%
Students in private undergraduate colleges: 136 Here:
13.8%South Carolina:
21.9%