West Chicago, IL (Illinois) Houses and Residents
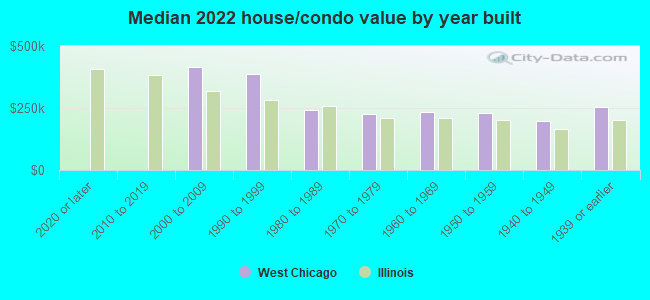
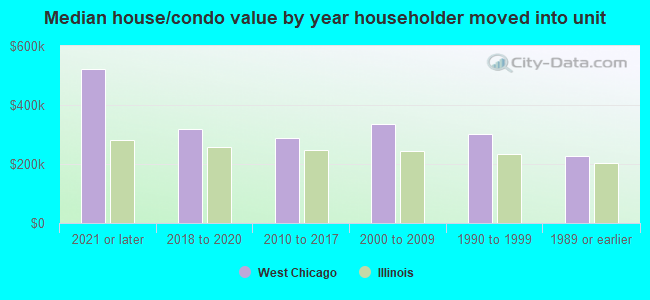
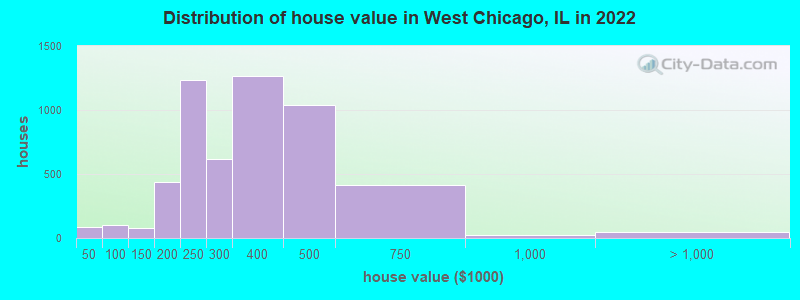
Estimated median house or condo value in 2022: $299,930 (it was $160,200 in 2000 )
West Chicago:
$299,930Illinois:
$251,600
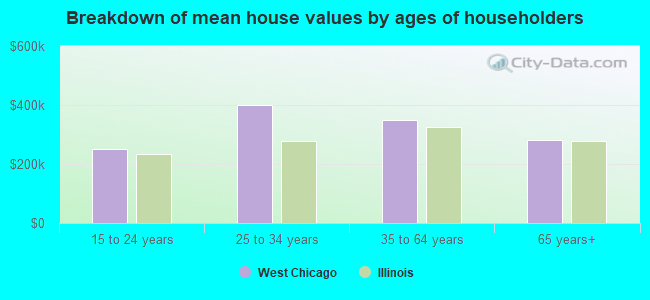
Lower value quartile - upper value quartile: $230,310 - $417,754Mean price in 2022: Detached houses: $350,597 Here:
$350,597State:
$310,164
Townhouses or other attached units: $267,006 Here:
$267,006State:
$286,230
In 2-unit structures: $417,530 Here:
$417,530State:
$299,638
In 5-or-more-unit structures: $233,643 Here:
$233,643State:
$318,887
Mobile homes: $60,890 Here:
$60,890State:
$78,855
Total population: 27,507 (Urban population: 23,889, Rural population: 30 (all nonfarm) )
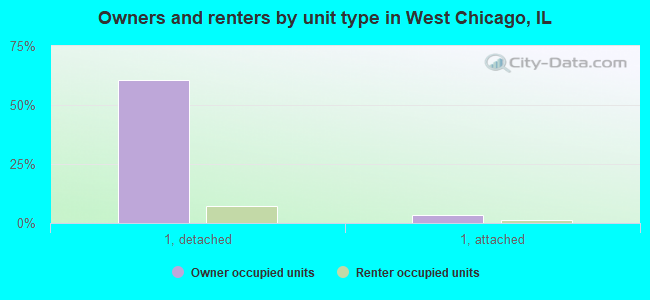
Houses: 7,798 (7,417 occupied: 5,299 owner occupied, 2,126 renter occupied )
% of renters here:
29%State:
33%
Housing density: 563 houses/condos per square mile
Median price asked for vacant for-sale houses and condos in 2022: $369,237.
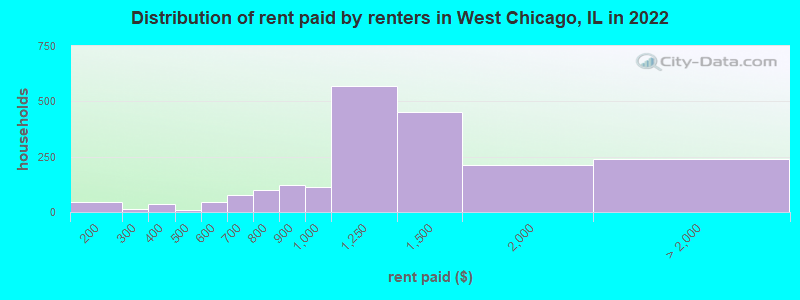
Median contract rent in 2022: $1,185 (lower quartile is $977, upper quartile is $1,450)
Median rent asked for vacant for-rent units in 2022: $1,237
Median gross rent in West Chicago, IL in 2022: $1,291
Housing units in West Chicago with a mortgage: 3,621 (284 second mortgage, 0 home equity loan, 266 both second mortgage and home equity loan )Houses without a mortgage: 39
Median household income for houses/condos with a mortgage: $131,330
Median household income for apartments without a mortgage: $94,472
Median monthly housing costs: $1,542
Data:
Median house or condo value ($)
Median house or condo value ($ change since 2000)
Median house or condo value ($) - White
Median house or condo value ($) - Black or African American
Median house or condo value ($) - Asian
Median house or condo value ($) - Hispanic or Latino
Median house or condo value ($) - American Indian and Alaska Native
Median house or condo value ($) - Multirace
Median house or condo value ($) - Other Race
Median price asked for mobile homes ($)
Household density (households per square mile)
Mean house or condo value by units in structure - 1, detached ($)
Mean house or condo value by units in structure - 1, attached ($)
Mean house or condo value by units in structure - 2 ($)
Mean house or condo value by units in structure by units in structure - 3 or 4 ($)
Mean house or condo value by units in structure - 5 or more ($)
Mean house or condo value by units in structure - Boat, RV, van, etc. ($)
Mean house or condo value by units in structure - Mobile home ($)
Median contract rent ($)
Median contract rent - Lower quartile ($)
Median contract rent - Upper quartile ($)
Median gross rent ($)
Urban houses (%)
Rural houses (%)
Houses occupied (%)
Houses occupied (% change since 2000)
Houses owner occupied (%)
Houses owner occupied (% change since 2000)
Houses renter occupied (%)
Houses renter occupied (% change since 2000)
Vacant housing units - For rent (%)
Vacant housing units - For rent (% change since 2000)
Vacant housing units - For sale only (%)
Vacant housing units - For sale only (% change since 2000)
Vacant housing units - Rented or sold, not occupied (%)
Vacant housing units - Rented or sold, not occupied (% change since 2000)
Vacant housing units - For seasonal, recreational, or occasional use (%)
Vacant housing units - For seasonal, recreational, or occasional use (% change since 2000)
Vacant housing units - For migrant workers (%)
Vacant housing units - For migrant workers (% change since 2000)
Vacant housing units - Other vacant (%)
Vacant housing units - Other vacant (% change since 2000)
Median monthly housing costs ($)
Median household income for houses/condos with a mortgage ($)
Median household income for houses/condos without a mortgage ($)
Median household income ($)
Median household income ($) - White
Median household income ($) - Black or African American
Median household income ($) - Asian
Median household income ($) - Hispanic or Latino
Median household income ($) - American Indian and Alaska Native
Median household income ($) - Multirace
Median household income ($) - Other Race
Mortgage status - with mortgage (%)
Mortgage status - with second mortgage (%)
Mortgage status - with home equity loan (%)
Mortgage status - with both second mortgage and home equity loan (%)
Mortgage status - without a mortgage (%)
Median year house/condo built
Median year apartment built
Household type by relationship - Male householder living alone (%)
Household type by relationship - Male householder not living alone (%)
Household type by relationship - Female householder living alone (%)
Household type by relationship - Female householder not living alone (%)
Household type by relationship - Opposite-Sex spouse (%)
Household type by relationship - Same-Sex spouse (%)
Household type by relationship - Opposite-Sex unmarried partner (%)
Household type by relationship - Same-Sex unmarried partner (%)
Household type by relationship - In group quarters (%)
Size of family households - 2-person household (%)
Size of family households - 3-person household (%)
Size of family households - 4-person household (%)
Size of family households - 5-person household (%)
Size of family households - 6-person household (%)
Size of family households - 7-or-more-person household (%)
Size of nonfamily households - 1-person household (%)
Size of nonfamily households - 2-person household (%)
Size of nonfamily households - 3-person household (%)
Size of nonfamily households - 4-person household (%)
Size of nonfamily households - 5-person household (%)
Size of nonfamily households - 6-person household (%)
Size of nonfamily households - 7-or-moreperson household (%)
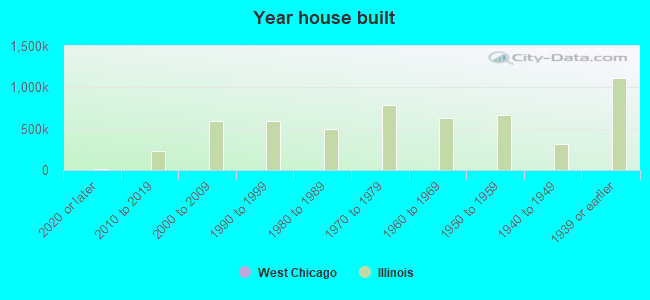
Year house built - Built 2010 or later (%)
Year house built - Built 2000 to 2009 (%)
Year house built - Built 1990 to 1999 (%)
Year house built - Built 1980 to 1989 (%)
Year house built - Built 1970 to 1979 (%)
Year house built - Built 1960 to 1969 (%)
Year house built - Built 1950 to 1959 (%)
Year house built - Built 1940 to 1949 (%)
Year house built - Built 1939 or earlier (%)
Median number of rooms in houses and condos
Median number of rooms in apartments
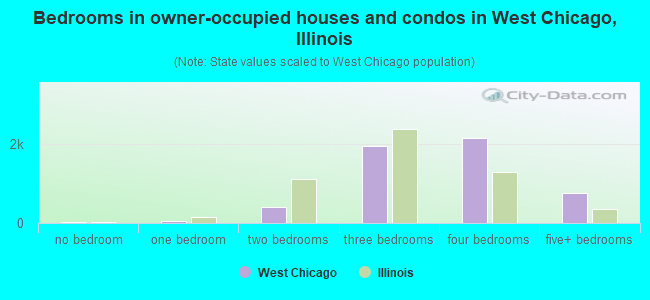
Median number of bedrooms in owner occupied houses
Mean number of bedrooms in owner occupied houses
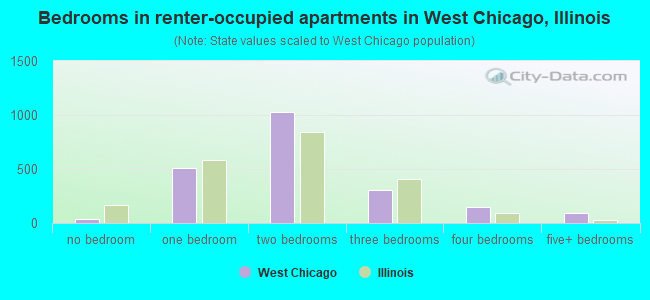
Median number of bedrooms in renter occupied houses
Mean number of bedrooms in renter occupied houses
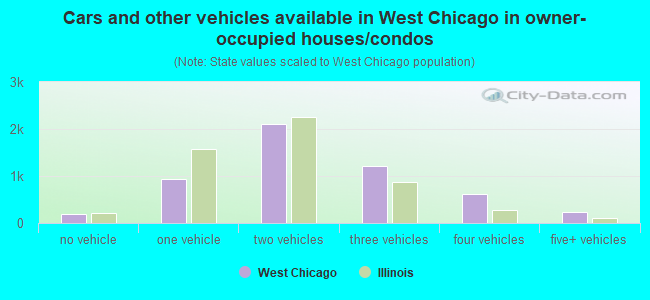
Median number of vehichles in owner occupied houses
Mean number of vehichles in owner occupied houses
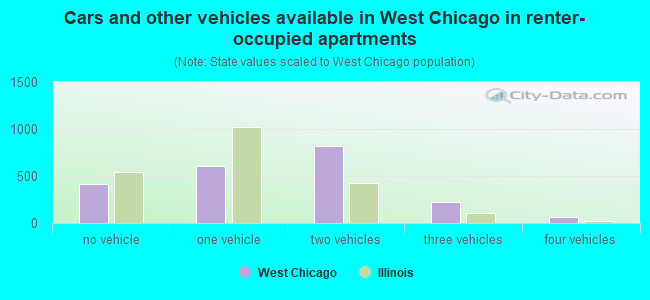
Median number of vehichles in renter occupied houses
Mean number of vehichles in renter occupied houses
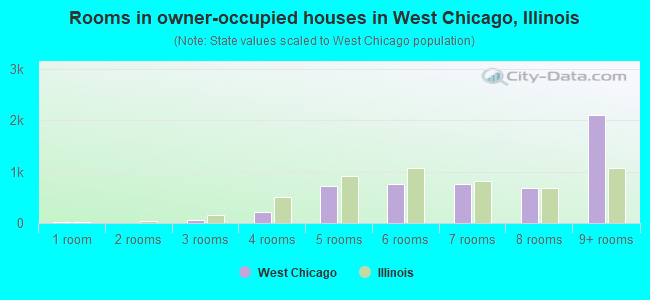
Rooms in owner-occupied houses - 1 room (%)
Rooms in owner-occupied houses - 2 rooms (%)
Rooms in owner-occupied houses - 3 rooms (%)
Rooms in owner-occupied houses - 4 rooms (%)
Rooms in owner-occupied houses - 5 rooms (%)
Rooms in owner-occupied houses - 6 rooms (%)
Rooms in owner-occupied houses - 7 rooms (%)
Rooms in owner-occupied houses - 8 rooms (%)
Rooms in owner-occupied houses - 9+ rooms (%)
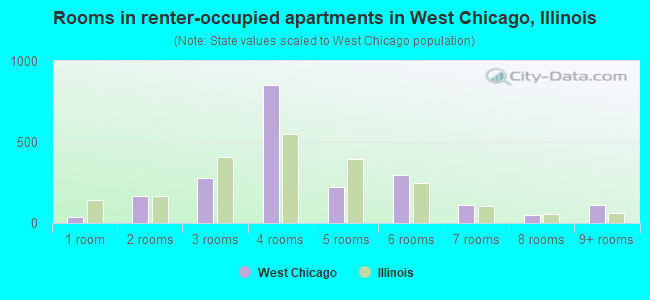
Rooms in renter-occupied houses - 1 room (%)
Rooms in renter-occupied houses - 2 rooms (%)
Rooms in renter-occupied houses - 3 rooms (%)
Rooms in renter-occupied houses - 4 rooms (%)
Rooms in renter-occupied houses - 5 rooms (%)
Rooms in renter-occupied houses - 6 rooms (%)
Rooms in renter-occupied houses - 7 rooms (%)
Rooms in renter-occupied houses - 8 rooms (%)
Rooms in renter-occupied houses - 9+ rooms (%)
Bedrooms in owner-occupied houses - no bedrooms (%)
Bedrooms in owner-occupied houses - 1 bedroom (%)
Bedrooms in owner-occupied houses - 2 bedrooms (%)
Bedrooms in owner-occupied houses - 3 bedrooms (%)
Bedrooms in owner-occupied houses - 4 bedrooms (%)
Bedrooms in owner-occupied houses - 5+ bedrooms (%)
Bedrooms in renter-occupied houses - no bedrooms (%)
Bedrooms in renter-occupied houses - 1 bedroom (%)
Bedrooms in renter-occupied houses - 2 bedrooms (%)
Bedrooms in renter-occupied houses - 3 bedrooms (%)
Bedrooms in renter-occupied houses - 4 bedrooms (%)
Bedrooms in renter-occupied houses - 5+ bedrooms (%)
Vehicles available in owner-occupied houses - no vehicle available (%)
Vehicles available in owner-occupied houses - 1 vehicle available(%)
Vehicles available in owner-occupied houses - 2 Vehicles available (%)
Vehicles available in owner-occupied houses - 3 Vehicles available (%)
Vehicles available in owner-occupied houses - 4 Vehicles available (%)
Vehicles available in owner-occupied houses - 5+ Vehicles available (%)
Vehicles available in renter-occupied houses - no vehicle available (%)
Vehicles available in renter-occupied houses - 1 vehicle available (%)
Vehicles available in renter-occupied houses - 2 Vehicles available (%)
Vehicles available in renter-occupied houses - 3 Vehicles available (%)
Vehicles available in renter-occupied houses - 4 Vehicles available (%)
Vehicles available in renter-occupied houses - 5+ Vehicles available (%)
Housing units in structures - 1, detached (%)
Housing units in structures - 1, attached (%)
Housing units in structures - 2 (%)
Housing units in structures - 3 or 4 (%)
Housing units in structures - 5 to 9 (%)
Housing units in structures - 10 to 19 (%)
Housing units in structures - 20 to 49 (%)
Housing units in structures - 50 or more (%)
Housing units in structures - Mobile home (%)
Housing units in structures - Boat, RV, van, etc. (%)
Housing units in structures - Owners - 1, detached (%)
Housing units in structures - Owners - 1, attached (%)
Housing units in structures - Owners - 2 (%)
Housing units in structures - Owners - 3 or 4 (%)
Housing units in structures - Owners - 5 to 9 (%)
Housing units in structures - Owners - 10 to 19 (%)
Housing units in structures - Owners - 20 to 49 (%)
Housing units in structures - Owners - 50 or more (%)
Housing units in structures - Owners - Mobile home (%)
Housing units in structures - Owners - Boat, RV, van, etc. (%)
Housing units in structures - Renters - 1, detached (%)
Housing units in structures - Renters - 1, attached (%)
Housing units in structures - Renters - 2 (%)
Housing units in structures - Renters - 3 or 4 (%)
Housing units in structures - Renters - 5 to 9 (%)
Housing units in structures - Renters - 10 to 19 (%)
Housing units in structures - Renters - 20 to 49 (%)
Housing units in structures - Renters - 50 or more (%)
Housing units in structures - Renters - Mobile home (%)
Housing units in structures - Renters - Boat, RV, van, etc. (%)
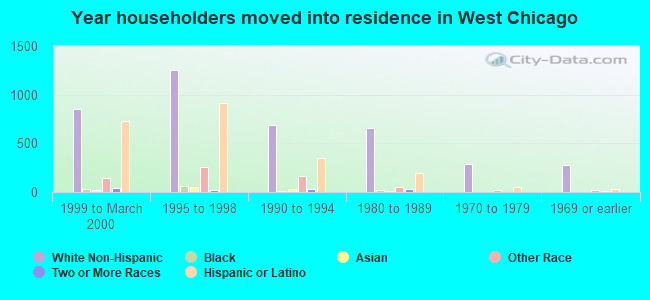
House/condo owner moved in on average (years ago)
Renter moved in on average (years ago)
Year householder moved into unit - Moved in 1999 to March 2000 (%)
Year householder moved into unit - Moved in 1999 to March 2000 (%) - White
Year householder moved into unit - Moved in 1999 to March 2000 (%) - Black or African American
Year householder moved into unit - Moved in 1999 to March 2000 (%) - Asian
Year householder moved into unit - Moved in 1999 to March 2000 (%) - Hispanic or Latino
Year householder moved into unit - Moved in 1999 to March 2000 (%) - American Indian and Alaska Native
Year householder moved into unit - Moved in 1999 to March 2000 (%) - Multirace
Year householder moved into unit - Moved in 1999 to March 2000 (%) - Other Race
Year householder moved into unit - Moved in 1995 to 1998 (%)
Year householder moved into unit - Moved in 1995 to 1998 (%) - White
Year householder moved into unit - Moved in 1995 to 1998 (%) - Black or African American
Year householder moved into unit - Moved in 1995 to 1998 (%) - Asian
Year householder moved into unit - Moved in 1995 to 1998 (%) - Hispanic or Latino
Year householder moved into unit - Moved in 1995 to 1998 (%) - American Indian and Alaska Native
Year householder moved into unit - Moved in 1995 to 1998 (%) - Multirace
Year householder moved into unit - Moved in 1995 to 1998 (%) - Other Race
Year householder moved into unit - Moved in 1990 to 1994 (%)
Year householder moved into unit - Moved in 1990 to 1994 (%) - White
Year householder moved into unit - Moved in 1990 to 1994 (%) - Black or African American
Year householder moved into unit - Moved in 1990 to 1994 (%) - Asian
Year householder moved into unit - Moved in 1990 to 1994 (%) - Hispanic or Latino
Year householder moved into unit - Moved in 1990 to 1994 (%) - American Indian and Alaska Native
Year householder moved into unit - Moved in 1990 to 1994 (%) - Multirace
Year householder moved into unit - Moved in 1990 to 1994 (%) - Other Race
Year householder moved into unit - Moved in 1980 to 1989 (%)
Year householder moved into unit - Moved in 1980 to 1989 (%) - White
Year householder moved into unit - Moved in 1980 to 1989 (%) - Black or African American
Year householder moved into unit - Moved in 1980 to 1989 (%) - Asian
Year householder moved into unit - Moved in 1980 to 1989 (%) - Hispanic or Latino
Year householder moved into unit - Moved in 1980 to 1989 (%) - American Indian and Alaska Native
Year householder moved into unit - Moved in 1980 to 1989 (%) - Multirace
Year householder moved into unit - Moved in 1980 to 1989 (%) - Other Race
Year householder moved into unit - Moved in 1970 to 1979 (%)
Year householder moved into unit - Moved in 1970 to 1979 (%) - White
Year householder moved into unit - Moved in 1970 to 1979 (%) - Black or African American
Year householder moved into unit - Moved in 1970 to 1979 (%) - Asian
Year householder moved into unit - Moved in 1970 to 1979 (%) - Hispanic or Latino
Year householder moved into unit - Moved in 1970 to 1979 (%) - American Indian and Alaska Native
Year householder moved into unit - Moved in 1970 to 1979 (%) - Multirace
Year householder moved into unit - Moved in 1970 to 1979 (%) - Other Race
Year householder moved into unit - Moved in 1969 or earlier (%)
Year householder moved into unit - Moved in 1969 or earlier (%) - White
Year householder moved into unit - Moved in 1969 or earlier (%) - Black or African American
Year householder moved into unit - Moved in 1969 or earlier (%) - Asian
Year householder moved into unit - Moved in 1969 or earlier (%) - Hispanic or Latino
Year householder moved into unit - Moved in 1969 or earlier (%) - American Indian and Alaska Native
Year householder moved into unit - Moved in 1969 or earlier (%) - Multirace
Year householder moved into unit - Moved in 1969 or earlier (%) - Other Race
Housing units lacking complete plumbing facilities (%)
Housing units lacking complete kitchen facilities (%)
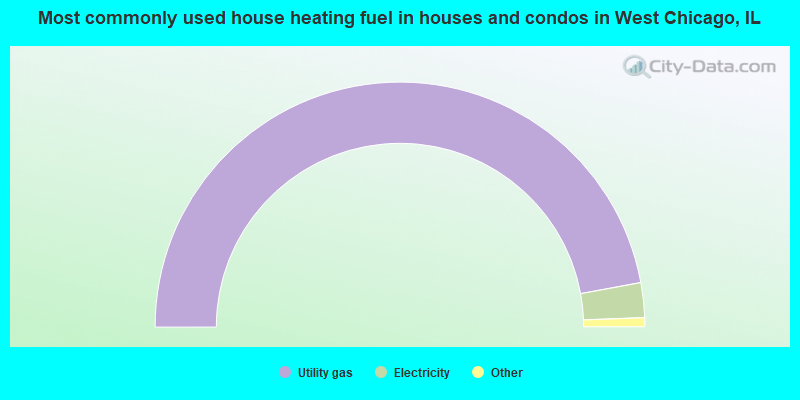
House heating fuel used in houses and condos - Utility gas (%)
House heating fuel used in houses and condos - Bottled, tank, or LP gas (%)
House heating fuel used in houses and condos - Electricity (%)
House heating fuel used in houses and condos - Fuel oil, kerosene, etc. (%)
House heating fuel used in houses and condos - Coal or coke (%)
House heating fuel used in houses and condos - Wood (%)
House heating fuel used in houses and condos - Solar energy (%)
House heating fuel used in houses and condos - Other fuel (%)
House heating fuel used in houses and condos - No fuel used (%)
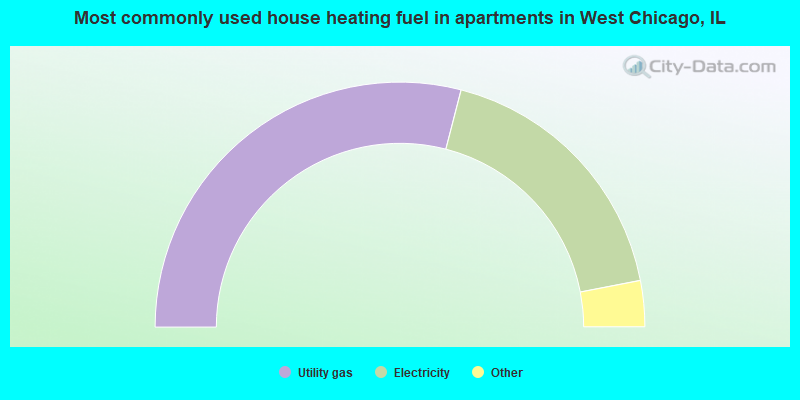
House heating fuel used in apartments - Utility gas (%)
House heating fuel used in apartments - Bottled, tank, or LP gas (%)
House heating fuel used in apartments - Electricity (%)
House heating fuel used in apartments - Fuel oil, kerosene, etc. (%)
House heating fuel used in apartments - Coal or coke (%)
House heating fuel used in apartments - Wood (%)
House heating fuel used in apartments - Solar energy (%)
House heating fuel used in apartments - Other fuel (%)
House heating fuel used in apartments - No fuel used (%)
Median year house/condo built: 1991Median year apartment built: 1974Household type by relationship:
Households: 25,365
Male householders: 4,080 (595 living alone ), Female householders: 3,223 (653 living alone )4,372 spouses (4,300 opposite-sex spouses ), 356 unmarried partners , (353 opposite-sex unmarried partners ), 8,801 children (8,218 natural , 218 adopted , 364 stepchildren ), 737 grandchildren , 618 brothers or sisters , 863 parents , 21 foster children , 872 other relatives , 1,048 non-relatives In group quarters: 369
Size of family households: 1,625 2-persons , 1,117 3-persons , 1,497 4-persons , 678 5-persons , 337 6-persons , 592 7-or-more-persons .
Size of nonfamily households: 1,294 1-person , 150 2-persons , 114 3-persons , 23 5-persons .
4,162 married couples with children. single-parent households (158 men , 791 women ).
47.3% of residents of West Chicago speak English at home. of residents speak Spanish at home (48% speak English very well , 20% speak English well , 21% speak English not well , 10% don't speak English at all ).of residents speak other Indo-European language at home (67% speak English very well , 26% speak English well , 7% speak English not well ).of residents speak Asian or Pacific Island language at home (76% speak English very well , 16% speak English well , 8% speak English not well ).of residents speak other language at home (32% speak English very well , 19% speak English well , 48% speak English not well ).
Foreign born population: 8,480 (33.4%)of them are naturalized citizens )
Median number of rooms in houses and condos:
Median number of rooms in apartments
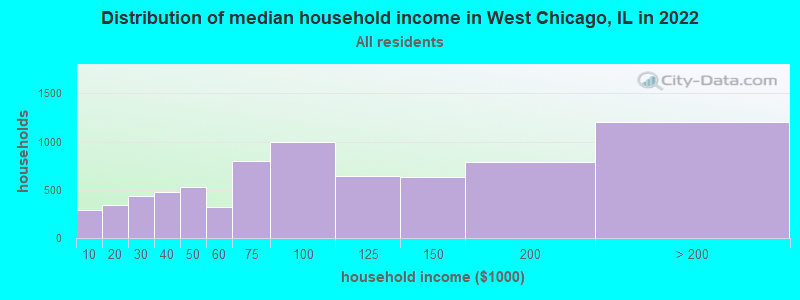
West Chicago, IL household income distribution 291 Less than $10,000343 $10,000 to $19,999432 $20,000 to $29,999479 $30,000 to $39,999525 $40,000 to $49,999317 $50,000 to $59,999801 $60,000 to $74,999994 $75,000 to $99,999648 $100,000 to $124,999630 $125,000 to $149,999793 $150,000 to $199,9991,203 $200,000 or more
Home value of owner - occupied houses in 2022 in West Chicago, IL 31 $10,000 to $14,9993 $15,000 to $19,99915 $20,000 to $24,99910 $30,000 to $34,99914 $35,000 to $39,99911 $40,000 to $49,99914 $50,000 to $59,99963 $60,000 to $69,9998 $70,000 to $79,99934 $100,000 to $124,99946 $125,000 to $149,999136 $150,000 to $174,999304 $175,000 to $199,9991,234 $200,000 to $249,999615 $250,000 to $299,9991,267 $300,000 to $399,9991,039 $400,000 to $499,999415 $500,000 to $749,99920 $750,000 to $999,9995 $1,500,000 to $1,999,99938 $2,000,000 or moreRent paid by renters in 2022 in West Chicago, IL 47 $150 to $19913 $200 to $24937 $300 to $3499 $450 to $49942 $550 to $59966 $600 to $6499 $650 to $69912 $700 to $74986 $750 to $799119 $800 to $899110 $900 to $999570 $1,000 to $1,249454 $1,250 to $1,499212 $1,500 to $1,99984 $2,000 to $2,49928 $2,500 to $2,99943 $3,500 or more84 No cash rent
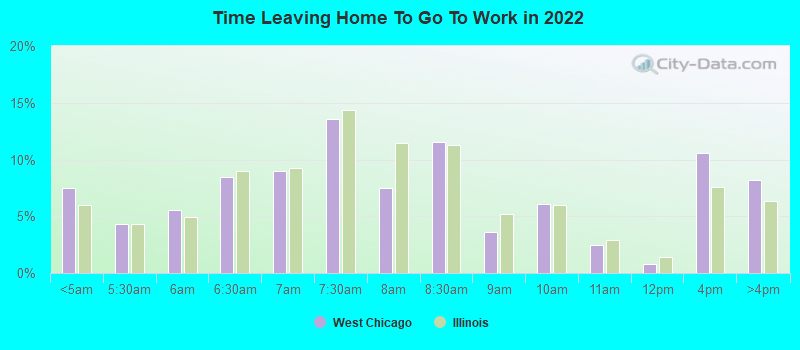
Percentage of workers working in this county: 69.7%Number of people working at home: 1,293 (10.2% of all workers )
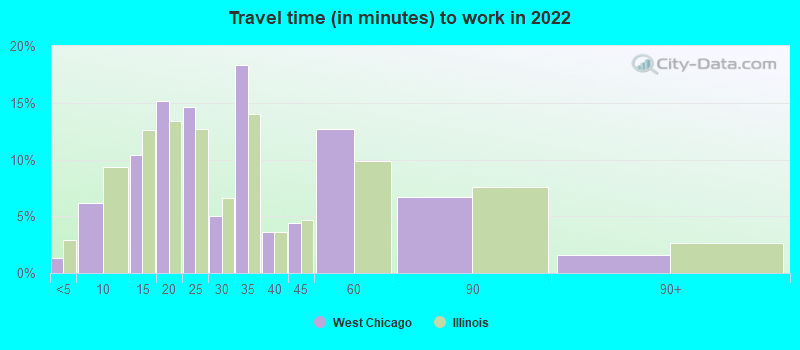
Travel time to work (commute)
Less than 5 minutes: 2195 to 9 minutes: 88110 to 14 minutes: 1,56415 to 19 minutes: 2,07820 to 24 minutes: 1,18225 to 29 minutes: 83930 to 34 minutes: 1,73035 to 39 minutes: 27940 to 44 minutes: 49145 to 59 minutes: 1,06460 to 89 minutes: 58890 or more minutes: 247
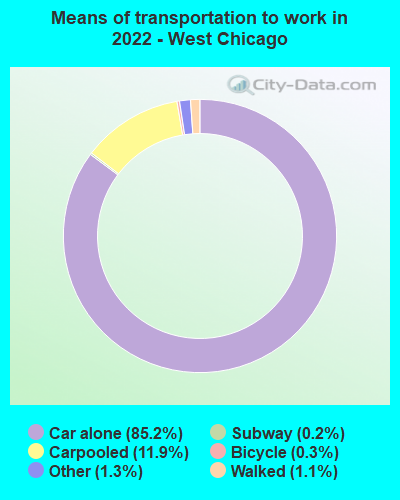
Means of transportation to work:
Drove a car alone: 10,969 (74.7%)Carpooled: 1,877 (12.8%)Bus : 5 (0.0%)Long-distance train or commuter rail : 18 (0.1%)Taxi: 195 (1.3%)Bicycle: 30 (0.2%)Walked: 137 (0.9%)Worked at home: 1,293 (8.8%)
Unemployment by race in 2022
Unemployment rate for White non-Hispanic residents 8.4% Males2.1% FemalesUnemployment rate for Black residents 33.5% Males19.1% FemalesUnemployment rate for Asian residents 2.6% Males5.6% FemalesUnemployment rate for other race residents 20.7% Males13.5% FemalesUnemployment rate for two or more race residents 11.4% Males13.0% FemalesUnemployment rate for Hispanic or Latino residents 15.4% Males6.2% Females
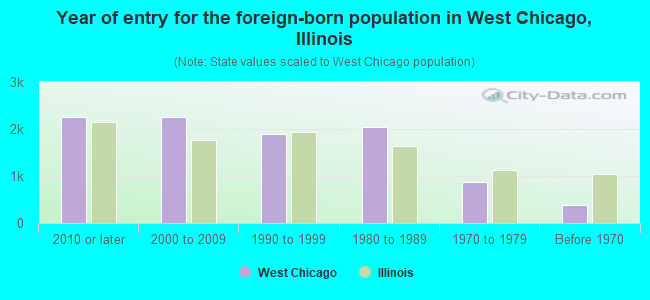
Year of entry for the foreign-born population in West Chicago, Illinois
2,249 2010 or later 2,246 2000 to 2009 1,883 1990 to 1999 2,033 1980 to 1989 863 1970 to 1979 385 Before 1970
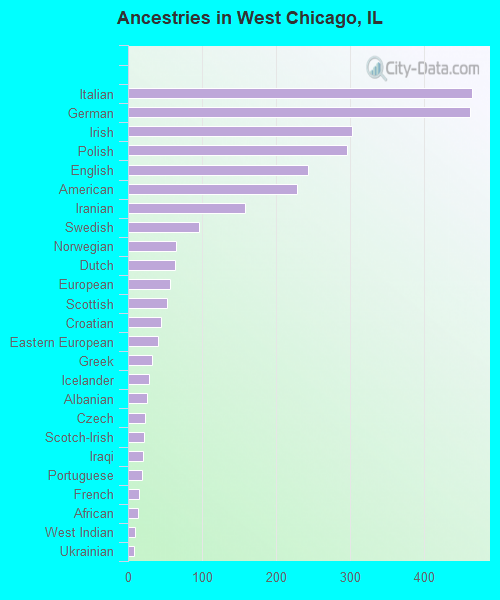
First ancestries reported:
Italian: 464 (3.2%)
German: 462 (3.2%)
Irish: 302 (2.1%)
Polish: 295 (2.0%)
English: 243 (1.7%)
American: 228 (1.6%)
Iranian: 158 (1.1%)
Swedish: 96 (0.7%)
Norwegian: 65 (0.4%)
Dutch: 64 (0.4%)
European: 57 (0.4%)
Scottish: 52 (0.4%)
Croatian: 44 (0.3%)
Eastern European: 41 (0.3%)
Greek: 33 (0.2%)
Icelander: 29 (0.2%)
Albanian: 26 (0.2%)
Czech: 23 (0.2%)
Scotch-Irish: 21 (0.1%)
Iraqi: 20 (0.1%)
Portuguese: 19 (0.1%)
French: 15 (0.1%)
African: 13 (0.09%)
West Indian: 10 (0.07%)
Ukrainian: 8 (0.05%)
Arab: 5 (0.03%)
Danish: 5 (0.03%)
New Zealander: 5 (0.03%)
South African: 5 (0.03%)
British: 1 (0.01%) Most common places of birth for foreign-born residents (%): Mexico West Chicago:
65.4% (5,579)Illinois:
34.7% (626,958)
India West Chicago:
8.7% (745)Illinois:
9.2% (166,409)
Philippines West Chicago:
5.3% (456)Illinois:
5.2% (93,003)
Iran West Chicago:
2.3% (199)Illinois:
0.4% (6,922)
Pakistan West Chicago:
2.3% (199)Illinois:
1.6% (29,519)
Colombia West Chicago:
2.0% (173)Illinois:
0.9% (16,553)
Jamaica West Chicago:
2.0% (172)Illinois:
0.5% (8,168)
Place of birth for U.S.-born residents:
This state: 13,982Other state: 2,394Northeast: 472Midwest: 860South: 694West: 335 89.6% of West Chicago residents lived in the same house 1 years ago.
Out of people who lived in different houses, 30.9% lived in this county.
Out of people who lived in different counties, 74.9% lived in Illinois.
West Chicago:
89.6%State average:
88.3%
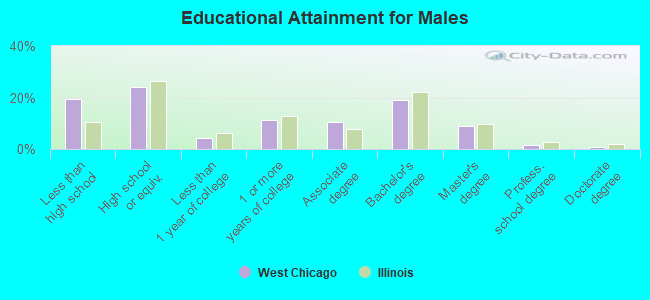
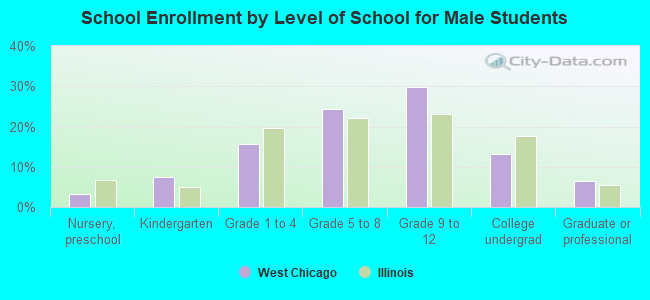
Education attainment for males 25 years and older:
No schooling: 410Nursery to 4th grade: 1065th and 6th grade: 1937th and 8th grade: 3229th grade: 4810th grade: 8211th grade: 3112th grade, no diploma: 393High school graduate (or equivalency): 1,978Less than 1 year of college: 359Some college more than 1 year, no degree: 930Associate degree: 845Bachelor's degree: 1,566Master's degree: 733Professional school degree: 132Doctorate degree: 57
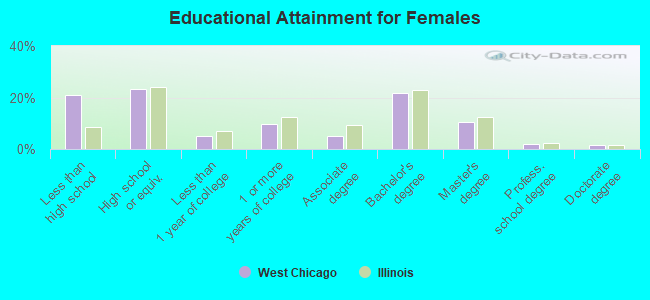
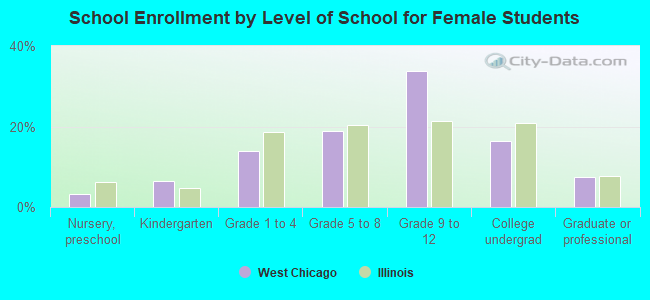
Education attainment for females 25 years and older:
No schooling: 399Nursery to 4th grade: 1985th and 6th grade: 3137th and 8th grade: 1599th grade: 13110th grade: 23411th grade: 8812th grade, no diploma: 135High school graduate (or equivalency): 1,830Less than 1 year of college: 402Some college more than 1 year, no degree: 775Associate degree: 390Bachelor's degree: 1,706Master's degree: 831Professional school degree: 155Doctorate degree: 125
Housing units in structures:
One, detached: 5,186One, attached: 556Two: 2923 or 4: 1515 to 9: 28410 to 19: 64120 to 49: 46650 or more: 188Mobile homes: 30Housing units lacking complete plumbing facilities in 2022: 0.2%Housing units lacking complete kitchen facilities in 2022: 2.0%House/condo owner moved in on average 16 years ago
Renter moved in on average 5 years ago
Private vs. public school enrollment:
Students in private schools in grades 1 to 8 (elementary and middle school): 455 Students in private schools in grades 9 to 12 (high school): 243 Students in private undergraduate colleges: 176