West Carson, CA (California) Houses and Residents
| West Carson: | $638,693 |
| California: | $715,900 |
Mean price in 2022:
Detached houses: $751,200
Here: $751,200 State: $988,808 Townhouses or other attached units: $545,420
Here: $545,420 State: $838,546 In 2-unit structures: $464,567
Here: $464,567 State: $1,138,100 In 3-to-4-unit structures: $319,273
Here: $319,273 State: $824,253 In 5-or-more-unit structures: $437,770
Here: $437,770 State: $730,996 Mobile homes: $124,883
Here: $124,883 State: $184,506
Total population: 21,699 (Urban population: 21,138, Rural population: 0)
Houses: 8,553 (8,035 occupied: 5,924 owner occupied, 2,142 renter occupied)
| % of renters here: | 27% |
| State: | 44% |
Housing density: 3,785 houses/condos per square mile
Median price asked for vacant for-sale houses and condos in 2022: $474,347.
Median contract rent in 2022: $1,697 (lower quartile is $1,113, upper quartile is over $2,000)
Median rent asked for vacant for-rent units in 2022: $2,226
Median gross rent in West Carson, CA in 2022: $1,832
Housing units in West Carson with a mortgage: 3,651 (165 second mortgage, 0 home equity loan, 123 both second mortgage and home equity loan)
Houses without a mortgage: 147
Median household income for houses/condos with a mortgage: $125,425
Median household income for apartments without a mortgage: $70,820
Median monthly housing costs: $1,742
Compare current foreclosures near West Carson, CA:
| Photo | Address | Area | Beds / Baths | Price | Details |
|---|---|---|---|---|---|

|
#1
Marina City Drive # Ph 29
Marina Del Rey, CA 90292
|
3,200 sq. feet
|
2 baths 2 beds |
show details | |

|
#2
E 60th St
Los Angeles, CA 90001
|
1,883 sq. feet
|
3 baths 5 beds |
show details | |

|
#3
Redondo Avenue, Units 5-8
Long Beach, CA 90804
|
3,360 sq. feet
|
4 baths 8 beds |
show details | |

|
#4
W 73rd St
Los Angeles, CA 90047
|
1,700 sq. feet
|
2 baths 2 beds |
show details | |

|
#5
W Arbor St # 57
Long Beach, CA 90805
|
1,585 sq. feet
|
2 baths 3 beds |
show details | |

|
#6
Norwalk Blvd Apt
Hawaiian Gardens, CA 90716
|
800 sq. feet
|
2 baths 1 beds |
show details | |

|
#7
6th Ave
Venice, CA 90291
|
3,192 sq. feet
|
3 baths 6 beds |
show details | |

|
#8
Elburg St Unit A
Paramount, CA 90723
|
1,131 sq. feet
|
2 baths 3 beds |
show details | |

|
#9
And 6111 Northside Drive
Los Angeles, CA 90022
|
1,329 sq. feet
|
4 baths 3 beds |
show details | |

|
#10
W 110th St
Inglewood, CA 90303
|
3,481 sq. feet
|
4 baths 6 beds |
show details |
| Photo | Address | Area | Beds / Baths | Price | Details |
|---|---|---|---|---|---|

|
#11
Marina City Dr Unit 116
Marina Del Rey, CA 90292
|
1,722 sq. feet
|
2 baths 3 beds |
show details | |

|
#12
Harlan Ave
Carson, CA 90746
|
1,422 sq. feet
|
2 baths 3 beds |
show details | |

|
#13
4th Ave
Los Angeles, CA 90008
|
1,392 sq. feet
|
2 baths 2 beds |
show details | |

|
#14
Molette St
Norwalk, CA 90650
|
1,082 sq. feet
|
1 baths 4 beds |
show details | |

|
#15
E 7th St
Long Beach, CA 90813
|
2,456 sq. feet
|
4 baths 6 beds |
show details | |

|
#16
Ardath Ave
Gardena, CA 90249
|
1,304 sq. feet
|
2 baths 3 beds |
show details | |

|
#17
Shoemaker Ave
Whittier, CA 90605
|
1,700 sq. feet
|
2 baths 3 beds |
show details | |

|
#18
W Paseo Del Mar
San Pedro, CA 90731
|
1,121 sq. feet
|
1 baths 2 beds |
show details | |

|
#19
Dicky St
Whittier, CA 90606
|
896 sq. feet
|
1 baths 2 beds |
show details | |

|
#20
Denker Ave
Los Angeles, CA 90062
|
1,196 sq. feet
|
1 baths 2 beds |
show details |
| Photo | Address | Area | Beds / Baths | Price | Details |
|---|---|---|---|---|---|

|
#21
8th St
Seal Beach, CA 90740
|
- sq. feet
|
3 baths 3 beds |
show details | |

|
#22
W 104th St
Inglewood, CA 90304
|
787 sq. feet
|
1 baths 2 beds |
show details | |

|
#23
Pomering Rd
Downey, CA 90241
|
1,549 sq. feet
|
2 baths 3 beds |
show details | |

|
#24
S Grand Ave
San Pedro, CA 90731
|
1,280 sq. feet
|
1 baths 2 beds |
show details | |

|
#25
Fry St
Bell Gardens, CA 90201
|
2,467 sq. feet
|
3 baths 6 beds |
show details | |

|
#26
Faust Ave
Long Beach, CA 90808
|
1,434 sq. feet
|
2 baths 3 beds |
show details | |

|
#27
E 54th St
Maywood, CA 90270
|
1,066 sq. feet
|
1 baths 2 beds |
show details | |

|
#28
Regway Ave
Long Beach, CA 90810
|
924 sq. feet
|
1 baths 2 beds |
show details | |

|
#29
N Adelon Ln
Compton, CA 90221
|
1,900 sq. feet
|
3 baths 3 beds |
show details | |

|
#30
E 113th St
Los Angeles, CA 90059
|
1,085 sq. feet
|
1 baths 3 beds |
show details |
| Photo | Address | Area | Beds / Baths | Price | Details |
|---|---|---|---|---|---|

|
#31
Frampton Ave Apt A
Harbor City, CA 90710
|
1,161 sq. feet
|
3 baths 3 beds |
show details | |

|
#32
Leapwood Ave
Carson, CA 90746
|
1,478 sq. feet
|
2 baths 4 beds |
show details | |

|
#33
S Norton Ave
Los Angeles, CA 90019
|
4,200 sq. feet
|
2 baths 5 beds |
show details | |

|
#34
Sunlight Pl
Los Angeles, CA 90016
|
1,932 sq. feet
|
2 baths 3 beds |
show details | |

|
#35
Santa Fe Ave
Lynwood, CA 90262
|
1,124 sq. feet
|
2 baths 3 beds |
show details | |

|
#36
S 5th Ave
Inglewood, CA 90305
|
1,574 sq. feet
|
2 baths 4 beds |
show details | |

|
#37
Eastwood Ave
Torrance, CA 90504
|
1,217 sq. feet
|
2 baths 2 beds |
show details | |

|
#38
W 70th St
Los Angeles, CA 90044
|
1,102 sq. feet
|
1 baths 2 beds |
show details | |

|
#39
Playa Vista Dr Apt 15
Los Angeles, CA 90094
|
1,920 sq. feet
|
3 baths 1 beds |
show details | |

|
#40
E 215th Pl
Carson, CA 90745
|
1,225 sq. feet
|
2 baths 4 beds |
show details |
| Photo | Address | Area | Beds / Baths | Price | Details |
|---|---|---|---|---|---|

|
#41
Windspun Dr
Huntington Beach, CA 92649
|
1,872 sq. feet
|
3 baths 3 beds |
show details | |

|
#42
-1626 W 11th St
Los Angeles, CA 90015
|
- sq. feet
|
1 baths 3 beds |
show details | |

|
#43
Maie Ave
Los Angeles, CA 90001
|
860 sq. feet
|
1 baths 2 beds |
show details | |

|
#44
W 25th St
Los Angeles, CA 90007
|
2,628 sq. feet
|
4 baths 4 beds |
show details | |

|
#45
S Wilmington Ave Apt A
Compton, CA 90220
|
1,137 sq. feet
|
2 baths 3 beds |
show details | |

|
#46
Hathaway Ave Unit 26
Long Beach, CA 90815
|
957 sq. feet
|
2 baths 2 beds |
show details | |

|
#47
Lees Ave
Long Beach, CA 90808
|
887 sq. feet
|
1 baths 2 beds |
show details | |

|
#48
W 29th Pl
Los Angeles, CA 90018
|
1,292 sq. feet
|
2 baths 2 beds |
show details | |

|
#49
Ibbetson Ave
Lakewood, CA 90713
|
1,044 sq. feet
|
1 baths 3 beds |
show details | |

|
Check over 1 million property listings on Foreclosure.com!
|
browse all offers | |||


 | How is West Carson for rentals? (0 replies) |
| So, where do all the white people live then? (230 replies) |
| Crooked developer pays off top LA politicians (34 replies) |
| Any neighborhoods or cities with true diversity? (35 replies) |
| top 5 hip locations in the county of LA!!! (15 replies) |
| Good areas to live near California State Dominguez Hills (4 replies) |

Median year apartment built: 1972
Household type by relationship:
Households: 21,757- Male householders: 4,295 (791 living alone), Female householders: 3,473 (811 living alone)
3,736 spouses (3,711 opposite-sex spouses), 312 unmarried partners, (312 opposite-sex unmarried partners), 5,236 children (4,975 natural, 65 adopted, 195 stepchildren), 1,013 grandchildren, 381 brothers or sisters, 642 parents, 52 foster children, 782 other relatives, 934 non-relatives
- In group quarters: 895
Size of family households: 2,766 2-persons, 1,291 3-persons, 938 4-persons, 538 5-persons, 124 6-persons, 146 7-or-more-persons.
Size of nonfamily households: 1,719 1-person, 484 2-persons, 35 3-persons, 43 4-persons.
1,592 married couples with children.
593 single-parent households (126 men, 467 women).
47.4% of residents of West Carson speak English at home.
24.6% of residents speak Spanish at home (56% speak English very well, 25% speak English well, 16% speak English not well, 3% don't speak English at all).
2.7% of residents speak other Indo-European language at home (70% speak English very well, 25% speak English well, 5% speak English not well).
26.2% of residents speak Asian or Pacific Island language at home (52% speak English very well, 30% speak English well, 15% speak English not well, 2% don't speak English at all).
0.2% of residents speak other language at home (69% speak English very well, 31% speak English well).
Foreign born population: 8,206 (37.7%)
(70.9% of them are naturalized citizens)
| Here: | 5.1 |
| State: | 6.0 |
| Here: | 4.0 |
| State: | 3.9 |

- Bedrooms in owner-occupied houses and condos in West Carson, California
- 72no bedroom
- 3691 bedroom
- 1,8322 bedrooms
- 2,4853 bedrooms
- 1,0014 bedrooms
- 1655+ bedrooms

- Bedrooms in renter-occupied apartments in West Carson, California
- 233no bedroom
- 3871 bedroom
- 8052 bedrooms
- 6243 bedrooms
- 874 bedrooms
- 65+ bedrooms

- Cars and other vehicles available in West Carson in owner-occupied houses/condos
- 257no vehicle
- 1,3021 vehicle
- 2,4182 vehicles
- 1,2153 vehicles
- 5484 vehicles
- 1845+ vehicles

- Cars and other vehicles available in West Carson in renter-occupied apartments
- 128no vehicle
- 8871 vehicle
- 6932 vehicles
- 2843 vehicles
- 784 vehicles
- 725+ vehicles

- Rooms in owner-occupied houses in West Carson, California
- 621 room
- 712 rooms
- 6963 rooms
- 1,0944 rooms
- 1,5425 rooms
- 1,2756 rooms
- 6117 rooms
- 3568 rooms
- 2179+ rooms

- Rooms in renter-occupied apartments in West Carson, California
- 2331 room
- 2352 rooms
- 2773 rooms
- 5944 rooms
- 5205 rooms
- 1436 rooms
- 1267 rooms
- 68 rooms
- 89+ rooms


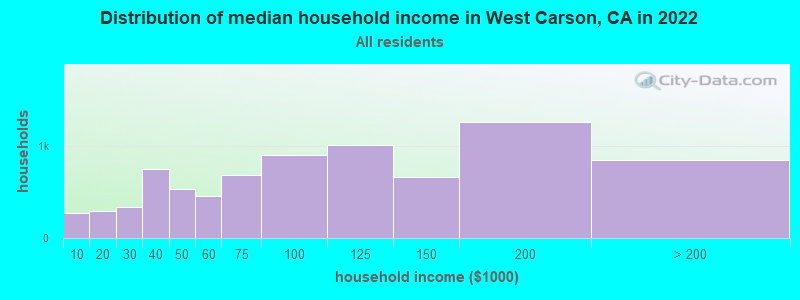
West Carson, CA household income distribution

- 272Less than $10,000
- 299$10,000 to $19,999
- 336$20,000 to $29,999
- 757$30,000 to $39,999
- 530$40,000 to $49,999
- 456$50,000 to $59,999
- 684$60,000 to $74,999
- 904$75,000 to $99,999
- 1,016$100,000 to $124,999
- 669$125,000 to $149,999
- 1,267$150,000 to $199,999
- 857$200,000 or more
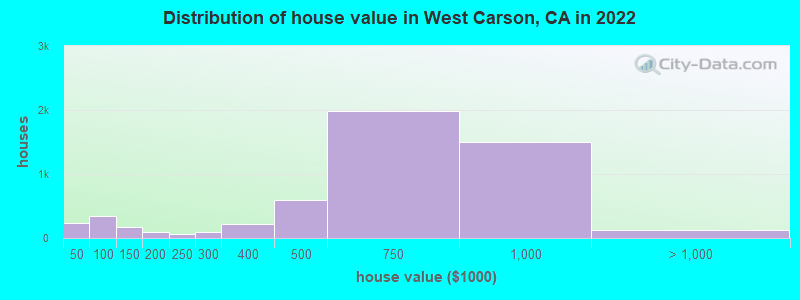
Home value of owner - occupied houses in 2022 in West Carson, CA
-
- 37Less than $10,000
- 7$10,000 to $14,999
- 15$15,000 to $19,999
- 16$20,000 to $24,999
- 22$25,000 to $29,999
- 138$30,000 to $34,999
- 48$50,000 to $59,999
- 12$60,000 to $69,999
- 92$70,000 to $79,999
- 97$80,000 to $89,999
- 99$90,000 to $99,999
- 154$100,000 to $124,999
- 18$125,000 to $149,999
- 81$150,000 to $174,999
- 11$175,000 to $199,999
- 65$200,000 to $249,999
- 88$250,000 to $299,999
- 215$300,000 to $399,999
- 598$400,000 to $499,999
- 1,981$500,000 to $749,999
- 1,496$750,000 to $999,999
- 106$1,000,000 to $1,499,999
- 15$2,000,000 or more
Rent paid by renters in 2022 in West Carson, CA
-
- 6$300 to $349
- 5$450 to $499
- 31$550 to $599
- 14$600 to $649
- 53$650 to $699
- 55$700 to $749
- 66$750 to $799
- 28$800 to $899
- 103$900 to $999
- 233$1,000 to $1,249
- 144$1,250 to $1,499
- 617$1,500 to $1,999
- 313$2,000 to $2,499
- 150$2,500 to $2,999
- 153$3,000 to $3,499
- 167No cash rent


Percentage of workers working in this county: 96.3%
Number of people working at home: 1,408 (12.8% of all workers)
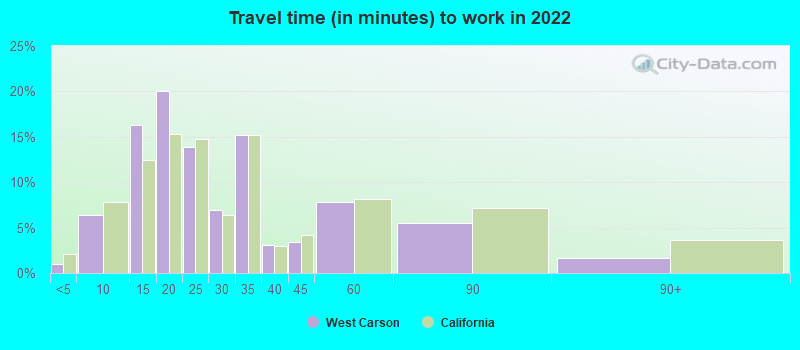
Travel time to work (commute)
- Less than 5 minutes: 72
- 5 to 9 minutes: 492
- 10 to 14 minutes: 1,230
- 15 to 19 minutes: 2,243
- 20 to 24 minutes: 1,537
- 25 to 29 minutes: 763
- 30 to 34 minutes: 1,113
- 35 to 39 minutes: 202
- 40 to 44 minutes: 402
- 45 to 59 minutes: 505
- 60 to 89 minutes: 719
- 90 or more minutes: 231
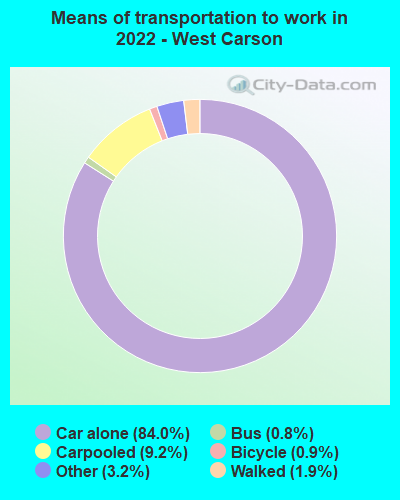
Means of transportation to work:
- Drove a car alone: 6,443 (70.2%)
- Carpooled: 777 (8.5%)
- Bus: 58 (0.6%)
- Taxi: 270 (2.9%)
- Bicycle: 69 (0.8%)
- Walked: 159 (1.7%)
- Worked at home: 1,408 (15.3%)

- Unemployment by race in 2022
- Unemployment rate for White non-Hispanic residents
- 1.0%Males
- 4.8%Females
- Unemployment rate for Black residents
- 10.7%Females
- Unemployment rate for Asian residents
- 4.1%Males
- 5.1%Females
- Unemployment rate for other race residents
- 2.6%Females
- Unemployment rate for two or more race residents
- 3.7%Males
- 8.1%Females
- Unemployment rate for Hispanic or Latino residents
- 1.3%Males
- 8.5%Females

- Year of entry for the foreign-born population in West Carson, California
- 1,2212010 or later
- 1,5912000 to 2009
- 1,6221990 to 1999
- 2,2181980 to 1989
- 1,8041970 to 1979
- 1,155Before 1970

First ancestries reported:
- Irish: 303 (1.9%)
- American: 262 (1.7%)
- German: 178 (1.1%)
- English: 162 (1.0%)
- Italian: 150 (1.0%)
- European: 109 (0.7%)
- Portuguese: 61 (0.4%)
- Iranian: 55 (0.3%)
- Norwegian: 43 (0.3%)
- Belizean: 43 (0.3%)
- Danish: 38 (0.2%)
- Trinidadian and Tobagonian: 31 (0.2%)
- Greek: 29 (0.2%)
- Russian: 21 (0.1%)
- Ghanaian: 21 (0.1%)
- African: 19 (0.1%)
- Haitian: 19 (0.1%)
- Polish: 17 (0.1%)
- Armenian: 15 (0.10%)
- French Canadian: 15 (0.10%)
- Basque: 14 (0.09%)
- Egyptian: 11 (0.07%)
- Scandinavian: 10 (0.06%)
- Yugoslavian: 10 (0.06%)
- Swiss: 8 (0.05%)
- Afghan: 6 (0.04%)
- French: 4 (0.03%)
- South African: 3 (0.02%)
- Lebanese: 2 (0.01%)
- Albanian: 1 (0.01%)
Most common places of birth for foreign-born residents (%):
| West Carson: | 30.2% (2,476) |
| California: | 7.8% (818,297) |
| West Carson: | 25.1% (2,059) |
| California: | 37.2% (3,881,193) |
| West Carson: | 14.7% (1,206) |
| California: | 3.0% (315,248) |
| West Carson: | 4.4% (357) |
| California: | 6.6% (684,672) |
| West Carson: | 3.8% (313) |
| California: | 4.9% (512,335) |
| West Carson: | 2.0% (167) |
| California: | 1.0% (103,575) |
Place of birth for U.S.-born residents:
- This state: 10,493
- Other state: 2,576
- Northeast: 483
- Midwest: 737
- South: 843
- West: 493
90.3% of West Carson residents lived in the same house 1 years ago.
Out of people who lived in different houses, 43.3% lived in this county.
Out of people who lived in different counties, 41.9% lived in California.
| West Carson: | 90.3% |
| State average: | 88.9% |
Education attainment for males 25 years and older:
- No schooling: 171
- Nursery to 4th grade: 210
- 5th and 6th grade: 148
- 7th and 8th grade: 48
- 9th grade: 50
- 10th grade: 49
- 11th grade: 181
- 12th grade, no diploma: 234
- High school graduate (or equivalency): 1,793
- Less than 1 year of college: 430
- Some college more than 1 year, no degree: 1,383
- Associate degree: 760
- Bachelor's degree: 1,970
- Master's degree: 569
- Professional school degree: 106
- Doctorate degree: 76

Education attainment for females 25 years and older:
- No schooling: 243
- Nursery to 4th grade: 39
- 5th and 6th grade: 338
- 7th and 8th grade: 83
- 9th grade: 152
- 10th grade: 92
- 11th grade: 125
- 12th grade, no diploma: 173
- High school graduate (or equivalency): 2,414
- Less than 1 year of college: 371
- Some college more than 1 year, no degree: 1,050
- Associate degree: 519
- Bachelor's degree: 2,766
- Master's degree: 637
- Professional school degree: 41
- Doctorate degree: 85


Housing units in structures:
- One, detached: 4,682
- One, attached: 808
- Two: 208
- 3 or 4: 122
- 5 to 9: 548
- 10 to 19: 251
- 20 to 49: 178
- 50 or more: 500
- Mobile homes: 1,252
Median worth of mobile homes: $119,957
Housing units lacking complete kitchen facilities in 2022: 2.9%
House/condo owner moved in on average 16 years ago
Renter moved in on average 4 years ago

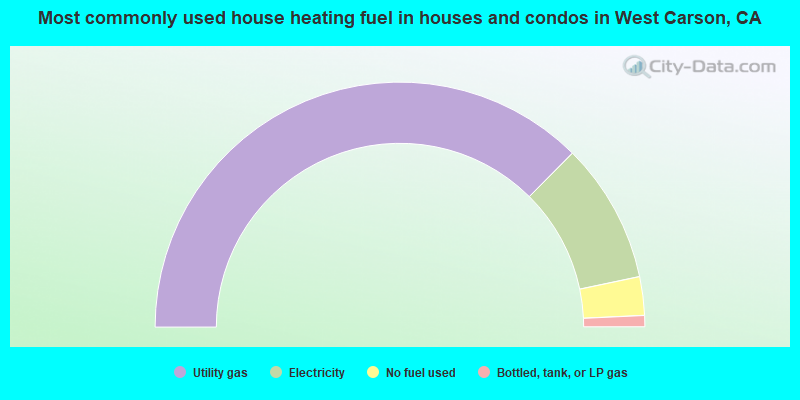
- 74.9%Utility gas
- 18.5%Electricity
- 5.1%No fuel used
- 1.5%Bottled, tank, or LP gas
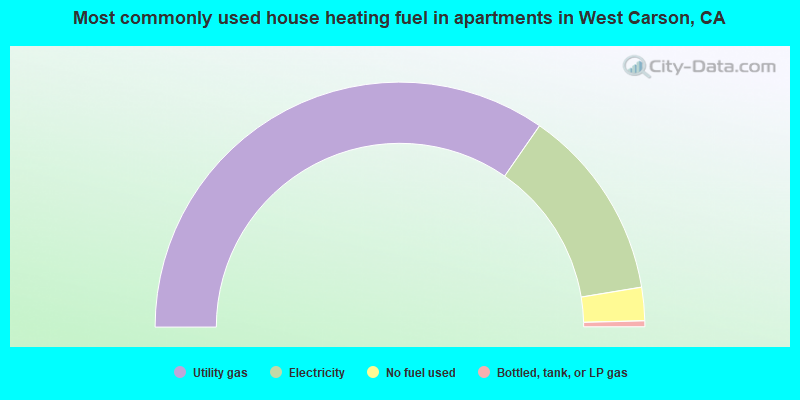
- 69.4%Utility gas
- 25.5%Electricity
- 4.4%No fuel used
- 0.8%Bottled, tank, or LP gas
Private vs. public school enrollment:
| Here: | 16.7% |
| California: | 10.5% |
| Here: | 18.4% |
| California: | 8.5% |
| Here: | 21.4% |
| California: | 15.9% |


