West Bountiful, UT (Utah) Houses and Residents
Estimated median house or condo value in 2022: $560,953 (it was $154,400 in 2000 )
West Bountiful:
$560,953Utah:
$499,500
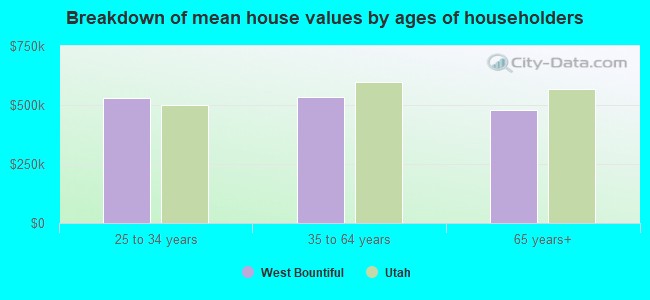
Lower value quartile - upper value quartile: $422,762 - $719,642Mean price in 2022: Detached houses: $508,325 Here:
$508,325State:
$607,750
Townhouses or other attached units: $331,615 Here:
$331,615State:
$444,505
Mobile homes: $38,614 Here:
$38,614State:
$113,475
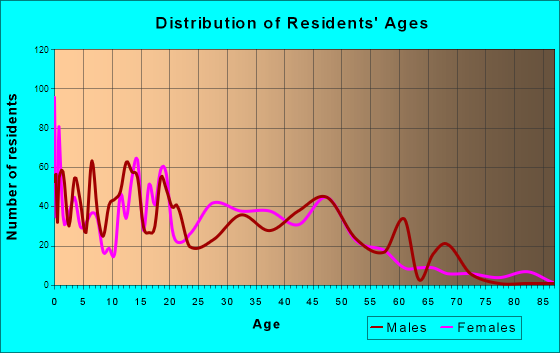
Total population: 5,446 (Urban population: 4,412, Rural population: 69 (23 farm, 46 nonfarm ))
Houses: 2,033 (1,990 occupied: 1,706 owner occupied, 269 renter occupied )
% of renters here:
14%State:
29%
Housing density: 685 houses/condos per square mile
Median price asked for vacant for-sale houses and condos in 2022 in this county: $500,085.
Median contract rent in 2022: $1,752
Median rent asked for vacant for-rent units in 2022: $1,745
Median gross rent in West Bountiful, UT in 2022: $1,763
Housing units in West Bountiful with a mortgage: 1,176 (178 second mortgage, 0 home equity loan, 206 both second mortgage and home equity loan )Houses without a mortgage: 24
Median household income for houses/condos with a mortgage: $143,618
Median household income for apartments without a mortgage: $81,765
Median monthly housing costs: $1,649
Data:
Median house or condo value ($)
Median house or condo value ($ change since 2000)
Median house or condo value ($) - White
Median house or condo value ($) - Black or African American
Median house or condo value ($) - Asian
Median house or condo value ($) - Hispanic or Latino
Median house or condo value ($) - American Indian and Alaska Native
Median house or condo value ($) - Multirace
Median house or condo value ($) - Other Race
Median price asked for mobile homes ($)
Household density (households per square mile)
Mean house or condo value by units in structure - 1, detached ($)
Mean house or condo value by units in structure - 1, attached ($)
Mean house or condo value by units in structure - 2 ($)
Mean house or condo value by units in structure by units in structure - 3 or 4 ($)
Mean house or condo value by units in structure - 5 or more ($)
Mean house or condo value by units in structure - Boat, RV, van, etc. ($)
Mean house or condo value by units in structure - Mobile home ($)
Median contract rent ($)
Median contract rent - Lower quartile ($)
Median contract rent - Upper quartile ($)
Median gross rent ($)
Urban houses (%)
Rural houses (%)
Houses occupied (%)
Houses occupied (% change since 2000)
Houses owner occupied (%)
Houses owner occupied (% change since 2000)
Houses renter occupied (%)
Houses renter occupied (% change since 2000)
Vacant housing units - For rent (%)
Vacant housing units - For rent (% change since 2000)
Vacant housing units - For sale only (%)
Vacant housing units - For sale only (% change since 2000)
Vacant housing units - Rented or sold, not occupied (%)
Vacant housing units - Rented or sold, not occupied (% change since 2000)
Vacant housing units - For seasonal, recreational, or occasional use (%)
Vacant housing units - For seasonal, recreational, or occasional use (% change since 2000)
Vacant housing units - For migrant workers (%)
Vacant housing units - For migrant workers (% change since 2000)
Vacant housing units - Other vacant (%)
Vacant housing units - Other vacant (% change since 2000)
Median monthly housing costs ($)
Median household income for houses/condos with a mortgage ($)
Median household income for houses/condos without a mortgage ($)
Median household income ($)
Median household income ($) - White
Median household income ($) - Black or African American
Median household income ($) - Asian
Median household income ($) - Hispanic or Latino
Median household income ($) - American Indian and Alaska Native
Median household income ($) - Multirace
Median household income ($) - Other Race
Mortgage status - with mortgage (%)
Mortgage status - with second mortgage (%)
Mortgage status - with home equity loan (%)
Mortgage status - with both second mortgage and home equity loan (%)
Mortgage status - without a mortgage (%)
Median year house/condo built
Median year apartment built
Household type by relationship - Male householder living alone (%)
Household type by relationship - Male householder not living alone (%)
Household type by relationship - Female householder living alone (%)
Household type by relationship - Female householder not living alone (%)
Household type by relationship - Opposite-Sex spouse (%)
Household type by relationship - Same-Sex spouse (%)
Household type by relationship - Opposite-Sex unmarried partner (%)
Household type by relationship - Same-Sex unmarried partner (%)
Household type by relationship - In group quarters (%)
Size of family households - 2-person household (%)
Size of family households - 3-person household (%)
Size of family households - 4-person household (%)
Size of family households - 5-person household (%)
Size of family households - 6-person household (%)
Size of family households - 7-or-more-person household (%)
Size of nonfamily households - 1-person household (%)
Size of nonfamily households - 2-person household (%)
Size of nonfamily households - 3-person household (%)
Size of nonfamily households - 4-person household (%)
Size of nonfamily households - 5-person household (%)
Size of nonfamily households - 6-person household (%)
Size of nonfamily households - 7-or-moreperson household (%)
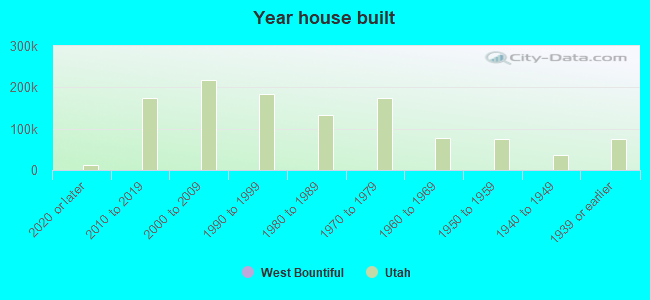
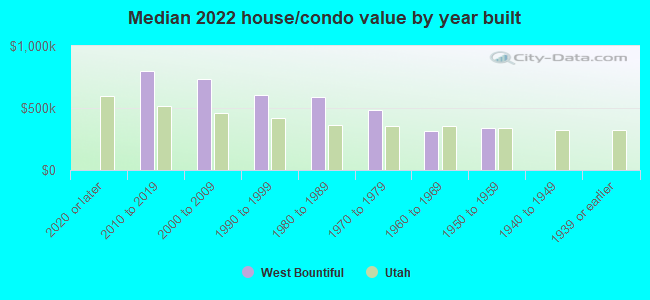
Year house built - Built 2010 or later (%)
Year house built - Built 2000 to 2009 (%)
Year house built - Built 1990 to 1999 (%)
Year house built - Built 1980 to 1989 (%)
Year house built - Built 1970 to 1979 (%)
Year house built - Built 1960 to 1969 (%)
Year house built - Built 1950 to 1959 (%)
Year house built - Built 1940 to 1949 (%)
Year house built - Built 1939 or earlier (%)
Median number of rooms in houses and condos
Median number of rooms in apartments
Median number of bedrooms in owner occupied houses
Mean number of bedrooms in owner occupied houses
Median number of bedrooms in renter occupied houses
Mean number of bedrooms in renter occupied houses
Median number of vehichles in owner occupied houses
Mean number of vehichles in owner occupied houses
Median number of vehichles in renter occupied houses
Mean number of vehichles in renter occupied houses
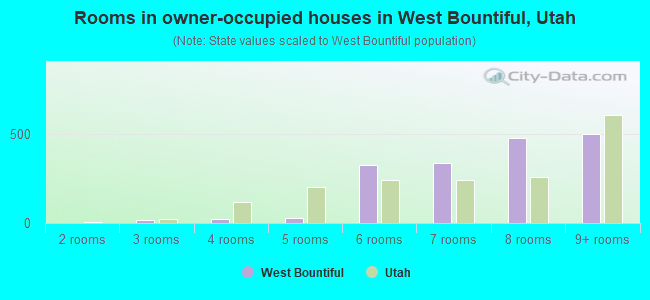
Rooms in owner-occupied houses - 1 room (%)
Rooms in owner-occupied houses - 2 rooms (%)
Rooms in owner-occupied houses - 3 rooms (%)
Rooms in owner-occupied houses - 4 rooms (%)
Rooms in owner-occupied houses - 5 rooms (%)
Rooms in owner-occupied houses - 6 rooms (%)
Rooms in owner-occupied houses - 7 rooms (%)
Rooms in owner-occupied houses - 8 rooms (%)
Rooms in owner-occupied houses - 9+ rooms (%)
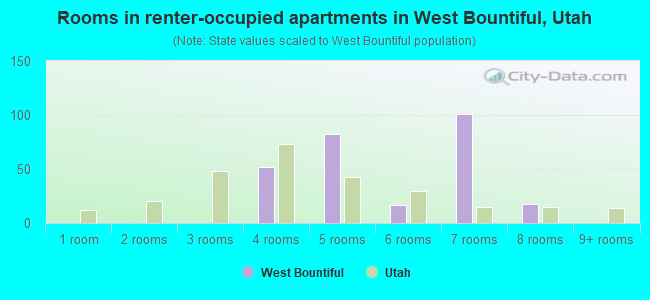
Rooms in renter-occupied houses - 1 room (%)
Rooms in renter-occupied houses - 2 rooms (%)
Rooms in renter-occupied houses - 3 rooms (%)
Rooms in renter-occupied houses - 4 rooms (%)
Rooms in renter-occupied houses - 5 rooms (%)
Rooms in renter-occupied houses - 6 rooms (%)
Rooms in renter-occupied houses - 7 rooms (%)
Rooms in renter-occupied houses - 8 rooms (%)
Rooms in renter-occupied houses - 9+ rooms (%)
Bedrooms in owner-occupied houses - no bedrooms (%)
Bedrooms in owner-occupied houses - 1 bedroom (%)
Bedrooms in owner-occupied houses - 2 bedrooms (%)
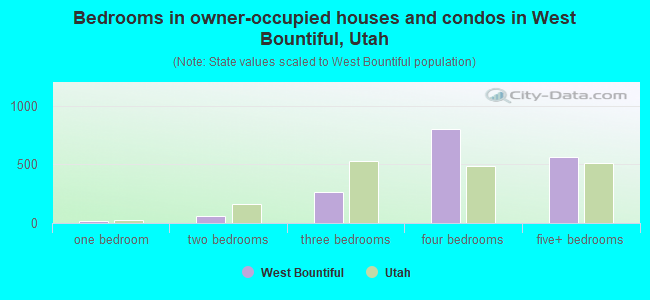
Bedrooms in owner-occupied houses - 3 bedrooms (%)
Bedrooms in owner-occupied houses - 4 bedrooms (%)
Bedrooms in owner-occupied houses - 5+ bedrooms (%)
Bedrooms in renter-occupied houses - no bedrooms (%)
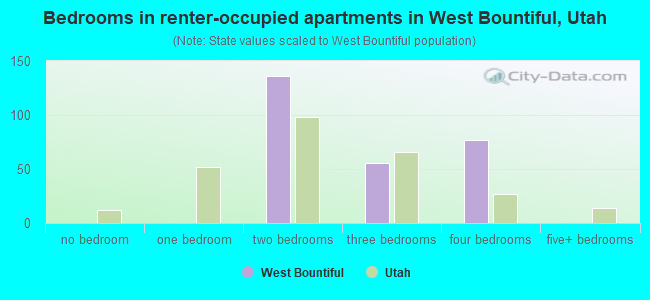
Bedrooms in renter-occupied houses - 1 bedroom (%)
Bedrooms in renter-occupied houses - 2 bedrooms (%)
Bedrooms in renter-occupied houses - 3 bedrooms (%)
Bedrooms in renter-occupied houses - 4 bedrooms (%)
Bedrooms in renter-occupied houses - 5+ bedrooms (%)
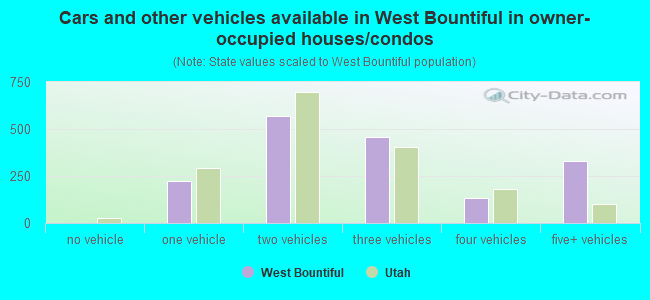
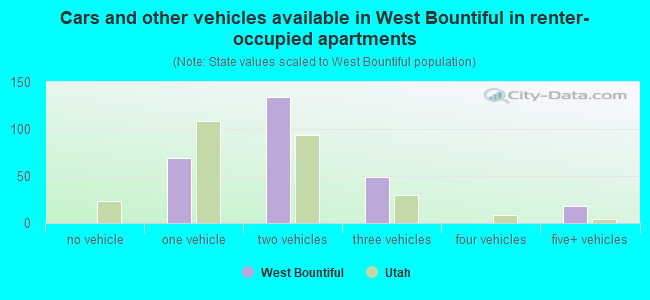
Vehicles available in owner-occupied houses - no vehicle available (%)
Vehicles available in owner-occupied houses - 1 vehicle available(%)
Vehicles available in owner-occupied houses - 2 Vehicles available (%)
Vehicles available in owner-occupied houses - 3 Vehicles available (%)
Vehicles available in owner-occupied houses - 4 Vehicles available (%)
Vehicles available in owner-occupied houses - 5+ Vehicles available (%)
Vehicles available in renter-occupied houses - no vehicle available (%)
Vehicles available in renter-occupied houses - 1 vehicle available (%)
Vehicles available in renter-occupied houses - 2 Vehicles available (%)
Vehicles available in renter-occupied houses - 3 Vehicles available (%)
Vehicles available in renter-occupied houses - 4 Vehicles available (%)
Vehicles available in renter-occupied houses - 5+ Vehicles available (%)
Housing units in structures - 1, detached (%)
Housing units in structures - 1, attached (%)
Housing units in structures - 2 (%)
Housing units in structures - 3 or 4 (%)
Housing units in structures - 5 to 9 (%)
Housing units in structures - 10 to 19 (%)
Housing units in structures - 20 to 49 (%)
Housing units in structures - 50 or more (%)
Housing units in structures - Mobile home (%)
Housing units in structures - Boat, RV, van, etc. (%)
Housing units in structures - Owners - 1, detached (%)
Housing units in structures - Owners - 1, attached (%)
Housing units in structures - Owners - 2 (%)
Housing units in structures - Owners - 3 or 4 (%)
Housing units in structures - Owners - 5 to 9 (%)
Housing units in structures - Owners - 10 to 19 (%)
Housing units in structures - Owners - 20 to 49 (%)
Housing units in structures - Owners - 50 or more (%)
Housing units in structures - Owners - Mobile home (%)
Housing units in structures - Owners - Boat, RV, van, etc. (%)
Housing units in structures - Renters - 1, detached (%)
Housing units in structures - Renters - 1, attached (%)
Housing units in structures - Renters - 2 (%)
Housing units in structures - Renters - 3 or 4 (%)
Housing units in structures - Renters - 5 to 9 (%)
Housing units in structures - Renters - 10 to 19 (%)
Housing units in structures - Renters - 20 to 49 (%)
Housing units in structures - Renters - 50 or more (%)
Housing units in structures - Renters - Mobile home (%)
Housing units in structures - Renters - Boat, RV, van, etc. (%)
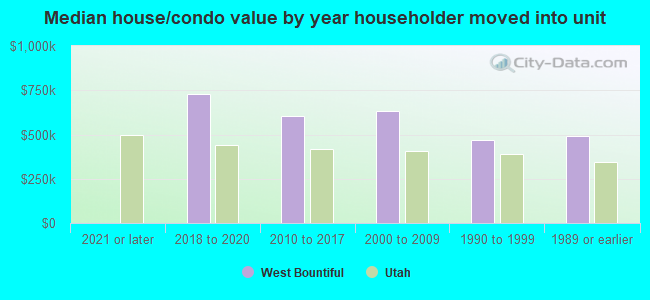
House/condo owner moved in on average (years ago)
Renter moved in on average (years ago)
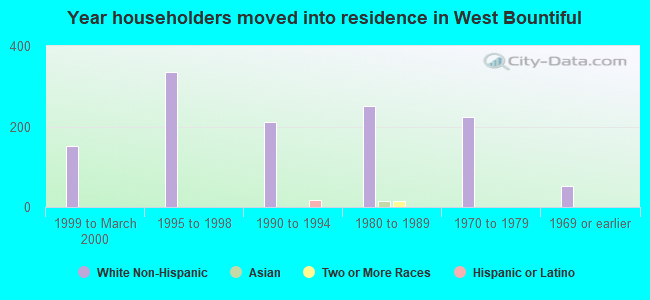
Year householder moved into unit - Moved in 1999 to March 2000 (%)
Year householder moved into unit - Moved in 1999 to March 2000 (%) - White
Year householder moved into unit - Moved in 1999 to March 2000 (%) - Black or African American
Year householder moved into unit - Moved in 1999 to March 2000 (%) - Asian
Year householder moved into unit - Moved in 1999 to March 2000 (%) - Hispanic or Latino
Year householder moved into unit - Moved in 1999 to March 2000 (%) - American Indian and Alaska Native
Year householder moved into unit - Moved in 1999 to March 2000 (%) - Multirace
Year householder moved into unit - Moved in 1999 to March 2000 (%) - Other Race
Year householder moved into unit - Moved in 1995 to 1998 (%)
Year householder moved into unit - Moved in 1995 to 1998 (%) - White
Year householder moved into unit - Moved in 1995 to 1998 (%) - Black or African American
Year householder moved into unit - Moved in 1995 to 1998 (%) - Asian
Year householder moved into unit - Moved in 1995 to 1998 (%) - Hispanic or Latino
Year householder moved into unit - Moved in 1995 to 1998 (%) - American Indian and Alaska Native
Year householder moved into unit - Moved in 1995 to 1998 (%) - Multirace
Year householder moved into unit - Moved in 1995 to 1998 (%) - Other Race
Year householder moved into unit - Moved in 1990 to 1994 (%)
Year householder moved into unit - Moved in 1990 to 1994 (%) - White
Year householder moved into unit - Moved in 1990 to 1994 (%) - Black or African American
Year householder moved into unit - Moved in 1990 to 1994 (%) - Asian
Year householder moved into unit - Moved in 1990 to 1994 (%) - Hispanic or Latino
Year householder moved into unit - Moved in 1990 to 1994 (%) - American Indian and Alaska Native
Year householder moved into unit - Moved in 1990 to 1994 (%) - Multirace
Year householder moved into unit - Moved in 1990 to 1994 (%) - Other Race
Year householder moved into unit - Moved in 1980 to 1989 (%)
Year householder moved into unit - Moved in 1980 to 1989 (%) - White
Year householder moved into unit - Moved in 1980 to 1989 (%) - Black or African American
Year householder moved into unit - Moved in 1980 to 1989 (%) - Asian
Year householder moved into unit - Moved in 1980 to 1989 (%) - Hispanic or Latino
Year householder moved into unit - Moved in 1980 to 1989 (%) - American Indian and Alaska Native
Year householder moved into unit - Moved in 1980 to 1989 (%) - Multirace
Year householder moved into unit - Moved in 1980 to 1989 (%) - Other Race
Year householder moved into unit - Moved in 1970 to 1979 (%)
Year householder moved into unit - Moved in 1970 to 1979 (%) - White
Year householder moved into unit - Moved in 1970 to 1979 (%) - Black or African American
Year householder moved into unit - Moved in 1970 to 1979 (%) - Asian
Year householder moved into unit - Moved in 1970 to 1979 (%) - Hispanic or Latino
Year householder moved into unit - Moved in 1970 to 1979 (%) - American Indian and Alaska Native
Year householder moved into unit - Moved in 1970 to 1979 (%) - Multirace
Year householder moved into unit - Moved in 1970 to 1979 (%) - Other Race
Year householder moved into unit - Moved in 1969 or earlier (%)
Year householder moved into unit - Moved in 1969 or earlier (%) - White
Year householder moved into unit - Moved in 1969 or earlier (%) - Black or African American
Year householder moved into unit - Moved in 1969 or earlier (%) - Asian
Year householder moved into unit - Moved in 1969 or earlier (%) - Hispanic or Latino
Year householder moved into unit - Moved in 1969 or earlier (%) - American Indian and Alaska Native
Year householder moved into unit - Moved in 1969 or earlier (%) - Multirace
Year householder moved into unit - Moved in 1969 or earlier (%) - Other Race
Housing units lacking complete plumbing facilities (%)
Housing units lacking complete kitchen facilities (%)
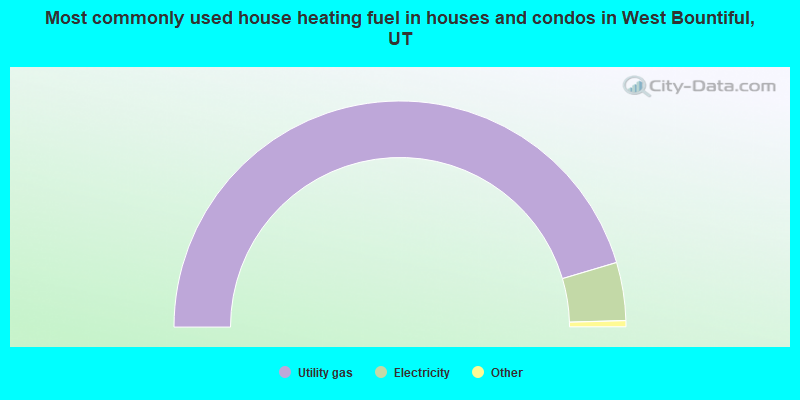
House heating fuel used in houses and condos - Utility gas (%)
House heating fuel used in houses and condos - Bottled, tank, or LP gas (%)
House heating fuel used in houses and condos - Electricity (%)
House heating fuel used in houses and condos - Fuel oil, kerosene, etc. (%)
House heating fuel used in houses and condos - Coal or coke (%)
House heating fuel used in houses and condos - Wood (%)
House heating fuel used in houses and condos - Solar energy (%)
House heating fuel used in houses and condos - Other fuel (%)
House heating fuel used in houses and condos - No fuel used (%)
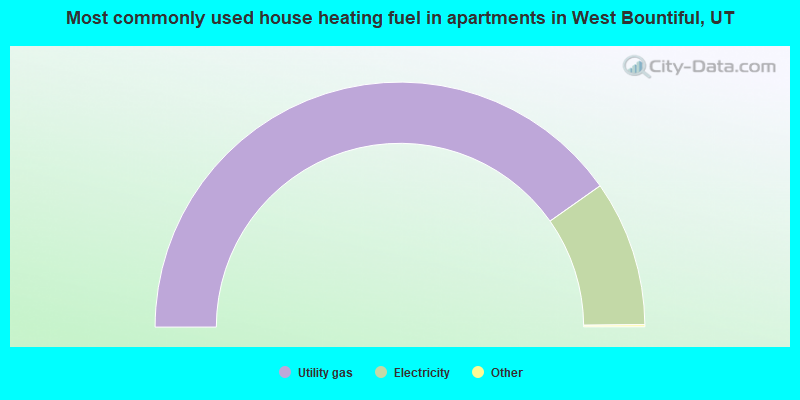
House heating fuel used in apartments - Utility gas (%)
House heating fuel used in apartments - Bottled, tank, or LP gas (%)
House heating fuel used in apartments - Electricity (%)
House heating fuel used in apartments - Fuel oil, kerosene, etc. (%)
House heating fuel used in apartments - Coal or coke (%)
House heating fuel used in apartments - Wood (%)
House heating fuel used in apartments - Solar energy (%)
House heating fuel used in apartments - Other fuel (%)
House heating fuel used in apartments - No fuel used (%)
Median year house/condo built: 1982Median year apartment built: 1977Household type by relationship:
Households: 6,017
Male householders: 953 (112 living alone ), Female householders: 981 (135 living alone )1,381 spouses (1,366 opposite-sex spouses ), 30 unmarried partners , (30 opposite-sex unmarried partners ), 1,922 children (1,882 natural , 22 adopted , 18 stepchildren ), 105 grandchildren , 209 brothers or sisters , 174 parents , 0 foster children , 210 other relatives , 45 non-relatives
Size of family households: 610 2-persons , 442 3-persons , 354 4-persons , 168 5-persons , 80 6-persons , 67 7-or-more-persons .
Size of nonfamily households: 234 1-person , 28 2-persons .
1,267 married couples with children. single-parent households (0 men , 140 women ).
89.2% of residents of West Bountiful speak English at home. of residents speak Spanish at home (75% speak English very well , 21% speak English well , 4% speak English not well ).of residents speak other Indo-European language at home (100% speak English very well ).of residents speak Asian or Pacific Island language at home (100% speak English very well ).
Foreign born population: 373 (6.2%)of them are naturalized citizens )
Median number of rooms in houses and condos:
Median number of rooms in apartments
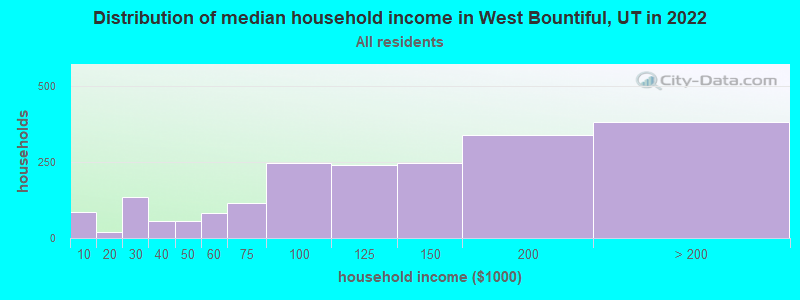
West Bountiful, UT household income distribution 84 Less than $10,00020 $10,000 to $19,999135 $20,000 to $29,99957 $30,000 to $39,99955 $40,000 to $49,99981 $50,000 to $59,999115 $60,000 to $74,999247 $75,000 to $99,999241 $100,000 to $124,999248 $125,000 to $149,999340 $150,000 to $199,999382 $200,000 or more
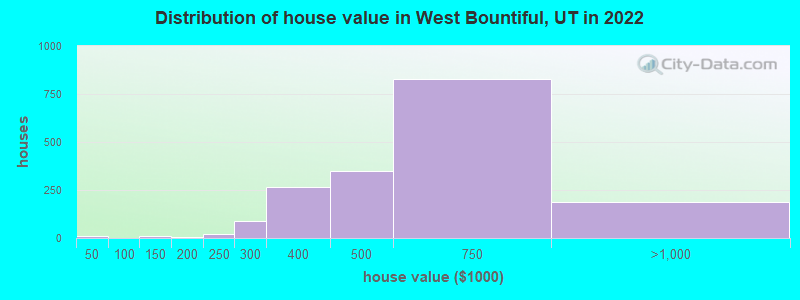
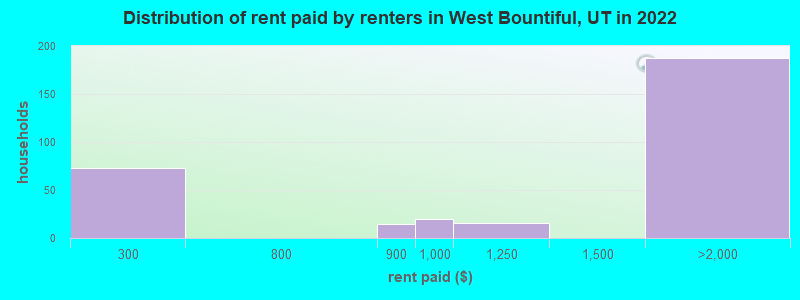
Home value of owner - occupied houses in 2022 in West Bountiful, UT 9 $10,000 to $14,9999 $100,000 to $124,9995 $150,000 to $174,99918 $200,000 to $249,99990 $250,000 to $299,999265 $300,000 to $399,999349 $400,000 to $499,999827 $500,000 to $749,999186 $750,000 to $999,999Rent paid by renters in 2022 in West Bountiful, UT 73 $200 to $24914 $800 to $89920 $900 to $99916 $1,000 to $1,249186 $1,500 to $1,999
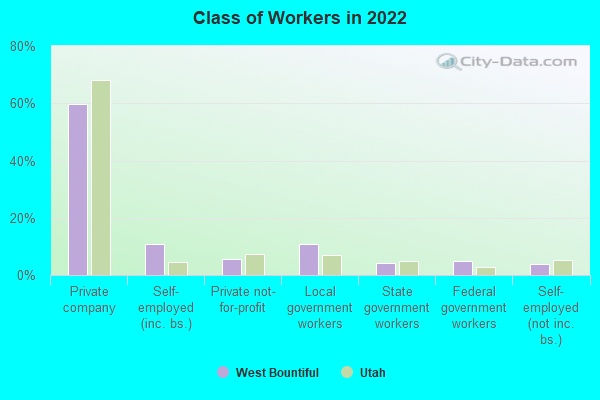
Percentage of workers working in this county: 64.3%Number of people working at home: 796 (28.0% of all workers )
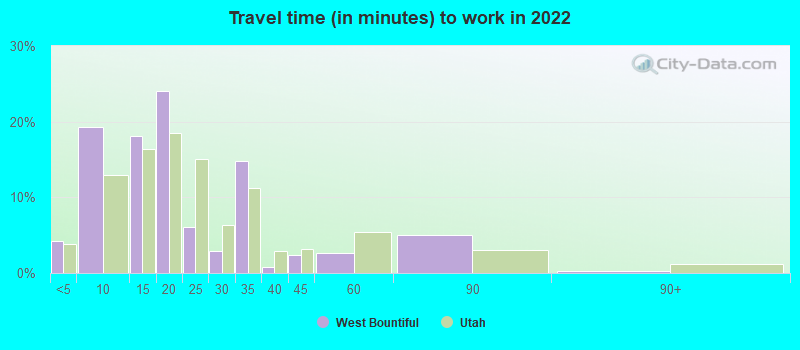
Travel time to work (commute)
Less than 5 minutes: 995 to 9 minutes: 28110 to 14 minutes: 37015 to 19 minutes: 26120 to 24 minutes: 37425 to 29 minutes: 23630 to 34 minutes: 15435 to 39 minutes: 6940 to 44 minutes: 8145 to 59 minutes: 4560 to 89 minutes: 6190 or more minutes: 37
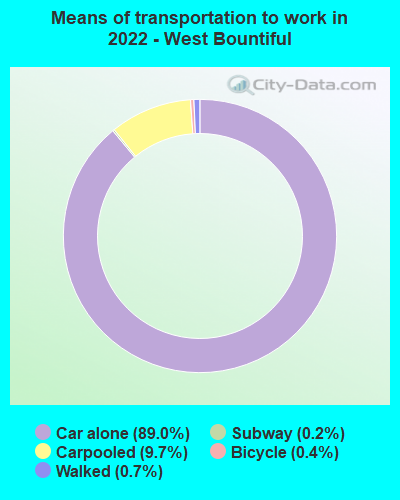
Means of transportation to work:
Drove a car alone: 1,632 (62.1%)Carpooled: 224 (8.5%)Long-distance train or commuter rail : 4 (0.2%)Bicycle: 8 (0.3%)Walked: 12 (0.5%)Worked at home: 796 (30.3%)
Unemployment by race in 2022
Unemployment rate for White non-Hispanic residents 0.7% Males2.4% Females
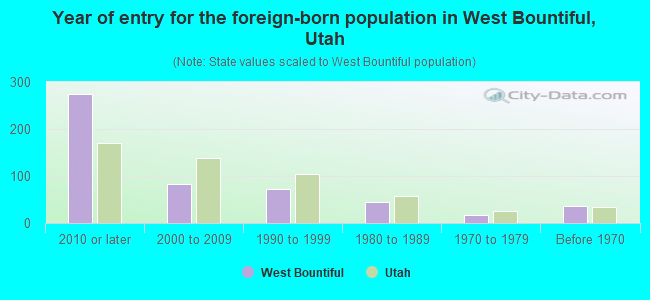
Year of entry for the foreign-born population in West Bountiful, Utah
275 2010 or later 84 2000 to 2009 73 1990 to 1999 45 1980 to 1989 16 1970 to 1979 37 Before 1970
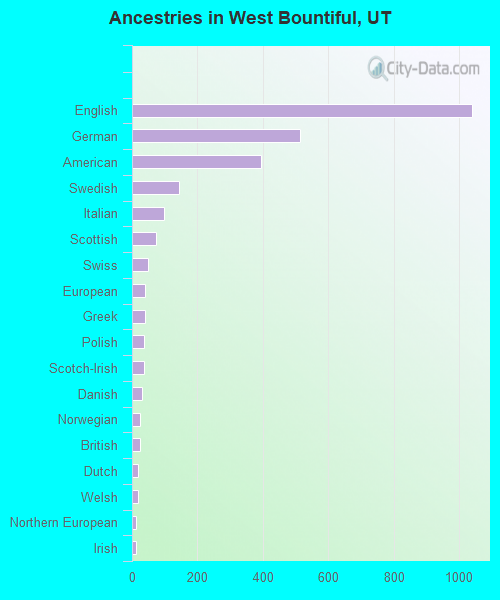
First ancestries reported:
English: 1,040 (30.6%)
German: 515 (15.1%)
American: 395 (11.6%)
Swedish: 145 (4.3%)
Italian: 97 (2.9%)
Scottish: 74 (2.2%)
Swiss: 48 (1.4%)
European: 40 (1.2%)
Greek: 40 (1.2%)
Polish: 38 (1.1%)
Scotch-Irish: 38 (1.1%)
Danish: 32 (0.9%)
Norwegian: 24 (0.7%)
British: 23 (0.7%)
Dutch: 19 (0.6%)
Welsh: 17 (0.5%)
Northern European: 13 (0.4%)
Irish: 12 (0.4%) Most common places of birth for foreign-born residents (%): Colombia West Bountiful:
41.0% (197)Utah:
2.0% (5,555)
Oceania, n.e.c. West Bountiful:
39.9% (192)Utah:
2.7% (7,472)
El Salvador West Bountiful:
4.8% (23)Utah:
2.6% (7,062)
Other Caribbean West Bountiful:
4.0% (19)Utah:
0.0% (44)
Switzerland West Bountiful:
2.9% (14)Utah:
0.1% (373)
Germany West Bountiful:
2.9% (14)Utah:
1.5% (4,247)
Mexico West Bountiful:
2.9% (14)Utah:
36.1% (99,740)
Place of birth for U.S.-born residents:
This state: 4,216Other state: 1,353Northeast: 25Midwest: 182South: 100West: 1,083 95.9% of West Bountiful residents lived in the same house 1 years ago.
Out of people who lived in different houses, 45.5% lived in this county.
Out of people who lived in different counties, 72.1% lived in Utah.
West Bountiful:
95.9%State average:
85.7%
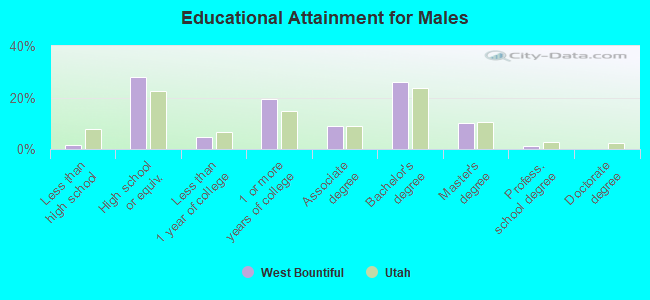
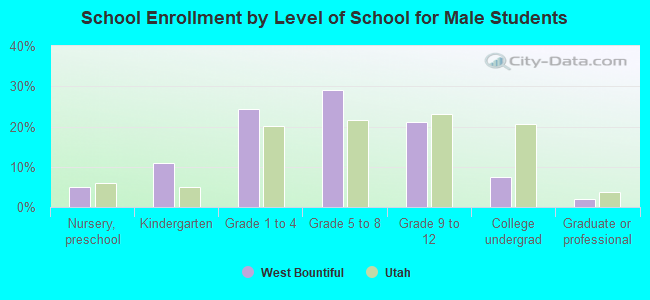
Education attainment for males 25 years and older:
No schooling: 0Nursery to 4th grade: 05th and 6th grade: 07th and 8th grade: 09th grade: 010th grade: 911th grade: 012th grade, no diploma: 27High school graduate (or equivalency): 587Less than 1 year of college: 97Some college more than 1 year, no degree: 412Associate degree: 185Bachelor's degree: 552Master's degree: 210Professional school degree: 28Doctorate degree: 0
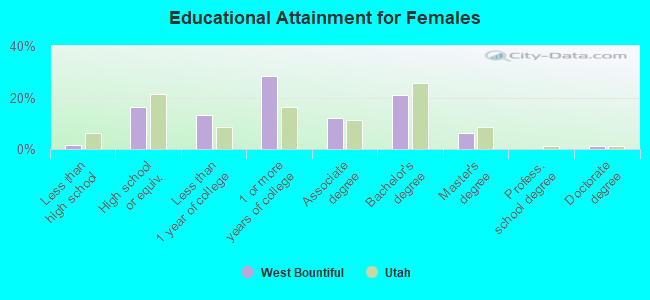
Education attainment for females 25 years and older:
No schooling: 0Nursery to 4th grade: 05th and 6th grade: 07th and 8th grade: 09th grade: 510th grade: 1611th grade: 012th grade, no diploma: 11High school graduate (or equivalency): 326Less than 1 year of college: 269Some college more than 1 year, no degree: 568Associate degree: 240Bachelor's degree: 419Master's degree: 128Professional school degree: 0Doctorate degree: 27
Housing units in structures:
One, detached: 1,913One, attached: 53Mobile homes: 67House/condo owner moved in on average 14 years ago
Renter moved in on average 7 years ago
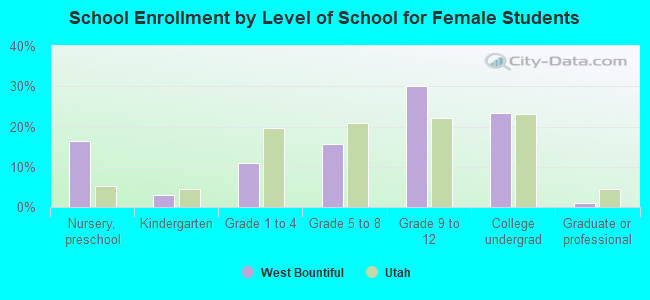
Private vs. public school enrollment:
Students in private schools in grades 1 to 8 (elementary and middle school): 143 Students in private schools in grades 9 to 12 (high school): 6 Students in private undergraduate colleges: 81