Waynetown, IN (Indiana) Houses and Residents
| Waynetown: | $117,195 |
| Indiana: | $208,700 |
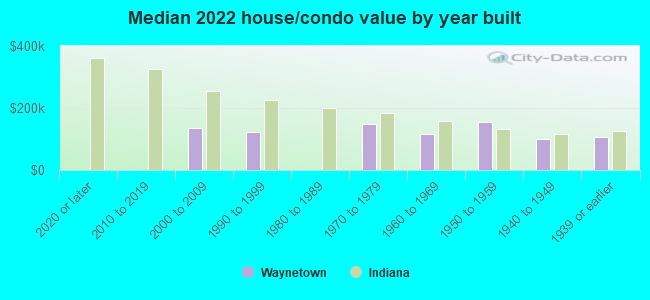
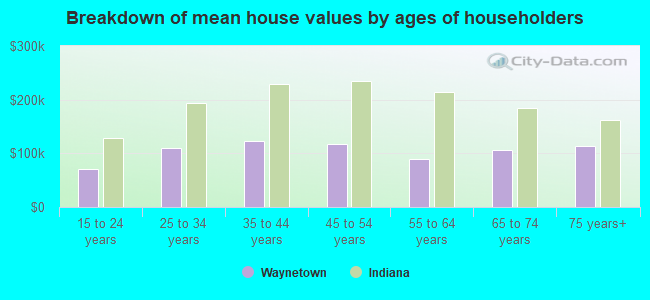
Mean price in 2022:
Detached houses: $126,119
Here: $126,119 State: $257,916 Mobile homes: $12,970
Here: $12,970 State: $67,116
Total population: 954 (Urban population: 0, Rural population: 911 (all nonfarm))
Houses: 372 (314 occupied: 269 owner occupied, 49 renter occupied)
| % of renters here: | 15% |
| State: | 29% |
Housing density: 854 houses/condos per square mile
Median price asked for vacant for-sale houses and condos in 2022: $39,182.
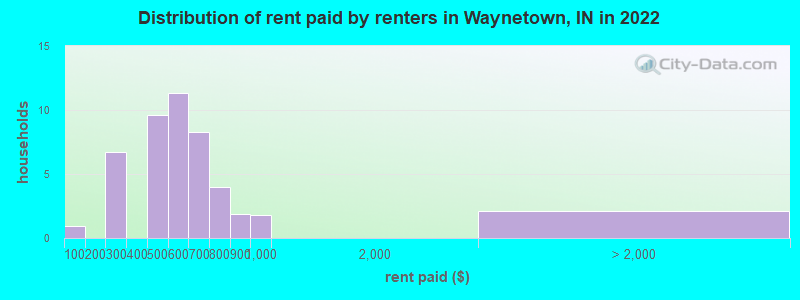
Median contract rent in 2022: $524 (lower quartile is $415, upper quartile is $705)
Median rent asked for vacant for-rent units in 2022: $279
Median gross rent in Waynetown, IN in 2022: $815
Housing units in Waynetown with a mortgage: 158 (18 second mortgage, 0 home equity loan, 18 both second mortgage and home equity loan)
Houses without a mortgage: 0
Median household income for houses/condos with a mortgage: $62,989
Median household income for apartments without a mortgage: $43,650
Median monthly housing costs: $764
Compare current foreclosures near Waynetown, IN:
| Photo | Address | Area | Beds / Baths | Price | Details |
|---|---|---|---|---|---|

|
#1
W Garfield St
Waynetown, IN 47990
|
2,282 sq. feet
|
2 baths 4 beds |
show details | |

|
#2
W 100 N
Waynetown, IN 47990
|
- sq. feet
|
- baths - beds |
show details | |

|
#3
W Wabash Ave
Crawfordsville, IN 47933
|
1,792 sq. feet
|
1 baths 3 beds |
show details | |

|
#4
S Perry St
Attica, IN 47918
|
2,328 sq. feet
|
2 baths 3 beds |
show details | |

|
#5
E 300 S
Crawfordsville, IN 47933
|
1,624 sq. feet
|
1 baths 3 beds |
show details | |

|
#6
E Jackson St
Attica, IN 47918
|
2,448 sq. feet
|
2 baths 4 beds |
show details | |

|
#7
N Mt Zion Ct
Crawfordsville, IN 47933
|
1,463 sq. feet
|
1 baths 3 beds |
show details | |

|
#8
E Chestnut St
Crawfordsville, IN 47933
|
1,344 sq. feet
|
1 baths 3 beds |
show details | |

|
#9
E Us Highway 136
Crawfordsville, IN 47933
|
1,711 sq. feet
|
1 baths 3 beds |
show details | |

|
#10
E Ladoga Rd
Crawfordsville, IN 47933
|
1,600 sq. feet
|
1 baths 2 beds |
show details |
| Photo | Address | Area | Beds / Baths | Price | Details |
|---|---|---|---|---|---|

|
#11
W Washington St
Waveland, IN 47989
|
1,564 sq. feet
|
1 baths 3 beds |
show details | |

|
#12
Evergreen Blvd
Linden, IN 47955
|
1,278 sq. feet
|
2 baths 3 beds |
show details | |

|
#13
Delaware St
Crawfordsville, IN 47933
|
936 sq. feet
|
1 baths 3 beds |
show details | |

|
#14
E College St
Crawfordsville, IN 47933
|
1,132 sq. feet
|
1 baths 3 beds |
show details | |

|
#15
Athens St
Crawfordsville, IN 47933
|
912 sq. feet
|
1 baths 3 beds |
show details | |

|
#16
W Country Club Rd
Crawfordsville, IN 47933
|
2,016 sq. feet
|
2 baths 4 beds |
show details | |

|
#17
W Shore Dr
Crawfordsville, IN 47933
|
1,920 sq. feet
|
1 baths 3 beds |
show details | |

|
#18
Tuttle Ave
Crawfordsville, IN 47933
|
1,084 sq. feet
|
1 baths 2 beds |
show details | |

|
#19
Cottage Ave
Crawfordsville, IN 47933
|
768 sq. feet
|
1 baths 2 beds |
show details | |

|
#20
E Jefferson St
Crawfordsville, IN 47933
|
1,800 sq. feet
|
1 baths 3 beds |
show details |
| Photo | Address | Area | Beds / Baths | Price | Details |
|---|---|---|---|---|---|

|
#21
Parke Ave
Crawfordsville, IN 47933
|
1,308 sq. feet
|
1 baths 3 beds |
show details | |

|
#22
N Englewood Dr
Crawfordsville, IN 47933
|
1,058 sq. feet
|
1 baths 3 beds |
show details | |

|
#23
E Elmore St
Crawfordsville, IN 47933
|
924 sq. feet
|
1 baths 2 beds |
show details | |

|
#24
W Main St
Crawfordsville, IN 47933
|
708 sq. feet
|
1 baths 2 beds |
show details | |

|
#25
S Wabash St
New Richmond, IN 47967
|
1,275 sq. feet
|
1 baths 3 beds |
show details | |

|
#26
S Barr St
Crawfordsville, IN 47933
|
1,198 sq. feet
|
1 baths 2 beds |
show details | |

|
#27
N Grant Ave
Crawfordsville, IN 47933
|
1,044 sq. feet
|
2 baths 2 beds |
show details | |

|
#28
S Barr St
Crawfordsville, IN 47933
|
1,344 sq. feet
|
1 baths 4 beds |
show details | |

|
#29
S Maudlin Rd
Hillsboro, IN 47949
|
1,368 sq. feet
|
1 baths - beds |
show details | |

|
#30
W State St
Veedersburg, IN 47987
|
1,841 sq. feet
|
1 baths - beds |
show details |
| Photo | Address | Area | Beds / Baths | Price | Details |
|---|---|---|---|---|---|

|
#31
E 500 N
Crawfordsville, IN 47933
|
- sq. feet
|
- baths - beds |
show details | |

|
#32
S 170 W
Kingman, IN 47952
|
- sq. feet
|
- baths - beds |
show details | |

|
#33
S 325 W
Crawfordsville, IN 47933
|
- sq. feet
|
- baths - beds |
show details | |

|
#34
Mikels St
Romney, IN 47981
|
- sq. feet
|
- baths - beds |
show details | |

|
#35
S 170 W
Kingman, IN 47952
|
- sq. feet
|
- baths - beds |
show details | |

|
#36
N 225 W, Trlr 43
Crawfordsville, IN 47933
|
- sq. feet
|
- baths - beds |
show details | |

|
#37
E 200 S
Crawfordsville, IN 47933
|
- sq. feet
|
- baths - beds |
show details | |

|
#38
S Main St
Mellott, IN 47958
|
- sq. feet
|
- baths - beds |
show details | |

|
#39
N Xavier Rd
Attica, IN 47918
|
- sq. feet
|
- baths - beds |
show details | |

|
#40
Davidson St
Hillsboro, IN 47949
|
- sq. feet
|
- baths - beds |
show details |
| Photo | Address | Area | Beds / Baths | Price | Details |
|---|---|---|---|---|---|

|
#41
Ruby Rd
Attica, IN 47918
|
- sq. feet
|
- baths - beds |
show details | |

|
#42
E Cedar St
Attica, IN 47918
|
- sq. feet
|
- baths - beds |
show details | |

|
#43
Vine St
New Market, IN 47965
|
- sq. feet
|
- baths - beds |
show details | |

|
#44
E Jefferson St Ste 329
Crawfordsville, IN 47933
|
- sq. feet
|
- baths - beds |
show details | |

|
#45
E Jefferson St Apt 212
Crawfordsville, IN 47933
|
- sq. feet
|
- baths - beds |
show details | |

|
#46
E 200 Cr S
Crawfordsville, IN 47933
|
- sq. feet
|
- baths - beds |
show details | |

|
#47
Binford St # A201
Crawfordsville, IN 47933
|
- sq. feet
|
- baths - beds |
show details | |

|
#48
Vernon Ct
Crawfordsville, IN 47933
|
- sq. feet
|
- baths - beds |
show details | |

|
#49
W Pike St
Crawfordsville, IN 47933
|
- sq. feet
|
- baths - beds |
show details | |

|
Check over 1 million property listings on Foreclosure.com!
|
browse all offers | |||

Latest news about housing in Waynetown, IN collected exclusively by city-data.com from local newspapers, TV, and radio stations


Median year apartment built: 1964
Household type by relationship:
Households: 783- Male householders: 166 (27 living alone), Female householders: 146 (48 living alone)
134 spouses (134 opposite-sex spouses), 23 unmarried partners, (23 opposite-sex unmarried partners), 234 children (194 natural, 4 adopted, 36 stepchildren), 40 grandchildren, 10 brothers or sisters, 1 parents, 0 foster children, 21 other relatives, 6 non-relatives
Size of family households: 86 2-persons, 80 3-persons, 25 4-persons, 20 5-persons, 6 6-persons, 7 7-or-more-persons.
Size of nonfamily households: 77 1-person, 12 2-persons, 1 3-persons.
62 married couples with children.
76 single-parent households (10 men, 66 women).
91.2% of residents of Waynetown speak English at home.
7.8% of residents speak Spanish at home (82% speak English very well, 7% speak English well, 11% speak English not well).
Foreign born population: 9 (1.1%)
(77.8% of them are naturalized citizens)
| Here: | 6.2 |
| State: | 6.6 |
| Here: | 5.7 |
| State: | 4.3 |
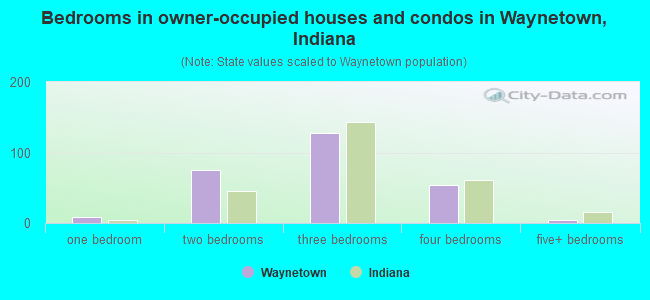
- Bedrooms in owner-occupied houses and condos in Waynetown, Indiana
- 0no bedroom
- 81 bedroom
- 752 bedrooms
- 1273 bedrooms
- 544 bedrooms
- 45+ bedrooms
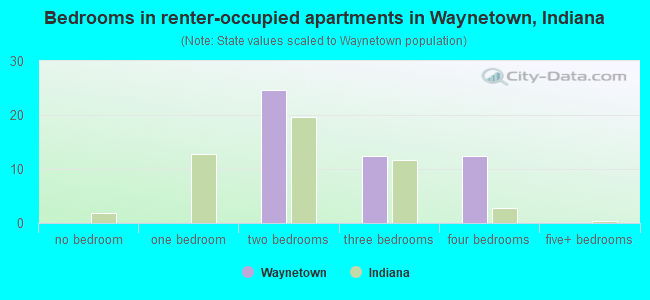
- Bedrooms in renter-occupied apartments in Waynetown, Indiana
- 0no bedroom
- 01 bedroom
- 252 bedrooms
- 123 bedrooms
- 124 bedrooms
- 05+ bedrooms
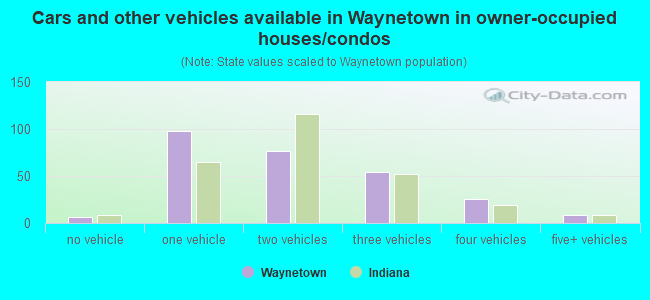
- Cars and other vehicles available in Waynetown in owner-occupied houses/condos
- 6no vehicle
- 981 vehicle
- 772 vehicles
- 543 vehicles
- 264 vehicles
- 85+ vehicles
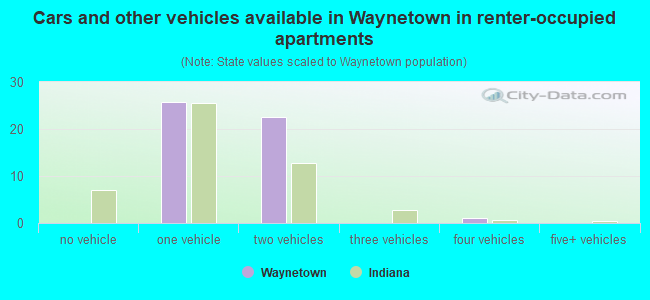
- Cars and other vehicles available in Waynetown in renter-occupied apartments
- 0no vehicle
- 261 vehicle
- 232 vehicles
- 03 vehicles
- 14 vehicles
- 05+ vehicles
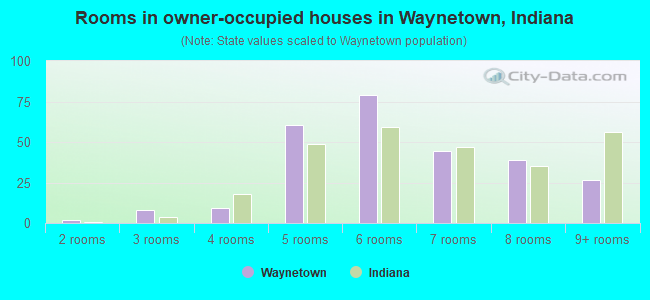
- Rooms in owner-occupied houses in Waynetown, Indiana
- 01 room
- 22 rooms
- 83 rooms
- 94 rooms
- 615 rooms
- 796 rooms
- 447 rooms
- 398 rooms
- 279+ rooms
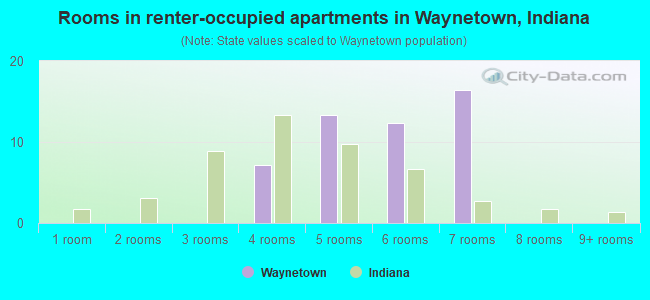
- Rooms in renter-occupied apartments in Waynetown, Indiana
- 01 room
- 02 rooms
- 03 rooms
- 74 rooms
- 135 rooms
- 126 rooms
- 167 rooms
- 08 rooms
- 09+ rooms
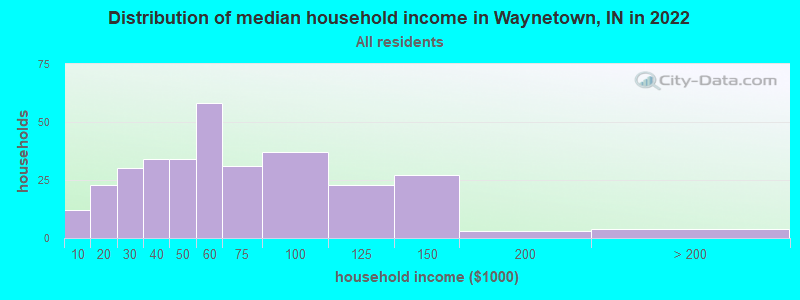
Waynetown, IN household income distribution

- 12Less than $10,000
- 23$10,000 to $19,999
- 30$20,000 to $29,999
- 34$30,000 to $39,999
- 34$40,000 to $49,999
- 58$50,000 to $59,999
- 31$60,000 to $74,999
- 37$75,000 to $99,999
- 23$100,000 to $124,999
- 27$125,000 to $149,999
- 3$150,000 to $199,999
- 4$200,000 or more
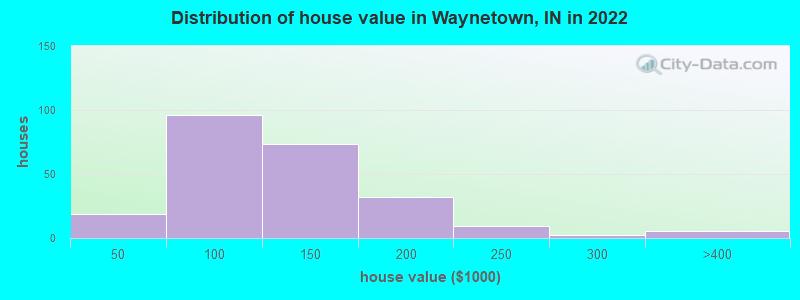
Home value of owner - occupied houses in 2022 in Waynetown, IN
-
- 10Less than $10,000
- 2$10,000 to $14,999
- 1$20,000 to $24,999
- 0$35,000 to $39,999
- 3$40,000 to $49,999
- 5$50,000 to $59,999
- 22$60,000 to $69,999
- 17$70,000 to $79,999
- 31$80,000 to $89,999
- 16$90,000 to $99,999
- 43$100,000 to $124,999
- 29$125,000 to $149,999
- 17$150,000 to $174,999
- 14$175,000 to $199,999
- 9$200,000 to $249,999
- 2$250,000 to $299,999
- 4$300,000 to $399,999
- 1$1,000,000 to $1,499,999
Rent paid by renters in 2022 in Waynetown, IN
-
- 0Less than $100
- 6$250 to $299
- 8$400 to $449
- 1$450 to $499
- 9$500 to $549
- 1$550 to $599
- 0$600 to $649
- 7$650 to $699
- 3$700 to $749
- 1$800 to $899
- 1$900 to $999
- 2No cash rent
Percentage of workers working in this county: 73.0%
Number of people working at home: 13 (3.6% of all workers)
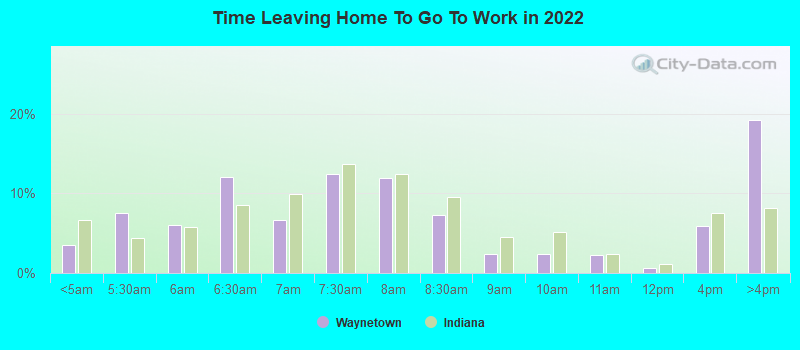
Travel time to work (commute)
- Less than 5 minutes: 20
- 5 to 9 minutes: 16
- 10 to 14 minutes: 21
- 15 to 19 minutes: 140
- 20 to 24 minutes: 40
- 25 to 29 minutes: 21
- 30 to 34 minutes: 18
- 35 to 39 minutes: 7
- 40 to 44 minutes: 3
- 45 to 59 minutes: 25
- 60 to 89 minutes: 11
- 90 or more minutes: 17
Means of transportation to work:
- Drove a car alone: 352 (79.8%)
- Carpooled: 51 (11.6%)
- Bus or trolley bus: 2 (0.5%)
- Bicycle: 3 (0.7%)
- Walked: 20 (4.5%)
- Worked at home: 13 (2.9%)
- Unemployment by race in 2022
- Unemployment rate for White non-Hispanic residents
- 2.6%Males
- 8.4%Females
- Unemployment rate for two or more race residents
- 43.3%Males
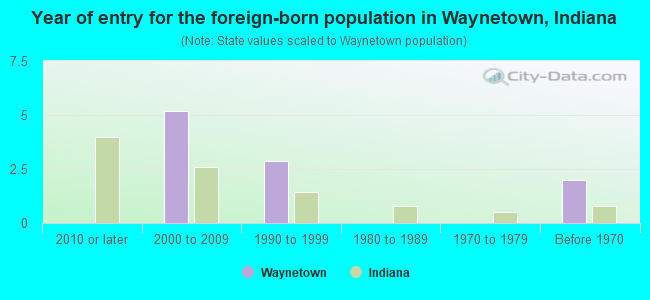
- Year of entry for the foreign-born population in Waynetown, Indiana
- 02010 or later
- 52000 to 2009
- 31990 to 1999
- 01980 to 1989
- 01970 to 1979
- 2Before 1970
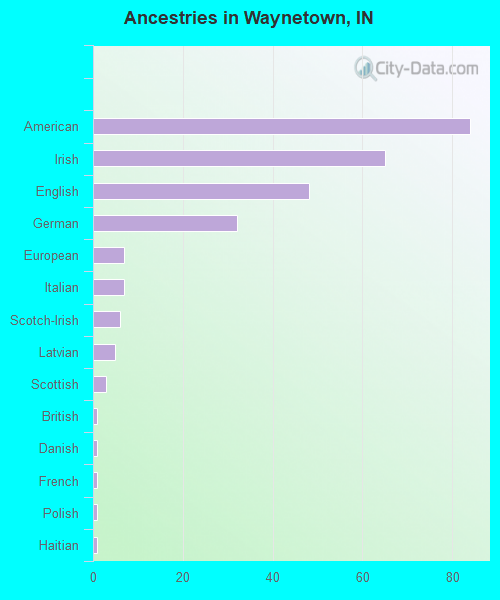
First ancestries reported:
- American: 84 (27.7%)
- Irish: 65 (21.4%)
- English: 48 (15.8%)
- German: 32 (10.6%)
- European: 7 (2.3%)
- Italian: 7 (2.3%)
- Scotch-Irish: 6 (2.0%)
- Latvian: 5 (1.6%)
- Scottish: 3 (1.0%)
- British: 1 (0.3%)
- Danish: 1 (0.3%)
- French: 1 (0.3%)
- Polish: 1 (0.3%)
- Haitian: 1 (0.3%)
Most common places of birth for foreign-born residents (%):
| Waynetown: | 55.6% (5) |
| Indiana: | 27.0% (101,996) |
| Waynetown: | 44.4% (4) |
| Indiana: | 0.8% (3,114) |
Place of birth for U.S.-born residents:
- This state: 587
- Other state: 174
- Northeast: 10
- Midwest: 99
- South: 49
- West: 15
89.3% of Waynetown residents lived in the same house 1 years ago.
Out of people who lived in different houses, 37.9% lived in this county.
Out of people who lived in different counties, 81.2% lived in Indiana.
| Waynetown: | 89.3% |
| State average: | 87.1% |
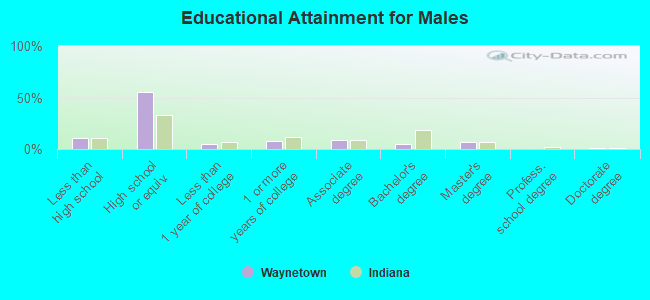
Education attainment for males 25 years and older:
- No schooling: 7
- Nursery to 4th grade: 0
- 5th and 6th grade: 2
- 7th and 8th grade: 0
- 9th grade: 5
- 10th grade: 0
- 11th grade: 6
- 12th grade, no diploma: 7
- High school graduate (or equivalency): 135
- Less than 1 year of college: 11
- Some college more than 1 year, no degree: 19
- Associate degree: 22
- Bachelor's degree: 12
- Master's degree: 16
- Professional school degree: 0
- Doctorate degree: 2
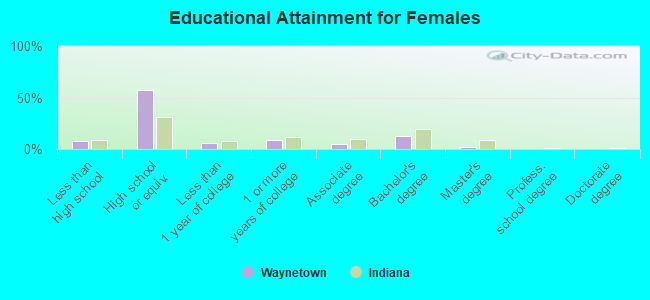
Education attainment for females 25 years and older:
- No schooling: 9
- Nursery to 4th grade: 0
- 5th and 6th grade: 0
- 7th and 8th grade: 0
- 9th grade: 0
- 10th grade: 6
- 11th grade: 7
- 12th grade, no diploma: 0
- High school graduate (or equivalency): 156
- Less than 1 year of college: 16
- Some college more than 1 year, no degree: 23
- Associate degree: 12
- Bachelor's degree: 35
- Master's degree: 6
- Professional school degree: 1
- Doctorate degree: 0


Housing units in structures:
- One, detached: 334
- One, attached: 1
- Two: 10
- 5 to 9: 5
- Mobile homes: 22
Median worth of mobile homes: $11,413
Housing units lacking complete kitchen facilities in 2022: 1.6%
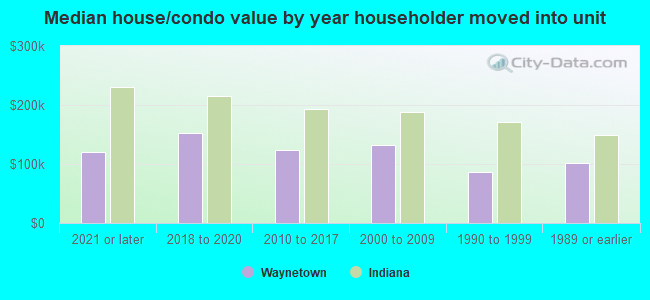
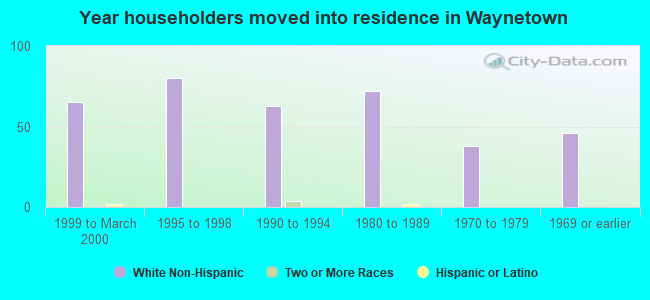
House/condo owner moved in on average 11 years ago
Renter moved in on average 1 years ago
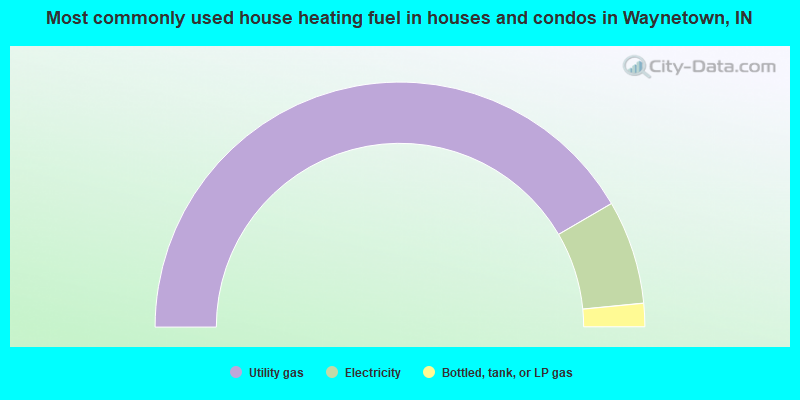
- 83.2%Utility gas
- 13.7%Electricity
- 3.1%Bottled, tank, or LP gas
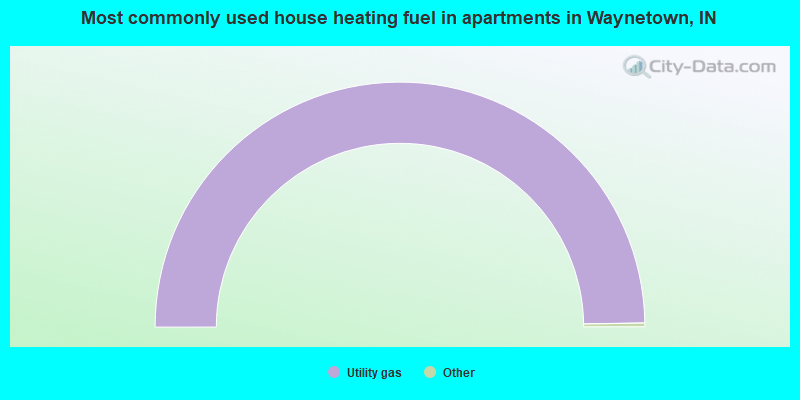
- 100.0%Utility gas
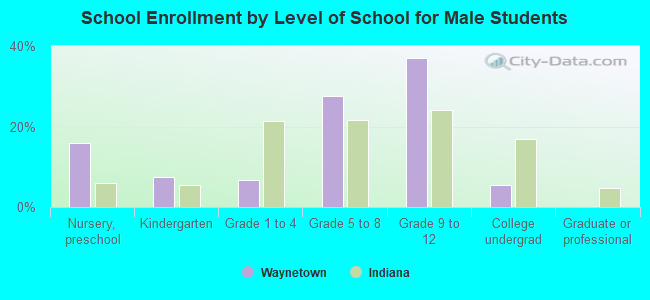
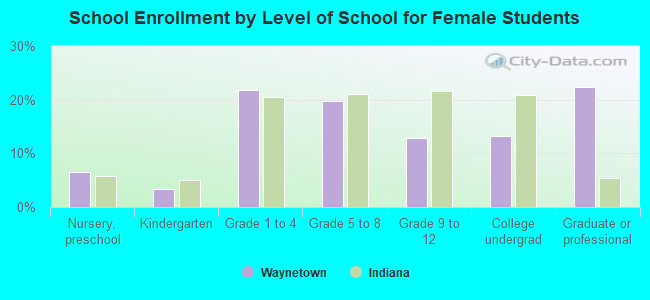
Private vs. public school enrollment:
| Here: | 2.5% |
| Indiana: | 14.9% |
| Here: | 1.9% |
| Indiana: | 11.4% |
| Here: | 0.0% |
| Indiana: | 22.3% |