Watertown, CT (Connecticut) Houses and Residents
| Watertown: | $318,231 |
| Connecticut: | $347,200 |
Total population: 22,514 (Urban population: 19,309, Rural population: 2,352 (11 farm, 2,341 nonfarm))
Houses: 8,298 (8,046 occupied: 6,381 owner occupied, 1,665 renter occupied)
| % of renters here: | 21% |
| State: | 34% |
Housing density: 285 houses/condos per square mile
Median price asked for vacant for-sale houses and condos in 2022 in this county: $399,480.
Median contract rent in 2022: $1,110 (lower quartile is $768, upper quartile is $1,476)
Median rent asked for vacant for-rent units in 2022: $1,106
Median gross rent in Watertown, CT in 2022: $1,290
Housing units in Watertown with a mortgage: 3,826 (219 second mortgage, 722 home equity loan, 29 both second mortgage and home equity loan)
Houses without a mortgage: 1,798
Compare current foreclosures near Watertown, CT:
| Photo | Address | Area | Beds / Baths | Price | Details |
|---|---|---|---|---|---|

|
#1
Oak Dr
Watertown, CT 06795
|
2,068 sq. feet
|
2 baths 4 beds |
show details | |

|
#2
Woodpark Dr
Watertown, CT 06795
|
1,205 sq. feet
|
1 baths 3 beds |
show details | |

|
#3
Bunker Hill Rd
Watertown, CT 06795
|
1,040 sq. feet
|
1 baths 3 beds |
show details | |

|
#4
Scott Ave
Watertown, CT 06795
|
2,080 sq. feet
|
2 baths 3 beds |
show details | |

|
#5
Woolson St
Watertown, CT 06795
|
1,701 sq. feet
|
2 baths 3 beds |
show details | |

|
#6
Hamilton Ave
Watertown, CT 06795
|
- sq. feet
|
- baths - beds |
show details | |

|
#7
Allen St
Bristol, CT 06010
|
1,092 sq. feet
|
1 baths 3 beds |
$215,000
|
show details |

|
#8
Janwood Rd
Waterbury, CT 06708
|
1,200 sq. feet
|
2 baths 3 beds |
$275,000
|
show details |

|
#9
Willis Ave
Meriden, CT 06450
|
1,008 sq. feet
|
1 baths 2 beds |
$299,900
|
show details |

|
#10
Seymour Rd
New Haven, CT 06525
|
1,639 sq. feet
|
2 baths 3 beds |
$312,000
|
show details |
| Photo | Address | Area | Beds / Baths | Price | Details |
|---|---|---|---|---|---|

|
#11
Birchwood Dr
Hamden, CT 06518
|
2,604 sq. feet
|
2 baths 3 beds |
$614,900
|
show details |

|
#12
Chestnut St
Naugatuck, CT 06770
|
1,012 sq. feet
|
1 baths 2 beds |
$279,900
|
show details |

|
#13
Wieting Rd
New Milford, CT 06776
|
3,210 sq. feet
|
3 baths 5 beds |
$549,900
|
show details |

|
#14
Amity Rd
Woodbridge, CT 06525
|
1,850 sq. feet
|
1 baths 3 beds |
$549,900
|
show details |

|
#15
Woodbine St
Torrington, CT 06790
|
2,756 sq. feet
|
3 baths 6 beds |
$419,900
|
show details |

|
#16
Clinton Hill Rd
Wolcott, CT 06716
|
1,828 sq. feet
|
1 baths 3 beds |
$240,000
|
show details |

|
#17
N Star Dr
Seymour, CT 06483
|
1,670 sq. feet
|
2 baths 3 beds |
$424,900
|
show details |

|
#18
Old Fairwood Rd
Bethany, CT 06524
|
2,464 sq. feet
|
3 baths 4 beds |
show details | |

|
#19
Fairfield Ave
Waterbury, CT 06708
|
1,538 sq. feet
|
1 baths 2 beds |
show details | |

|
#20
New Haven Rd Apt 6-E
Naugatuck, CT 06770
|
1,008 sq. feet
|
1 baths 2 beds |
show details |
| Photo | Address | Area | Beds / Baths | Price | Details |
|---|---|---|---|---|---|

|
#21
Hill St
Hamden, CT 06514
|
3,439 sq. feet
|
3 baths 4 beds |
show details | |

|
#22
Flanders Rd
Woodbury, CT 06798
|
2,424 sq. feet
|
2 baths 4 beds |
show details | |

|
#23
Sylvan Ave
Terryville, CT 06786
|
1,691 sq. feet
|
1 baths 4 beds |
show details | |

|
#24
Sylvan Ave
Waterbury, CT 06706
|
1,350 sq. feet
|
1 baths 4 beds |
show details | |

|
#25
Horne Cir
Southington, CT 06489
|
1,902 sq. feet
|
2 baths 4 beds |
show details | |

|
#26
Clairmont Ave
Waterbury, CT 06708
|
1,564 sq. feet
|
2 baths 4 beds |
show details | |

|
#27
Fawn Meadow Dr
Naugatuck, CT 06770
|
3,052 sq. feet
|
3 baths 4 beds |
show details | |

|
#28
Rena Ln
Waterbury, CT 06705
|
1,080 sq. feet
|
1 baths 3 beds |
show details | |

|
#29
Evansville Ave
Meriden, CT 06451
|
624 sq. feet
|
1 baths 3 beds |
show details | |

|
#30
Farmington Chase Cre
Farmington, CT 06032
|
1,317 sq. feet
|
1 baths 2 beds |
show details |
| Photo | Address | Area | Beds / Baths | Price | Details |
|---|---|---|---|---|---|

|
#31
Spring St
Meriden, CT 06451
|
660 sq. feet
|
1 baths 3 beds |
show details | |

|
#32
W Main St
New Britain, CT 06053
|
1,584 sq. feet
|
2 baths 4 beds |
show details | |

|
#33
Maple Hill Rd
Naugatuck, CT 06770
|
1,600 sq. feet
|
2 baths 3 beds |
show details | |

|
#34
Doran St
Waterbury, CT 06704
|
1,036 sq. feet
|
1 baths 3 beds |
show details | |

|
#35
Marcia Dr
Torrington, CT 06790
|
1,496 sq. feet
|
2 baths 4 beds |
show details | |

|
#36
Robin Ln
Cheshire, CT 06410
|
1,641 sq. feet
|
2 baths 3 beds |
show details | |

|
#37
Green Hill Rd
Bethany, CT 06524
|
1,920 sq. feet
|
2 baths 3 beds |
show details | |

|
#38
Barbara Dr
Waterbury, CT 06705
|
1,248 sq. feet
|
2 baths 3 beds |
show details | |

|
#39
Russell Rd
Bethany, CT 06524
|
3,787 sq. feet
|
3 baths 5 beds |
show details | |

|
#40
Surrey Dr
Bristol, CT 06010
|
1,079 sq. feet
|
1 baths 3 beds |
show details |
| Photo | Address | Area | Beds / Baths | Price | Details |
|---|---|---|---|---|---|

|
#41
Fawn Dr
Meriden, CT 06451
|
1,766 sq. feet
|
2 baths 4 beds |
show details | |

|
#42
Bch St
Goshen, CT 06756
|
1,380 sq. feet
|
1 baths 4 beds |
show details | |

|
#43
Spring St
Naugatuck, CT 06770
|
1,216 sq. feet
|
1 baths 3 beds |
show details | |

|
#44
Carter Rd
Plymouth, CT 06782
|
2,192 sq. feet
|
2 baths 3 beds |
show details | |

|
#45
Vanderbilt Rd
Bristol, CT 06010
|
1,803 sq. feet
|
1 baths 5 beds |
show details | |

|
#46
Hidden Valley Dr
Meriden, CT 06451
|
2,264 sq. feet
|
2 baths 4 beds |
show details | |

|
#47
Calumet St
Waterbury, CT 06710
|
2,175 sq. feet
|
2 baths 4 beds |
show details | |

|
#48
Governors Hill Rd
Oxford, CT 06478
|
2,106 sq. feet
|
2 baths 3 beds |
show details | |

|
#49
Litchfield Rd
Harwinton, CT 06791
|
2,216 sq. feet
|
1 baths 3 beds |
show details | |

|
Check over 1 million property listings on Foreclosure.com!
|
browse all offers | |||

Latest news about housing in Watertown, CT collected exclusively by city-data.com from local newspapers, TV, and radio stations

 | Current Real estate markets (3987 replies) |
| House or Rent in between Wallingford and Torrington (12 replies) |
| Considering a move back to CT and I want to buy a house (53 replies) |
| 2024 Connecticut Town Tournament VI (Celebrating the 10-Year Anniversary & Dazzleman's Memorial) (1007 replies) |
| CT Cities and Violent Crime (704 replies) |
| Vacation home - Mountain or Lake View Suggestions? (18 replies) |

Household type by relationship:
Households: 187,123- In family households: 156,490 (36,561 male householders, 14,969 female householders)
41,185 spouses, 52,814 children (49,404 natural, 1,325 adopted, 2,085 stepchildren), 2,365 grandchildren, 1,073 brothers or sisters, 1,650 parents, foster children, 1,216 other relatives, 3,500 non-relatives
- In nonfamily households: 30,633 (11,692 male householders (9,019 living alone)), 13,418 female householders (11,384 living alone)), 5,523 nonrelatives
- In group quarters: 2,804 (1,566 institutionalized population)
34,479 married couples with children.
7,472 single-parent households (1,895 men, 5,577 women).
87.2% of residents of Watertown speak English at home.
1.3% of residents speak Spanish at home (77% speak English very well, 12% speak English well, 12% speak English not well).
9.6% of residents speak other Indo-European language at home (63% speak English very well, 25% speak English well, 8% speak English not well, 4% don't speak English at all).
1.4% of residents speak Asian or Pacific Island language at home (33% speak English very well, 36% speak English well, 28% speak English not well, 3% don't speak English at all).
0.4% of residents speak other language at home (68% speak English very well, 32% speak English well).
Foreign born population: 2,487 (10.8%)
(86.2% of them are naturalized citizens)
| Here: | 6.5 |
| State: | 6.5 |
| Here: | 4.1 |
| State: | 4.0 |

- Bedrooms in owner-occupied houses and condos in Watertown, Connecticut
- 28no bedroom
- 1701 bedroom
- 1,0592 bedrooms
- 3,5913 bedrooms
- 1,2154 bedrooms
- 3185+ bedrooms

- Bedrooms in renter-occupied apartments in Watertown, Connecticut
- 21no bedroom
- 5141 bedroom
- 6582 bedrooms
- 3773 bedrooms
- 664 bedrooms
- 295+ bedrooms

- Cars and other vehicles available in Watertown in owner-occupied houses/condos
- 176no vehicle
- 1,4531 vehicle
- 3,1202 vehicles
- 1,1643 vehicles
- 3394 vehicles
- 1295+ vehicles

- Cars and other vehicles available in Watertown in renter-occupied apartments
- 183no vehicle
- 8711 vehicle
- 5042 vehicles
- 913 vehicles
- 164 vehicles
- 05+ vehicles

- Rooms in owner-occupied houses in Watertown, Connecticut
- 181 room
- 192 rooms
- 633 rooms
- 5074 rooms
- 1,0045 rooms
- 1,7766 rooms
- 1,3347 rooms
- 8908 rooms
- 7709+ rooms

- Rooms in renter-occupied apartments in Watertown, Connecticut
- 101 room
- 1122 rooms
- 3833 rooms
- 4814 rooms
- 3555 rooms
- 2256 rooms
- 527 rooms
- 208 rooms
- 279+ rooms


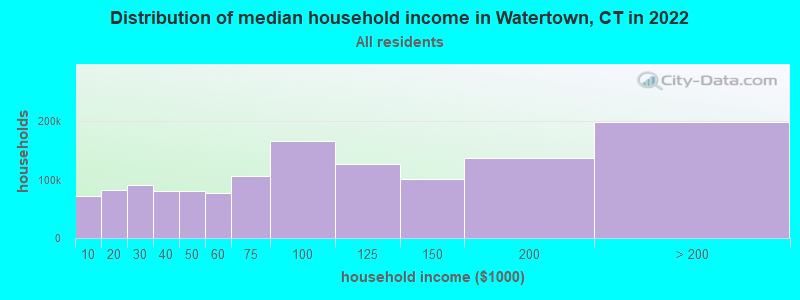
Watertown, CT household income distribution

- 70,411Less than $10,000
- 80,546$10,000 to $19,999
- 89,898$20,000 to $29,999
- 78,870$30,000 to $39,999
- 79,457$40,000 to $49,999
- 76,801$50,000 to $59,999
- 104,493$60,000 to $74,999
- 164,516$75,000 to $99,999
- 125,217$100,000 to $124,999
- 99,881$125,000 to $149,999
- 135,732$150,000 to $199,999
- 196,553$200,000 or more
Percentage of workers working in this county: 37.7%
Number of people working at home: 1,946 (15.7% of all workers)
Travel time to work (commute)
- Less than 5 minutes: 392
- 5 to 9 minutes: 1,595
- 10 to 14 minutes: 1,830
- 15 to 19 minutes: 1,727
- 20 to 24 minutes: 1,447
- 25 to 29 minutes: 526
- 30 to 34 minutes: 1,034
- 35 to 39 minutes: 290
- 40 to 44 minutes: 510
- 45 to 59 minutes: 881
- 60 to 89 minutes: 383
- 90 or more minutes: 285
Means of transportation to work:
- Drove a car alone: 9,709 (87.3%)
- Carpooled: 923 (8.3%)
- Bus or trolley bus: 59 (0.5%)
- Railroad: 24 (0.2%)
- Walked: 170 (1.5%)
- Other means: 15 (0.1%)
- Worked at home: 220 (2.0%)


- Year of entry for the foreign-born population in Watertown, Connecticut
- 1291995 to March 2000
- 1151990 to 1994
- 1551985 to 1989
- 1021980 to 1984
- 1651975 to 1979
- 3041970 to 1974
- 3101965 to 1969
- 333Before 1965

First ancestries reported:
- Italian: 7,378 (27.2%)
- Irish: 4,416 (16.3%)
- French: 2,244 (8.3%)
- English: 2,194 (8.1%)
- German: 1,994 (7.4%)
- Other: 1,769 (6.5%)
- Polish: 1,388 (5.1%)
- French Canadian: 1,200 (4.4%)
- Lithuanian: 1,002 (3.7%)
- United States: 605 (2.2%)
- Scottish: 500 (1.8%)
- Russian: 414 (1.5%)
- Portuguese: 406 (1.5%)
- Swedish: 327 (1.2%)
- Scotch-Irish: 166 (0.6%)
- Hungarian: 160 (0.6%)
- Czech: 152 (0.6%)
- Ukrainian: 133 (0.5%)
- Dutch: 132 (0.5%)
- Swiss: 117 (0.4%)
- Arab: 102 (0.4%)
- Greek: 97 (0.4%)
- Slovak: 60 (0.2%)
- Welsh: 51 (0.2%)
- Norwegian: 40 (0.1%)
- Danish: 28 (0.1%)
- West Indian: 13 (0.05%)
- Subsaharan African: 8 (0.03%)
Most common places of birth for foreign-born residents (%):
| Watertown: | 38.4% (619) |
| Connecticut: | 7.0% (26,023) |
| Watertown: | 7.9% (128) |
| Connecticut: | 1.7% (6,247) |
| Watertown: | 5.1% (83) |
| Connecticut: | 4.4% (16,395) |
| Watertown: | 5.1% (82) |
| Connecticut: | 5.2% (19,083) |
| Watertown: | 5.0% (80) |
| Connecticut: | 3.6% (13,234) |
| Watertown: | 4.6% (74) |
| Connecticut: | 1.0% (3,822) |
| Watertown: | 4.2% (67) |
| Connecticut: | 2.1% (7,596) |
| Watertown: | 3.3% (53) |
| Connecticut: | 2.5% (9,358) |
| Watertown: | 3.0% (49) |
| Connecticut: | 4.1% (15,108) |
| Watertown: | 2.6% (42) |
| Connecticut: | 0.3% (1,286) |
| Watertown: | 2.5% (40) |
| Connecticut: | 1.5% (5,508) |
| Watertown: | 2.4% (39) |
| Connecticut: | 6.9% (25,507) |
| Watertown: | 2.3% (37) |
| Connecticut: | 0.5% (1,693) |
Place of birth for U.S.-born residents:
- This state: 16,645
- Other state: 3,290
- Northeast: 2,483
- Midwest: 292
- South: 435
- West: 80
69% of Watertown residents lived in the same house 5 years ago.
Out of people who lived in different houses, 48% lived in this county.
Out of people who lived in different counties, 77% lived in Connecticut.
Education attainment for males 25 years and older:
- No schooling: 74
- Nursery to 4th grade: 23
- 5th and 6th grade: 98
- 7th and 8th grade: 277
- 9th grade: 95
- 10th grade: 181
- 11th grade: 186
- 12th grade, no diploma: 174
- High school graduate (or equivalency): 2,288
- Less than 1 year of college: 467
- Some college more than 1 year, no degree: 869
- Associate degree: 559
- Bachelor's degree: 1,028
- Master's degree: 441
- Professional school degree: 140
- Doctorate degree: 54

Education attainment for females 25 years and older:
- No schooling: 57
- Nursery to 4th grade: 48
- 5th and 6th grade: 100
- 7th and 8th grade: 289
- 9th grade: 145
- 10th grade: 278
- 11th grade: 152
- 12th grade, no diploma: 245
- High school graduate (or equivalency): 2,420
- Less than 1 year of college: 436
- Some college more than 1 year, no degree: 886
- Associate degree: 848
- Bachelor's degree: 1,196
- Master's degree: 703
- Professional school degree: 143
- Doctorate degree: 22


Housing units in structures:
- One, detached: 6,301
- One, attached: 284
- Two: 681
- 3 or 4: 550
- 5 to 9: 329
- 10 to 19: 63
- 20 to 49: 55
- 50 or more: 22
- Mobile homes: 13
Median worth of mobile homes: $438,750
Housing units lacking complete kitchen facilities: 0.2%

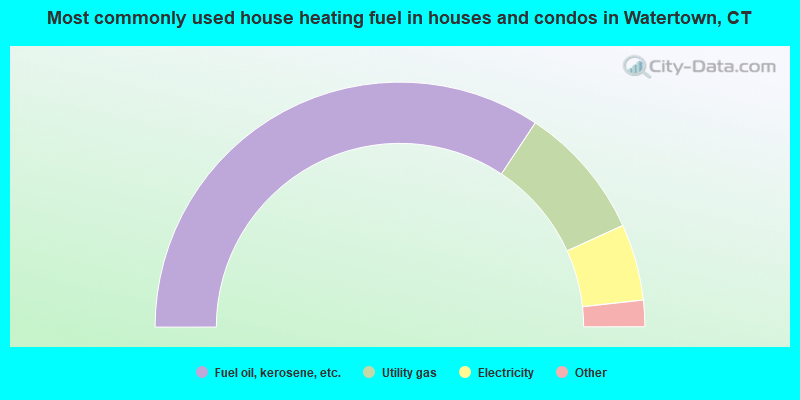
- 68.7%Fuel oil, kerosene, etc.
- 17.8%Utility gas
- 10.1%Electricity
- 1.6%Bottled, tank, or LP gas
- 1.3%Wood
- 0.5%Other fuel
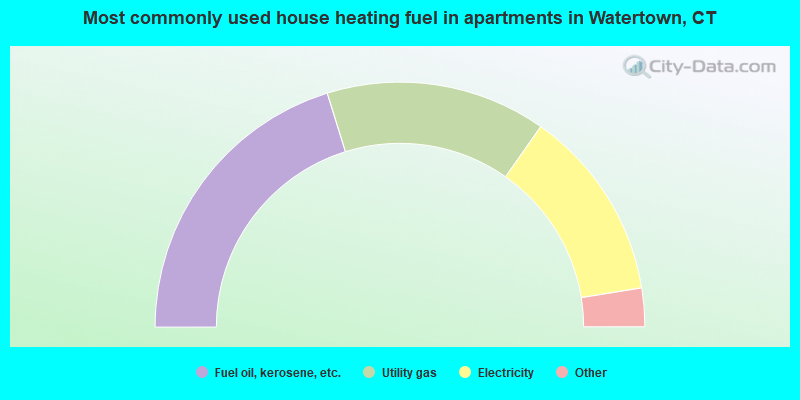
- 40.4%Fuel oil, kerosene, etc.
- 29.1%Utility gas
- 25.4%Electricity
- 3.3%Bottled, tank, or LP gas
- 1.1%Wood
- 0.7%Other fuel
Private vs. public school enrollment:
| Here: | 10.8% |
| Connecticut: | 9.9% |
| Here: | 20.7% |
| Connecticut: | 11.0% |
| Here: | 24.0% |
| Connecticut: | 33.4% |


