Waterloo, IA (Iowa) Houses and Residents
Estimated median house or condo value in 2022: $151,700 (it was $63,800 in 2000 )
Waterloo:
$151,700Iowa:
$194,600
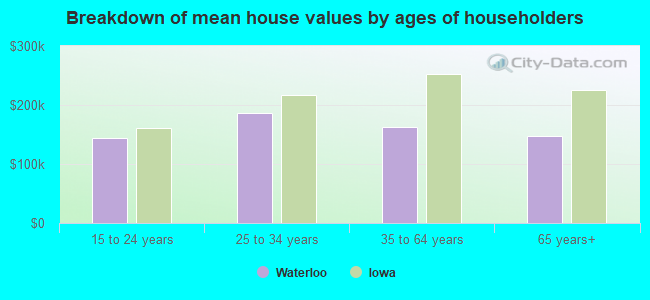
Lower value quartile - upper value quartile: $97,400 - $209,300Mean price in 2022: Detached houses: $188,118 Here:
$188,118State:
$245,224
Townhouses or other attached units: $268,342 Here:
$268,342State:
$238,767
In 2-unit structures: $298,857 Here:
$298,857State:
$243,070
In 3-to-4-unit structures: $237,080 Here:
$237,080State:
$162,139
In 5-or-more-unit structures: $176,699 Here:
$176,699State:
$190,519
Mobile homes: $56,083 Here:
$56,083State:
$51,271
Total population: 68,364 (Urban population: 66,202, Rural population: 2,434 (99 farm, 2,335 nonfarm ))
Houses: 30,851 (28,179 occupied: 17,892 owner occupied, 10,287 renter occupied )
% of renters here:
37%State:
28%
Housing density: 508 houses/condos per square mile
Median price asked for vacant for-sale houses and condos in 2022: $277,411.
Median contract rent in 2022: $658 (lower quartile is $520, upper quartile is $793)
Median rent asked for vacant for-rent units in 2022: $379
Median gross rent in Waterloo, IA in 2022: $812
Housing units in Waterloo with a mortgage: 11,199 (1,870 second mortgage, 0 home equity loan, 1,552 both second mortgage and home equity loan )Houses without a mortgage: 909
Median household income for houses/condos with a mortgage: $76,766
Median household income for apartments without a mortgage: $53,892
Median monthly housing costs: $877
Data:
Median house or condo value ($)
Median house or condo value ($ change since 2000)
Median house or condo value ($) - White
Median house or condo value ($) - Black or African American
Median house or condo value ($) - Asian
Median house or condo value ($) - Hispanic or Latino
Median house or condo value ($) - American Indian and Alaska Native
Median house or condo value ($) - Multirace
Median house or condo value ($) - Other Race
Median price asked for mobile homes ($)
Household density (households per square mile)
Mean house or condo value by units in structure - 1, detached ($)
Mean house or condo value by units in structure - 1, attached ($)
Mean house or condo value by units in structure - 2 ($)
Mean house or condo value by units in structure by units in structure - 3 or 4 ($)
Mean house or condo value by units in structure - 5 or more ($)
Mean house or condo value by units in structure - Boat, RV, van, etc. ($)
Mean house or condo value by units in structure - Mobile home ($)
Median contract rent ($)
Median contract rent - Lower quartile ($)
Median contract rent - Upper quartile ($)
Median gross rent ($)
Urban houses (%)
Rural houses (%)
Houses occupied (%)
Houses occupied (% change since 2000)
Houses owner occupied (%)
Houses owner occupied (% change since 2000)
Houses renter occupied (%)
Houses renter occupied (% change since 2000)
Vacant housing units - For rent (%)
Vacant housing units - For rent (% change since 2000)
Vacant housing units - For sale only (%)
Vacant housing units - For sale only (% change since 2000)
Vacant housing units - Rented or sold, not occupied (%)
Vacant housing units - Rented or sold, not occupied (% change since 2000)
Vacant housing units - For seasonal, recreational, or occasional use (%)
Vacant housing units - For seasonal, recreational, or occasional use (% change since 2000)
Vacant housing units - For migrant workers (%)
Vacant housing units - For migrant workers (% change since 2000)
Vacant housing units - Other vacant (%)
Vacant housing units - Other vacant (% change since 2000)
Median monthly housing costs ($)
Median household income for houses/condos with a mortgage ($)
Median household income for houses/condos without a mortgage ($)
Median household income ($)
Median household income ($) - White
Median household income ($) - Black or African American
Median household income ($) - Asian
Median household income ($) - Hispanic or Latino
Median household income ($) - American Indian and Alaska Native
Median household income ($) - Multirace
Median household income ($) - Other Race
Mortgage status - with mortgage (%)
Mortgage status - with second mortgage (%)
Mortgage status - with home equity loan (%)
Mortgage status - with both second mortgage and home equity loan (%)
Mortgage status - without a mortgage (%)
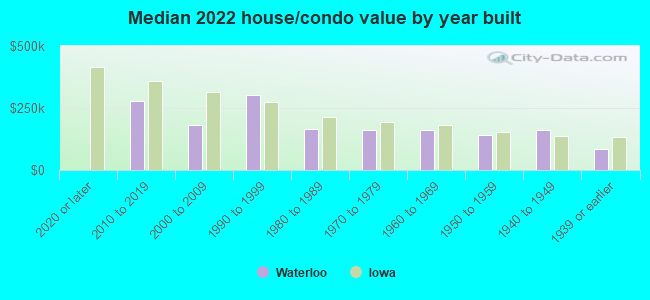
Median year house/condo built
Median year apartment built
Household type by relationship - Male householder living alone (%)
Household type by relationship - Male householder not living alone (%)
Household type by relationship - Female householder living alone (%)
Household type by relationship - Female householder not living alone (%)
Household type by relationship - Opposite-Sex spouse (%)
Household type by relationship - Same-Sex spouse (%)
Household type by relationship - Opposite-Sex unmarried partner (%)
Household type by relationship - Same-Sex unmarried partner (%)
Household type by relationship - In group quarters (%)
Size of family households - 2-person household (%)
Size of family households - 3-person household (%)
Size of family households - 4-person household (%)
Size of family households - 5-person household (%)
Size of family households - 6-person household (%)
Size of family households - 7-or-more-person household (%)
Size of nonfamily households - 1-person household (%)
Size of nonfamily households - 2-person household (%)
Size of nonfamily households - 3-person household (%)
Size of nonfamily households - 4-person household (%)
Size of nonfamily households - 5-person household (%)
Size of nonfamily households - 6-person household (%)
Size of nonfamily households - 7-or-moreperson household (%)
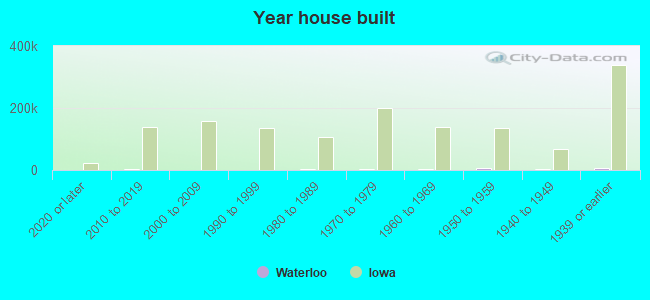
Year house built - Built 2010 or later (%)
Year house built - Built 2000 to 2009 (%)
Year house built - Built 1990 to 1999 (%)
Year house built - Built 1980 to 1989 (%)
Year house built - Built 1970 to 1979 (%)
Year house built - Built 1960 to 1969 (%)
Year house built - Built 1950 to 1959 (%)
Year house built - Built 1940 to 1949 (%)
Year house built - Built 1939 or earlier (%)
Median number of rooms in houses and condos
Median number of rooms in apartments
Median number of bedrooms in owner occupied houses
Mean number of bedrooms in owner occupied houses
Median number of bedrooms in renter occupied houses
Mean number of bedrooms in renter occupied houses
Median number of vehichles in owner occupied houses
Mean number of vehichles in owner occupied houses
Median number of vehichles in renter occupied houses
Mean number of vehichles in renter occupied houses
Rooms in owner-occupied houses - 1 room (%)
Rooms in owner-occupied houses - 2 rooms (%)
Rooms in owner-occupied houses - 3 rooms (%)
Rooms in owner-occupied houses - 4 rooms (%)
Rooms in owner-occupied houses - 5 rooms (%)
Rooms in owner-occupied houses - 6 rooms (%)
Rooms in owner-occupied houses - 7 rooms (%)
Rooms in owner-occupied houses - 8 rooms (%)
Rooms in owner-occupied houses - 9+ rooms (%)
Rooms in renter-occupied houses - 1 room (%)
Rooms in renter-occupied houses - 2 rooms (%)
Rooms in renter-occupied houses - 3 rooms (%)
Rooms in renter-occupied houses - 4 rooms (%)
Rooms in renter-occupied houses - 5 rooms (%)
Rooms in renter-occupied houses - 6 rooms (%)
Rooms in renter-occupied houses - 7 rooms (%)
Rooms in renter-occupied houses - 8 rooms (%)
Rooms in renter-occupied houses - 9+ rooms (%)
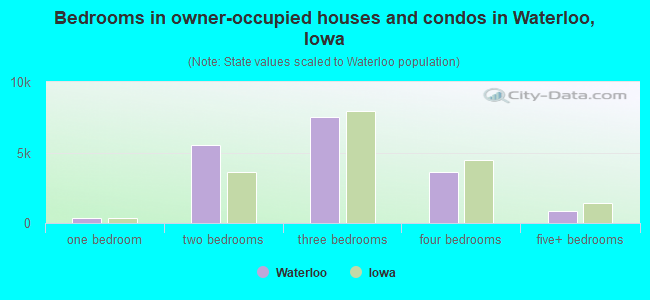
Bedrooms in owner-occupied houses - no bedrooms (%)
Bedrooms in owner-occupied houses - 1 bedroom (%)
Bedrooms in owner-occupied houses - 2 bedrooms (%)
Bedrooms in owner-occupied houses - 3 bedrooms (%)
Bedrooms in owner-occupied houses - 4 bedrooms (%)
Bedrooms in owner-occupied houses - 5+ bedrooms (%)
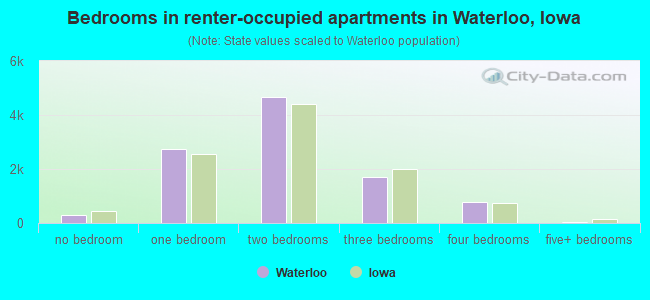
Bedrooms in renter-occupied houses - no bedrooms (%)
Bedrooms in renter-occupied houses - 1 bedroom (%)
Bedrooms in renter-occupied houses - 2 bedrooms (%)
Bedrooms in renter-occupied houses - 3 bedrooms (%)
Bedrooms in renter-occupied houses - 4 bedrooms (%)
Bedrooms in renter-occupied houses - 5+ bedrooms (%)
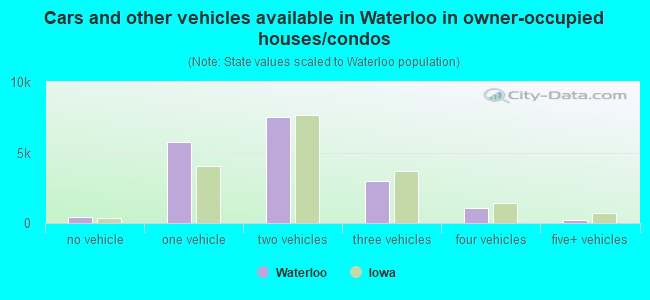
Vehicles available in owner-occupied houses - no vehicle available (%)
Vehicles available in owner-occupied houses - 1 vehicle available(%)
Vehicles available in owner-occupied houses - 2 Vehicles available (%)
Vehicles available in owner-occupied houses - 3 Vehicles available (%)
Vehicles available in owner-occupied houses - 4 Vehicles available (%)
Vehicles available in owner-occupied houses - 5+ Vehicles available (%)
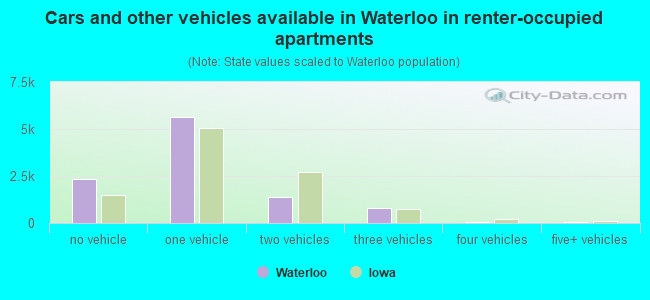
Vehicles available in renter-occupied houses - no vehicle available (%)
Vehicles available in renter-occupied houses - 1 vehicle available (%)
Vehicles available in renter-occupied houses - 2 Vehicles available (%)
Vehicles available in renter-occupied houses - 3 Vehicles available (%)
Vehicles available in renter-occupied houses - 4 Vehicles available (%)
Vehicles available in renter-occupied houses - 5+ Vehicles available (%)
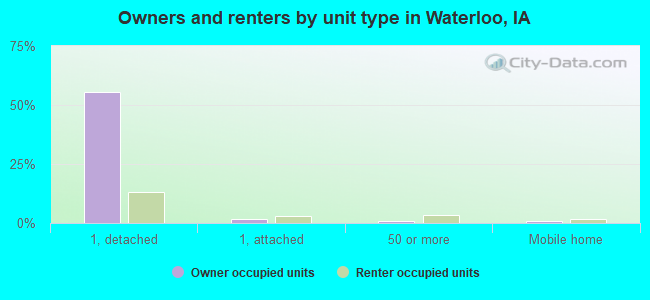
Housing units in structures - 1, detached (%)
Housing units in structures - 1, attached (%)
Housing units in structures - 2 (%)
Housing units in structures - 3 or 4 (%)
Housing units in structures - 5 to 9 (%)
Housing units in structures - 10 to 19 (%)
Housing units in structures - 20 to 49 (%)
Housing units in structures - 50 or more (%)
Housing units in structures - Mobile home (%)
Housing units in structures - Boat, RV, van, etc. (%)
Housing units in structures - Owners - 1, detached (%)
Housing units in structures - Owners - 1, attached (%)
Housing units in structures - Owners - 2 (%)
Housing units in structures - Owners - 3 or 4 (%)
Housing units in structures - Owners - 5 to 9 (%)
Housing units in structures - Owners - 10 to 19 (%)
Housing units in structures - Owners - 20 to 49 (%)
Housing units in structures - Owners - 50 or more (%)
Housing units in structures - Owners - Mobile home (%)
Housing units in structures - Owners - Boat, RV, van, etc. (%)
Housing units in structures - Renters - 1, detached (%)
Housing units in structures - Renters - 1, attached (%)
Housing units in structures - Renters - 2 (%)
Housing units in structures - Renters - 3 or 4 (%)
Housing units in structures - Renters - 5 to 9 (%)
Housing units in structures - Renters - 10 to 19 (%)
Housing units in structures - Renters - 20 to 49 (%)
Housing units in structures - Renters - 50 or more (%)
Housing units in structures - Renters - Mobile home (%)
Housing units in structures - Renters - Boat, RV, van, etc. (%)
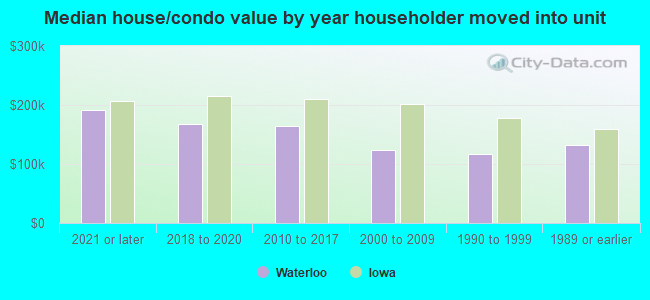
House/condo owner moved in on average (years ago)
Renter moved in on average (years ago)
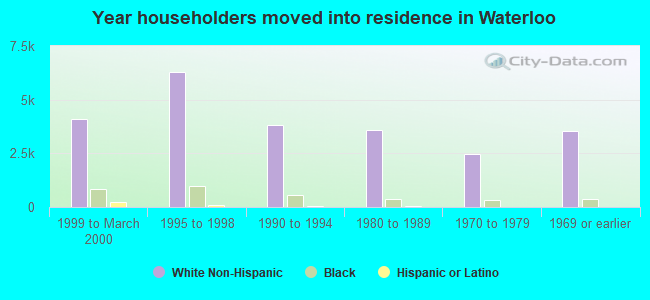
Year householder moved into unit - Moved in 1999 to March 2000 (%)
Year householder moved into unit - Moved in 1999 to March 2000 (%) - White
Year householder moved into unit - Moved in 1999 to March 2000 (%) - Black or African American
Year householder moved into unit - Moved in 1999 to March 2000 (%) - Asian
Year householder moved into unit - Moved in 1999 to March 2000 (%) - Hispanic or Latino
Year householder moved into unit - Moved in 1999 to March 2000 (%) - American Indian and Alaska Native
Year householder moved into unit - Moved in 1999 to March 2000 (%) - Multirace
Year householder moved into unit - Moved in 1999 to March 2000 (%) - Other Race
Year householder moved into unit - Moved in 1995 to 1998 (%)
Year householder moved into unit - Moved in 1995 to 1998 (%) - White
Year householder moved into unit - Moved in 1995 to 1998 (%) - Black or African American
Year householder moved into unit - Moved in 1995 to 1998 (%) - Asian
Year householder moved into unit - Moved in 1995 to 1998 (%) - Hispanic or Latino
Year householder moved into unit - Moved in 1995 to 1998 (%) - American Indian and Alaska Native
Year householder moved into unit - Moved in 1995 to 1998 (%) - Multirace
Year householder moved into unit - Moved in 1995 to 1998 (%) - Other Race
Year householder moved into unit - Moved in 1990 to 1994 (%)
Year householder moved into unit - Moved in 1990 to 1994 (%) - White
Year householder moved into unit - Moved in 1990 to 1994 (%) - Black or African American
Year householder moved into unit - Moved in 1990 to 1994 (%) - Asian
Year householder moved into unit - Moved in 1990 to 1994 (%) - Hispanic or Latino
Year householder moved into unit - Moved in 1990 to 1994 (%) - American Indian and Alaska Native
Year householder moved into unit - Moved in 1990 to 1994 (%) - Multirace
Year householder moved into unit - Moved in 1990 to 1994 (%) - Other Race
Year householder moved into unit - Moved in 1980 to 1989 (%)
Year householder moved into unit - Moved in 1980 to 1989 (%) - White
Year householder moved into unit - Moved in 1980 to 1989 (%) - Black or African American
Year householder moved into unit - Moved in 1980 to 1989 (%) - Asian
Year householder moved into unit - Moved in 1980 to 1989 (%) - Hispanic or Latino
Year householder moved into unit - Moved in 1980 to 1989 (%) - American Indian and Alaska Native
Year householder moved into unit - Moved in 1980 to 1989 (%) - Multirace
Year householder moved into unit - Moved in 1980 to 1989 (%) - Other Race
Year householder moved into unit - Moved in 1970 to 1979 (%)
Year householder moved into unit - Moved in 1970 to 1979 (%) - White
Year householder moved into unit - Moved in 1970 to 1979 (%) - Black or African American
Year householder moved into unit - Moved in 1970 to 1979 (%) - Asian
Year householder moved into unit - Moved in 1970 to 1979 (%) - Hispanic or Latino
Year householder moved into unit - Moved in 1970 to 1979 (%) - American Indian and Alaska Native
Year householder moved into unit - Moved in 1970 to 1979 (%) - Multirace
Year householder moved into unit - Moved in 1970 to 1979 (%) - Other Race
Year householder moved into unit - Moved in 1969 or earlier (%)
Year householder moved into unit - Moved in 1969 or earlier (%) - White
Year householder moved into unit - Moved in 1969 or earlier (%) - Black or African American
Year householder moved into unit - Moved in 1969 or earlier (%) - Asian
Year householder moved into unit - Moved in 1969 or earlier (%) - Hispanic or Latino
Year householder moved into unit - Moved in 1969 or earlier (%) - American Indian and Alaska Native
Year householder moved into unit - Moved in 1969 or earlier (%) - Multirace
Year householder moved into unit - Moved in 1969 or earlier (%) - Other Race
Housing units lacking complete plumbing facilities (%)
Housing units lacking complete kitchen facilities (%)
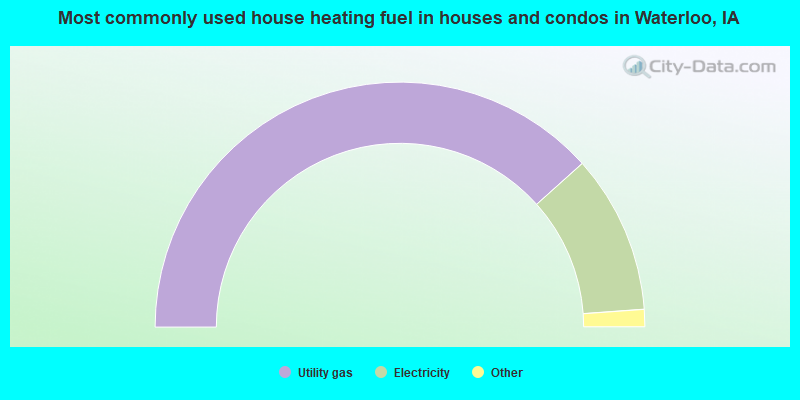
House heating fuel used in houses and condos - Utility gas (%)
House heating fuel used in houses and condos - Bottled, tank, or LP gas (%)
House heating fuel used in houses and condos - Electricity (%)
House heating fuel used in houses and condos - Fuel oil, kerosene, etc. (%)
House heating fuel used in houses and condos - Coal or coke (%)
House heating fuel used in houses and condos - Wood (%)
House heating fuel used in houses and condos - Solar energy (%)
House heating fuel used in houses and condos - Other fuel (%)
House heating fuel used in houses and condos - No fuel used (%)
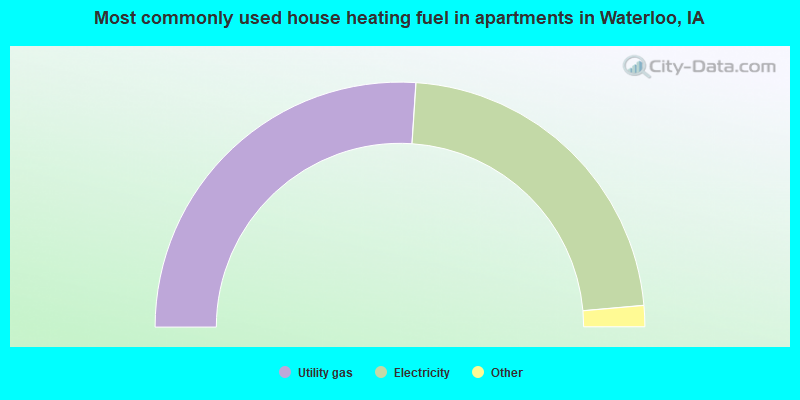
House heating fuel used in apartments - Utility gas (%)
House heating fuel used in apartments - Bottled, tank, or LP gas (%)
House heating fuel used in apartments - Electricity (%)
House heating fuel used in apartments - Fuel oil, kerosene, etc. (%)
House heating fuel used in apartments - Coal or coke (%)
House heating fuel used in apartments - Wood (%)
House heating fuel used in apartments - Solar energy (%)
House heating fuel used in apartments - Other fuel (%)
House heating fuel used in apartments - No fuel used (%)
Latest news about housing in Waterloo, IA collected exclusively by city-data.com from local newspapers, TV, and radio stations
Median year house/condo built: 1957Median year apartment built: 1970Household type by relationship:
Households: 66,555
Male householders: 13,082 (4,625 living alone ), Female householders: 15,097 (5,839 living alone )8,905 spouses (8,843 opposite-sex spouses ), 3,521 unmarried partners , (3,327 opposite-sex unmarried partners ), 17,936 children (16,611 natural , 259 adopted , 1,066 stepchildren ), 897 grandchildren , 793 brothers or sisters , 612 parents , 0 foster children , 1,982 other relatives , 2,855 non-relatives In group quarters: 875
Size of family households: 6,006 2-persons , 3,303 3-persons , 2,864 4-persons , 1,660 5-persons , 1,212 6-persons , 600 7-or-more-persons .
Size of nonfamily households: 10,464 1-person , 1,661 2-persons , 324 3-persons , 85 4-persons .
6,897 married couples with children. single-parent households (2,408 men , 4,946 women ).
87.0% of residents of Waterloo speak English at home. of residents speak Spanish at home (59% speak English very well , 26% speak English well , 14% speak English not well , 1% don't speak English at all ).of residents speak other Indo-European language at home (44% speak English very well , 26% speak English well , 27% speak English not well , 4% don't speak English at all ).of residents speak Asian or Pacific Island language at home (30% speak English very well , 35% speak English well , 19% speak English not well , 15% don't speak English at all ).of residents speak other language at home (82% speak English very well , 7% speak English well , 11% speak English not well ).
Foreign born population: 7,780 (11.7%)of them are naturalized citizens )
Median number of rooms in houses and condos:
Median number of rooms in apartments
Owner-occupied Renter-occupied
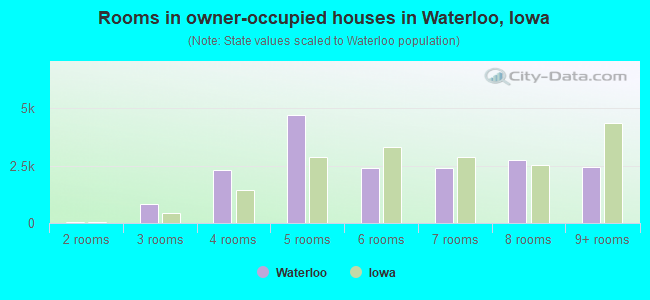
Rooms in owner-occupied houses in Waterloo, Iowa
0 1 room 50 2 rooms 824 3 rooms 2,301 4 rooms 4,707 5 rooms 2,398 6 rooms 2,416 7 rooms 2,736 8 rooms 2,460 9+ rooms
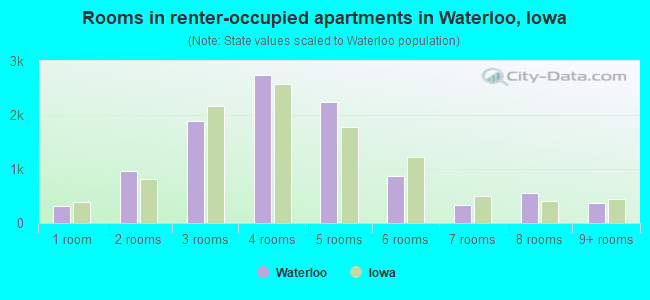
Rooms in renter-occupied apartments in Waterloo, Iowa
308 1 room 964 2 rooms 1,894 3 rooms 2,743 4 rooms 2,249 5 rooms 869 6 rooms 338 7 rooms 549 8 rooms 373 9+ rooms
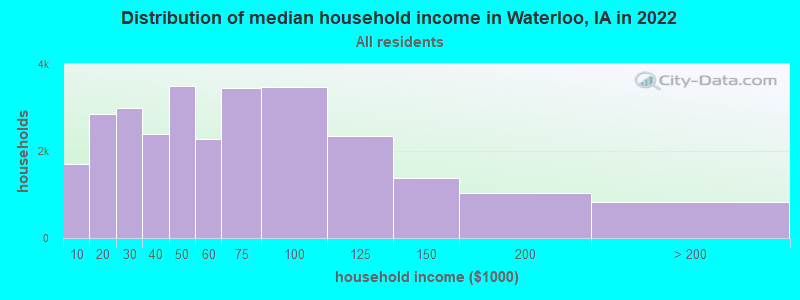
Waterloo, IA household income distribution 1,691 Less than $10,0002,856 $10,000 to $19,9992,981 $20,000 to $29,9992,397 $30,000 to $39,9993,501 $40,000 to $49,9992,275 $50,000 to $59,9993,440 $60,000 to $74,9993,470 $75,000 to $99,9992,336 $100,000 to $124,9991,369 $125,000 to $149,9991,028 $150,000 to $199,999835 $200,000 or more
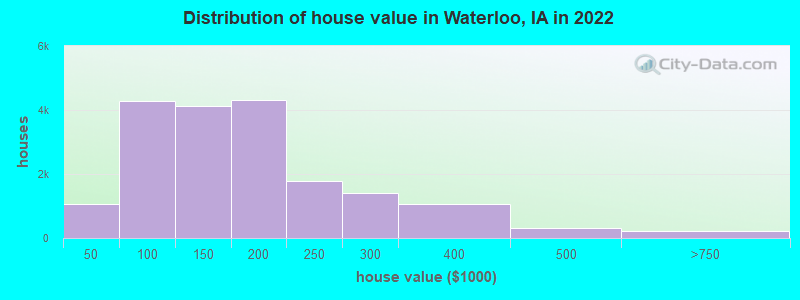
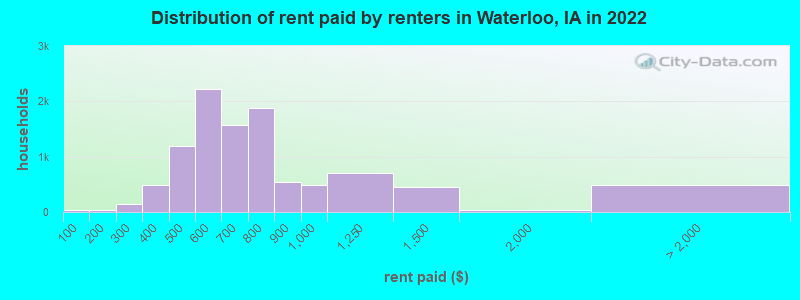
Home value of owner - occupied houses in 2022 in Waterloo, IA 75 Less than $10,000118 $15,000 to $19,99945 $20,000 to $24,99957 $25,000 to $29,99971 $35,000 to $39,999697 $40,000 to $49,999683 $50,000 to $59,999429 $60,000 to $69,999718 $70,000 to $79,9991,083 $80,000 to $89,999671 $90,000 to $99,9992,255 $100,000 to $124,9991,860 $125,000 to $149,9992,777 $150,000 to $174,9991,547 $175,000 to $199,9991,789 $200,000 to $249,9991,414 $250,000 to $299,9991,073 $300,000 to $399,999321 $400,000 to $499,999209 $500,000 to $749,999Rent paid by renters in 2022 in Waterloo, IA 41 Less than $10041 $100 to $14993 $200 to $24947 $250 to $299117 $300 to $349378 $350 to $399543 $400 to $449647 $450 to $4991,370 $500 to $549859 $550 to $599656 $600 to $649910 $650 to $699596 $700 to $7491,276 $750 to $799536 $800 to $899496 $900 to $999708 $1,000 to $1,249457 $1,250 to $1,49932 $1,500 to $1,99966 $3,000 to $3,499418 No cash rent
Percentage of workers working in this county: 95.3%Number of people working at home: 2,424 (7.6% of all workers )
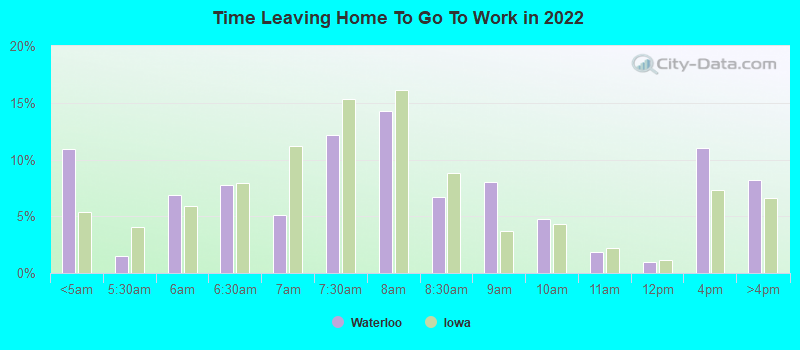
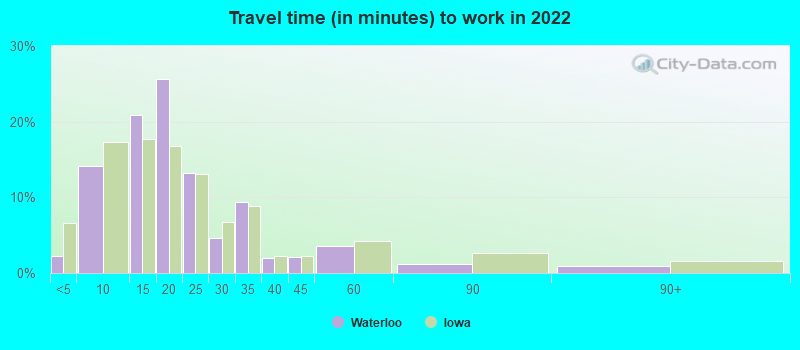
Travel time to work (commute)
Less than 5 minutes: 8405 to 9 minutes: 4,96710 to 14 minutes: 9,02915 to 19 minutes: 7,76920 to 24 minutes: 3,27225 to 29 minutes: 1,05530 to 34 minutes: 1,38235 to 39 minutes: 8740 to 44 minutes: 8645 to 59 minutes: 40460 to 89 minutes: 34790 or more minutes: 205
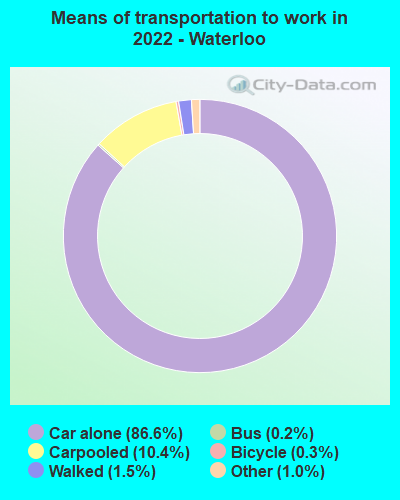
Means of transportation to work:
Drove a car alone: 35,062 (80.6%)Carpooled: 4,451 (10.2%)Bus : 72 (0.2%)Taxi: 383 (0.9%)Bicycle: 143 (0.3%)Walked: 598 (1.4%)Worked at home: 2,424 (5.6%)
Unemployment by race in 2022
Unemployment rate for White non-Hispanic residents 6.1% Males3.1% FemalesUnemployment rate for Black residents 22.5% Males14.8% FemalesUnemployment rate for American Indian and Alaska Native residents 25.0% MalesUnemployment rate for Asian residents 4.9% FemalesUnemployment rate for other race residents 2.1% Males15.1% FemalesUnemployment rate for two or more race residents 2.6% Males17.4% FemalesUnemployment rate for Hispanic or Latino residents 4.8% Males4.0% Females
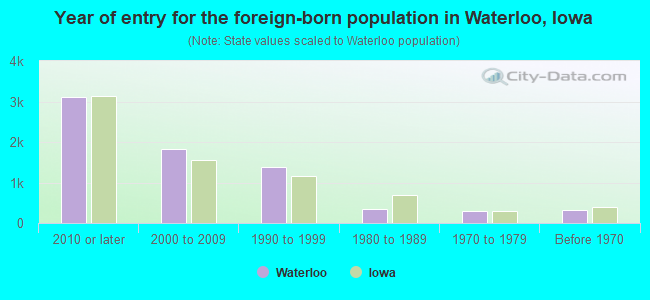
Year of entry for the foreign-born population in Waterloo, Iowa
3,104 2010 or later 1,816 2000 to 2009 1,393 1990 to 1999 347 1980 to 1989 293 1970 to 1979 313 Before 1970
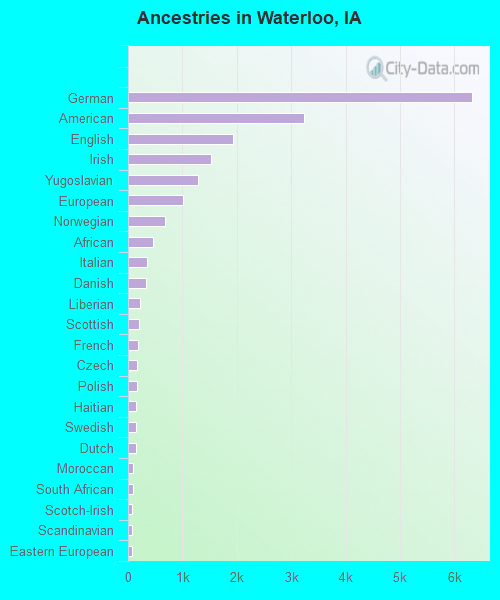
First ancestries reported:
German: 6,322 (19.4%)
American: 3,241 (10.0%)
English: 1,932 (5.9%)
Irish: 1,534 (4.7%)
Yugoslavian: 1,292 (4.0%)
European: 1,007 (3.1%)
Norwegian: 678 (2.1%)
African: 459 (1.4%)
Italian: 354 (1.1%)
Danish: 325 (1.0%)
Liberian: 220 (0.7%)
Scottish: 205 (0.6%)
French: 185 (0.6%)
Czech: 170 (0.5%)
Polish: 168 (0.5%)
Haitian: 153 (0.5%)
Swedish: 150 (0.5%)
Dutch: 147 (0.5%)
Moroccan: 92 (0.3%)
South African: 92 (0.3%)
Scotch-Irish: 80 (0.2%)
Scandinavian: 80 (0.2%)
Eastern European: 69 (0.2%)
Iranian: 56 (0.2%)
Czechoslovakian: 50 (0.2%)
Croatian: 39 (0.1%)
Greek: 39 (0.1%)
French Canadian: 39 (0.1%)
Swiss: 35 (0.1%)
Russian: 30 (0.09%)
Jamaican: 27 (0.08%)
Finnish: 26 (0.08%)
British: 26 (0.08%)
Somali: 26 (0.08%)
Sudanese: 26 (0.08%)
Bulgarian: 23 (0.07%)
Trinidadian and Tobagonian: 23 (0.07%)
Canadian: 22 (0.07%)
Belgian: 21 (0.06%)
Albanian: 18 (0.06%)
Slavic: 16 (0.05%)
Austrian: 13 (0.04%)
Ethiopian: 12 (0.04%)
Luxembourger: 9 (0.03%)
Welsh: 9 (0.03%)
Pennsylvania German: 8 (0.02%)
Northern European: 8 (0.02%)
German Russian: 5 (0.02%)
Ghanaian: 4 (0.01%)
Most common places of birth for foreign-born residents (%): Bosnia and Herzegovina Waterloo:
18.9% (1,203)Iowa:
3.2% (5,751)
Democratic Republic of Congo (Zaire) Waterloo:
15.5% (984)Iowa:
2.1% (3,735)
Mexico Waterloo:
14.8% (938)Iowa:
23.3% (41,625)
Thailand Waterloo:
6.8% (431)Iowa:
2.0% (3,595)
Burma (Myanmar) Waterloo:
6.5% (412)Iowa:
2.5% (4,514)
Micronesia Waterloo:
5.0% (319)Iowa:
0.7% (1,305)
Liberia Waterloo:
4.1% (263)Iowa:
1.7% (2,949)
El Salvador Waterloo:
2.2% (138)Iowa:
2.8% (4,967)
Guatemala Waterloo:
1.8% (117)Iowa:
3.2% (5,672)
China, excluding Hong Kong and Taiwan Waterloo:
1.7% (111)Iowa:
4.6% (8,194)
India Waterloo:
1.7% (107)Iowa:
6.2% (11,148)
Haiti Waterloo:
1.6% (104)Iowa:
0.4% (788)
Place of birth for U.S.-born residents:
This state: 47,360Other state: 10,874Northeast: 739Midwest: 4,675South: 3,038West: 2,422 83.4% of Waterloo residents lived in the same house 1 years ago.
Out of people who lived in different houses, 42.2% lived in this county.
Out of people who lived in different counties, 53.1% lived in Iowa.
Waterloo:
83.4%State average:
87.2%
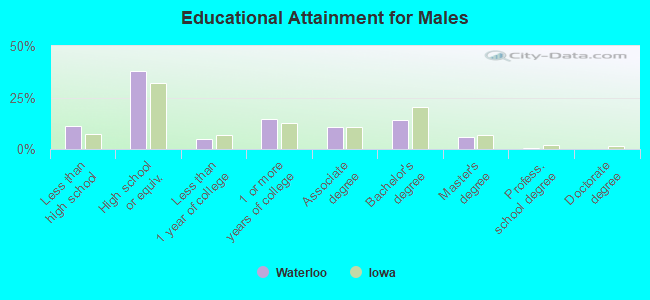
Education attainment for males 25 years and older:
No schooling: 367Nursery to 4th grade: 285th and 6th grade: 07th and 8th grade: 2329th grade: 23510th grade: 25111th grade: 29912th grade, no diploma: 910High school graduate (or equivalency): 7,849Less than 1 year of college: 1,021Some college more than 1 year, no degree: 3,038Associate degree: 2,206Bachelor's degree: 2,893Master's degree: 1,201Professional school degree: 147Doctorate degree: 22
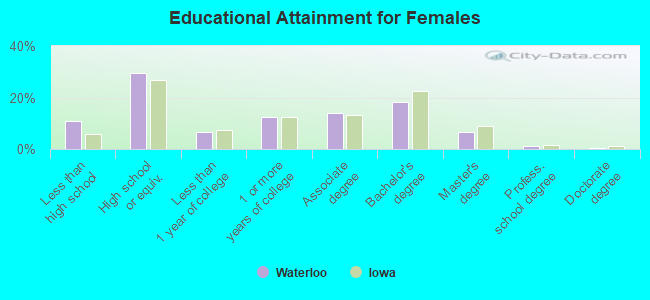
Education attainment for females 25 years and older:
No schooling: 527Nursery to 4th grade: 435th and 6th grade: 897th and 8th grade: 1289th grade: 33710th grade: 21411th grade: 62912th grade, no diploma: 430High school graduate (or equivalency): 6,493Less than 1 year of college: 1,418Some college more than 1 year, no degree: 2,696Associate degree: 3,068Bachelor's degree: 4,030Master's degree: 1,479Professional school degree: 278Doctorate degree: 121
Housing units in structures:
One, detached: 20,774One, attached: 1,208Two: 7593 or 4: 1,0865 to 9: 2,19410 to 19: 1,50120 to 49: 59950 or more: 1,850Mobile homes: 880Median worth of mobile homes: $23,684
Housing units lacking complete plumbing facilities in 2022: 0.7%Housing units lacking complete kitchen facilities in 2022: 1.3%House/condo owner moved in on average 11 years ago
Renter moved in on average 2 years ago
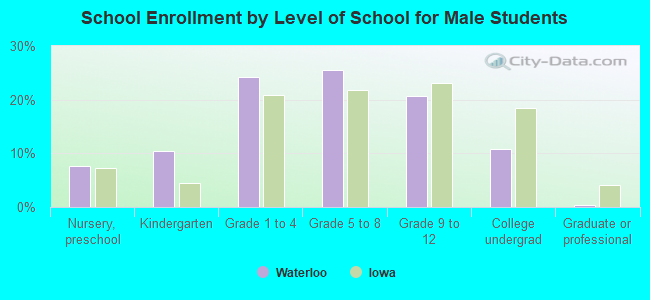
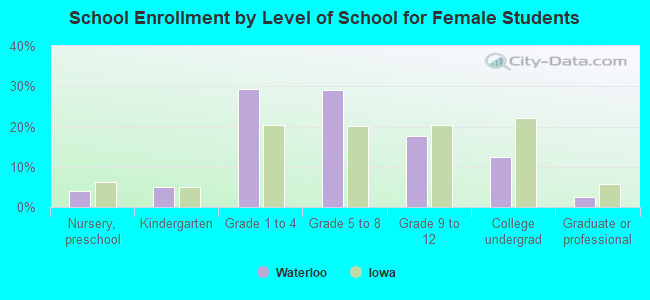
Private vs. public school enrollment:
Students in private schools in grades 1 to 8 (elementary and middle school): 1,005 Students in private schools in grades 9 to 12 (high school): 179 Students in private undergraduate colleges: 70