Housing density: 244 houses/condos per square mile
Median price asked for vacant for-sale houses and condos in 2022 in this county: $309,766.
Median contract rent in 2022: $1,284 (lower quartile is $961, upper quartile is $1,675)
Median rent asked for vacant for-rent units in 2022: $1,134
Median gross rent in Waterford, CT in 2022: $1,503
Housing units in Waterford with a mortgage: 3,582 (431 second mortgage, 464 home equity loan, 9 both second mortgage and home equity loan) Houses without a mortgage: 2,150
In family households: 214,652 (47,484 male householders, 22,378 female householders)
52,173 spouses, 73,395 children (67,999 natural, 1,935 adopted, 3,461 stepchildren), 4,214 grandchildren, 2,063 brothers or sisters, 2,316 parents, foster children, 2,625 other relatives, 6,387 non-relatives
In nonfamily households: 46,621 (18,056 male householders (13,616 living alone)), 19,139 female householders (15,978 living alone)), 9,426 nonrelatives
In group quarters: 12,782 (5,482 institutionalized population)
43,726 married couples with children.
14,569 single-parent households (3,084 men, 11,485 women).
91.1% of residents of Waterford speak English at home.
2.8% of residents speak Spanish at home (58% speak English very well, 34% speak English well, 8% speak English not well).
3.6% of residents speak other Indo-European language at home (72% speak English very well, 22% speak English well, 6% speak English not well).
2.2% of residents speak Asian or Pacific Island language at home (69% speak English very well, 14% speak English well, 15% speak English not well, 1% don't speak English at all).
0.3% of residents speak other language at home (64% speak English very well, 36% speak English well).
Foreign born population: 1,857 (9.1%)
(79.2% of them are naturalized citizens)
Year of entry for the foreign-born population in Waterford, Connecticut
1201995 to March 2000
641990 to 1994
1671985 to 1989
1031980 to 1984
901975 to 1979
901970 to 1974
981965 to 1969
466Before 1965
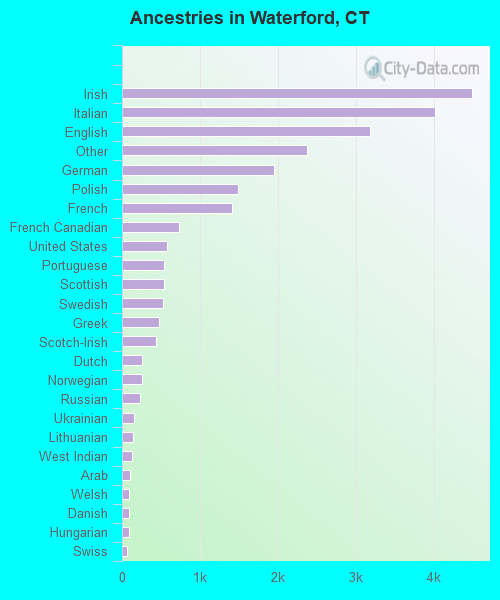
First ancestries reported:
Irish: 4,486 (18.3%)
Italian: 4,012 (16.4%)
English: 3,177 (13.0%)
Other: 2,369 (9.7%)
German: 1,957 (8.0%)
Polish: 1,494 (6.1%)
French: 1,415 (5.8%)
French Canadian: 734 (3.0%)
United States: 583 (2.4%)
Portuguese: 545 (2.2%)
Scottish: 542 (2.2%)
Swedish: 529 (2.2%)
Greek: 481 (2.0%)
Scotch-Irish: 439 (1.8%)
Dutch: 261 (1.1%)
Norwegian: 258 (1.1%)
Russian: 237 (1.0%)
Ukrainian: 153 (0.6%)
Lithuanian: 138 (0.6%)
West Indian: 122 (0.5%)
Arab: 100 (0.4%)
Welsh: 96 (0.4%)
Danish: 86 (0.4%)
Hungarian: 85 (0.3%)
Swiss: 63 (0.3%)
Czech: 39 (0.2%)
Subsaharan African: 37 (0.2%)
Slovak: 27 (0.1%)
Most common places of birth for foreign-born residents (%):
China, excluding Hong Kong and Taiwan
Waterford:
11.2% (134)
Connecticut:
2.5% (9,358)
Canada
Waterford:
9.8% (117)
Connecticut:
5.2% (19,083)
United Kingdom
Waterford:
7.9% (95)
Connecticut:
4.4% (16,395)
Greece
Waterford:
6.8% (82)
Connecticut:
1.2% (4,622)
Philippines
Waterford:
6.3% (75)
Connecticut:
1.7% (6,247)
Italy
Waterford:
5.6% (67)
Connecticut:
7.0% (26,023)
Germany
Waterford:
4.9% (59)
Connecticut:
3.1% (11,432)
Peru
Waterford:
4.9% (59)
Connecticut:
2.1% (7,612)
Other Eastern Europe
Waterford:
4.3% (51)
Connecticut:
2.1% (7,596)
India
Waterford:
3.3% (40)
Connecticut:
4.1% (15,108)
Jamaica
Waterford:
3.3% (39)
Connecticut:
7.2% (26,819)
Cambodia
Waterford:
2.7% (32)
Connecticut:
0.5% (1,723)
France
Waterford:
2.0% (24)
Connecticut:
0.7% (2,742)
Portugal
Waterford:
1.8% (21)
Connecticut:
3.6% (13,234)
Ireland
Waterford:
1.7% (20)
Connecticut:
1.2% (4,344)
Haiti
Waterford:
1.6% (19)
Connecticut:
2.1% (7,902)
Taiwan
Waterford:
1.5% (18)
Connecticut:
0.6% (2,106)
Place of birth for U.S.-born residents:
This state: 11,656
Other state: 6,004
Northeast: 4,239
Midwest: 673
South: 756
West: 336
65% of Waterford residents lived in the same house 5 years ago. Out of people who lived in different houses, 70% lived in this county. Out of people who lived in different counties, 26% lived in Connecticut.
Education attainment for males 25 years and older:
No schooling: 81
Nursery to 4th grade: 15
5th and 6th grade: 42
7th and 8th grade: 124
9th grade: 124
10th grade: 134
11th grade: 92
12th grade, no diploma: 146
High school graduate (or equivalency): 2,175
Less than 1 year of college: 406
Some college more than 1 year, no degree: 617
Associate degree: 500
Bachelor's degree: 1,020
Master's degree: 539
Professional school degree: 191
Doctorate degree: 163
Education attainment for females 25 years and older:
No schooling: 60
Nursery to 4th grade: 27
5th and 6th grade: 32
7th and 8th grade: 255
9th grade: 166
10th grade: 173
11th grade: 105
12th grade, no diploma: 229
High school graduate (or equivalency): 2,262
Less than 1 year of college: 557
Some college more than 1 year, no degree: 781
Associate degree: 688
Bachelor's degree: 1,110
Master's degree: 586
Professional school degree: 180
Doctorate degree: 43
Housing units in structures:
One, detached: 6,762
One, attached: 266
Two: 270
3 or 4: 129
5 to 9: 164
10 to 19: 144
20 to 49: 82
50 or more: 85
Mobile homes: 71
Boats, RVs, vans, etc.: 13
Median worth of mobile homes: $66,264
Housing units lacking complete plumbing facilities: 0.5%
Housing units lacking complete kitchen facilities: 0.2%