Housing density: 941 houses/condos per square mile
Median price asked for vacant for-sale houses and condos in 2022: $7,422,632.
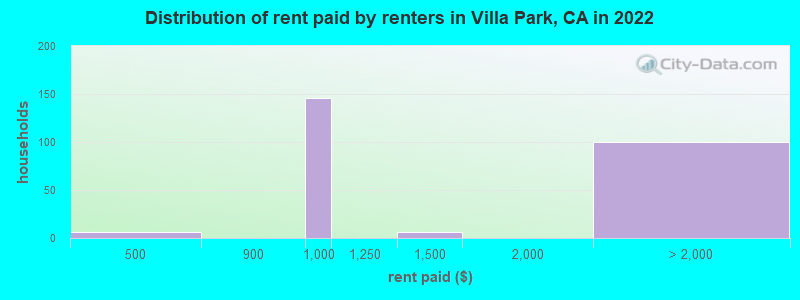
Median gross rent in Villa Park, CA in 2022: $-667,556,345
Housing units in Villa Park with a mortgage: 1,082 (142 second mortgage, 10 home equity loan, 71 both second mortgage and home equity loan) Houses without a mortgage: 8
Median household income for houses/condos with a mortgage: $223,438
Median household income for apartments without a mortgage: $180,596
Size of family households: 845 2-persons, 285 3-persons, 244 4-persons, 131 5-persons, 141 6-persons, 22 7-or-more-persons.
Size of nonfamily households: 223 1-person, 42 2-persons, 13 3-persons.
995 married couples with children.
33 single-parent households (8 men, 25 women).
80.7% of residents of Villa Park speak English at home.
6.0% of residents speak Spanish at home (87% speak English very well, 8% speak English well, 5% speak English not well).
4.0% of residents speak other Indo-European language at home (74% speak English very well, 10% speak English well, 16% speak English not well).
6.0% of residents speak Asian or Pacific Island language at home (75% speak English very well, 17% speak English well, 6% speak English not well, 2% don't speak English at all).
2.6% of residents speak other language at home (100% speak English very well).
Foreign born population: 761 (13.2%)
(88.6% of them are naturalized citizens)
Percentage of workers working in this county: 89.0% Number of people working at home: 627 (26.0% of all workers)
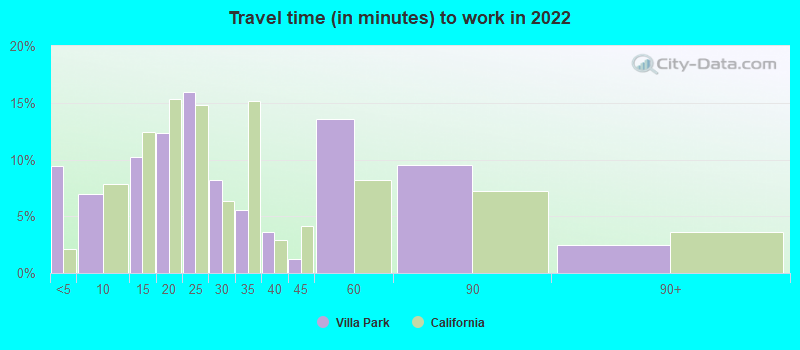
Travel time to work (commute)
Less than 5 minutes: 111
5 to 9 minutes: 155
10 to 14 minutes: 193
15 to 19 minutes: 266
20 to 24 minutes: 311
25 to 29 minutes: 152
30 to 34 minutes: 331
35 to 39 minutes: 56
40 to 44 minutes: 45
45 to 59 minutes: 141
60 to 89 minutes: 38
90 or more minutes: 28
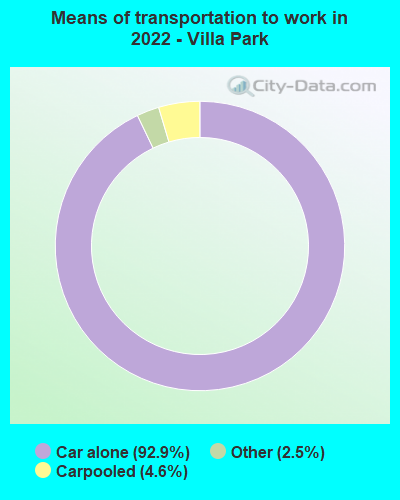
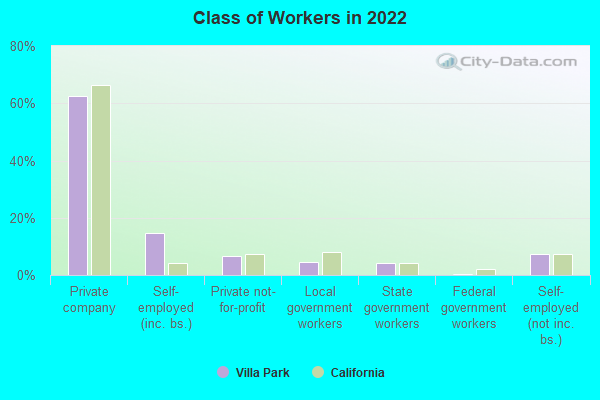
Means of transportation to work:
Drove a car alone: 1,084 (62.4%)
Carpooled: 57 (3.3%)
Taxi: 33 (1.9%)
Worked at home: 627 (36.1%)
Unemployment by race in 2022
Unemployment rate for White non-Hispanic residents
0.6%Males
1.2%Females
Unemployment rate for Black residents
100.0%Males
Unemployment rate for two or more race residents
4.4%Males
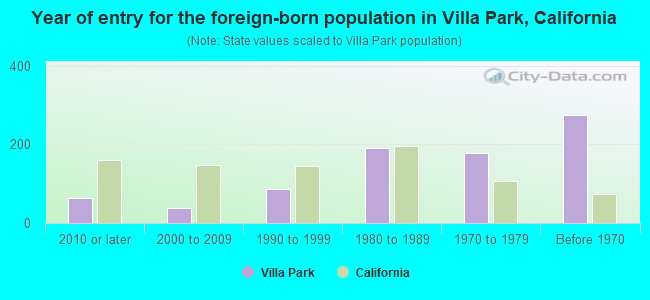
Year of entry for the foreign-born population in Villa Park, California
632010 or later
382000 to 2009
861990 to 1999
1911980 to 1989
1781970 to 1979
275Before 1970
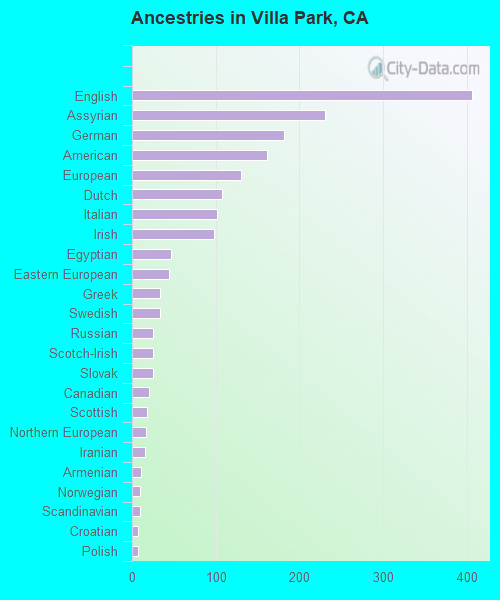
First ancestries reported:
English: 406 (14.0%)
Assyrian: 231 (8.0%)
German: 182 (6.3%)
American: 161 (5.6%)
European: 130 (4.5%)
Dutch: 108 (3.7%)
Italian: 102 (3.5%)
Irish: 98 (3.4%)
Egyptian: 47 (1.6%)
Eastern European: 44 (1.5%)
Greek: 34 (1.2%)
Swedish: 33 (1.1%)
Russian: 25 (0.9%)
Scotch-Irish: 25 (0.9%)
Slovak: 25 (0.9%)
Canadian: 20 (0.7%)
Scottish: 18 (0.6%)
Northern European: 17 (0.6%)
Iranian: 15 (0.5%)
Armenian: 11 (0.4%)
Norwegian: 10 (0.3%)
Scandinavian: 10 (0.3%)
Croatian: 7 (0.2%)
Polish: 7 (0.2%)
Australian: 3 (0.1%)
French: 3 (0.1%)
Most common places of birth for foreign-born residents (%):
Vietnam
Villa Park:
14.8% (113)
California:
4.9% (512,335)
India
Villa Park:
13.7% (104)
California:
5.2% (539,184)
Ecuador
Villa Park:
7.8% (59)
California:
0.2% (21,276)
Iran
Villa Park:
5.9% (45)
California:
2.0% (206,004)
Taiwan
Villa Park:
5.1% (39)
California:
1.7% (176,274)
Italy
Villa Park:
5.1% (39)
California:
0.3% (31,439)
Iraq
Villa Park:
5.0% (38)
California:
0.4% (40,941)
China, excluding Hong Kong and Taiwan
Villa Park:
5.0% (38)
California:
6.6% (684,672)
Egypt
Villa Park:
4.9% (37)
California:
0.4% (42,718)
Canada
Villa Park:
4.6% (35)
California:
1.2% (127,477)
Mexico
Villa Park:
3.9% (30)
California:
37.2% (3,881,193)
Korea
Villa Park:
3.3% (25)
California:
3.0% (315,248)
Scotland
Villa Park:
3.0% (23)
California:
0.1% (8,444)
Greece
Villa Park:
3.0% (23)
California:
0.1% (10,538)
Russia
Villa Park:
2.6% (20)
California:
0.7% (71,932)
Hong Kong
Villa Park:
1.8% (14)
California:
1.0% (105,215)
Philippines
Villa Park:
1.7% (13)
California:
7.8% (818,297)
Place of birth for U.S.-born residents:
This state: 3,651
Other state: 1,180
Northeast: 311
Midwest: 317
South: 220
West: 329
88.2% of Villa Park residents lived in the same house 1 years ago. Out of people who lived in different houses, 39.5% lived in this county. Out of people who lived in different counties, 93.0% lived in California.
Villa Park:
88.2%
State average:
88.9%
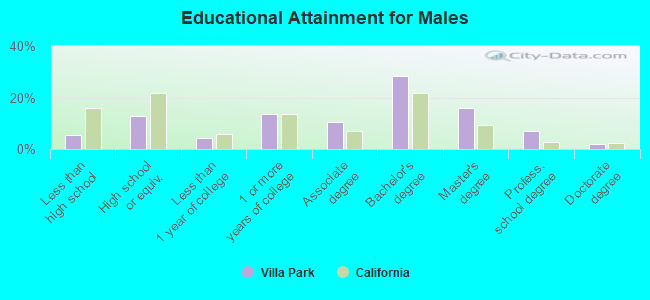
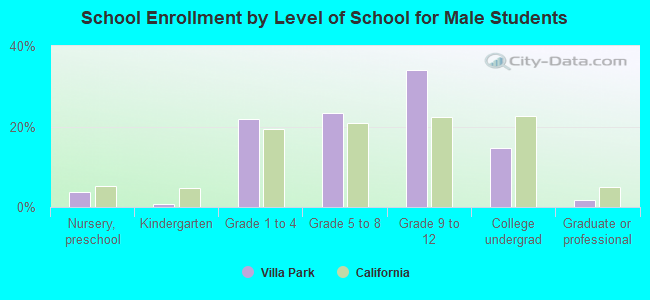
Education attainment for males 25 years and older:
No schooling: 22
Nursery to 4th grade: 0
5th and 6th grade: 33
7th and 8th grade: 22
9th grade: 6
10th grade: 0
11th grade: 0
12th grade, no diploma: 26
High school graduate (or equivalency): 254
Less than 1 year of college: 82
Some college more than 1 year, no degree: 268
Associate degree: 205
Bachelor's degree: 558
Master's degree: 312
Professional school degree: 133
Doctorate degree: 36
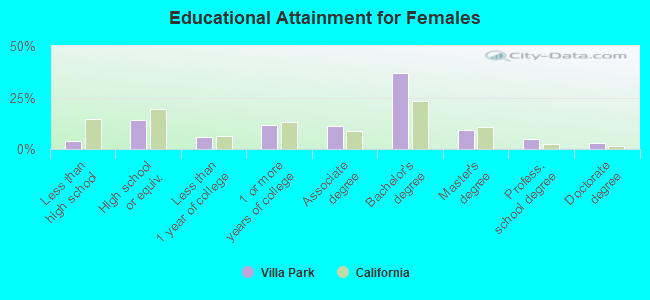
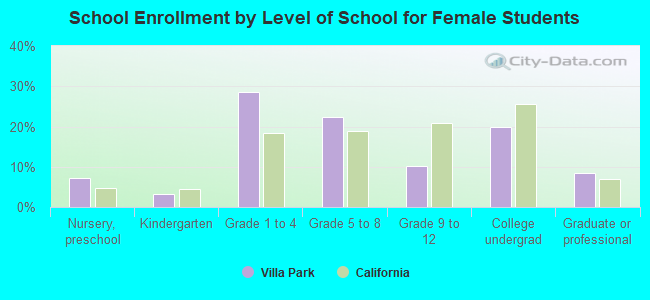
Education attainment for females 25 years and older:
No schooling: 65
Nursery to 4th grade: 0
5th and 6th grade: 8
7th and 8th grade: 0
9th grade: 15
10th grade: 8
11th grade: 0
12th grade, no diploma: 0
High school graduate (or equivalency): 338
Less than 1 year of college: 135
Some college more than 1 year, no degree: 274
Associate degree: 268
Bachelor's degree: 875
Master's degree: 215
Professional school degree: 119
Doctorate degree: 64
Housing units in structures:
One, detached: 1,914
One, attached: 17
20 to 49: 6
Mobile homes: 46
Housing units lacking complete kitchen facilities in 2022: 0.2%
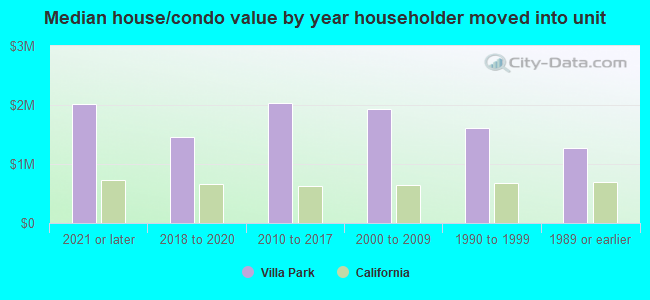
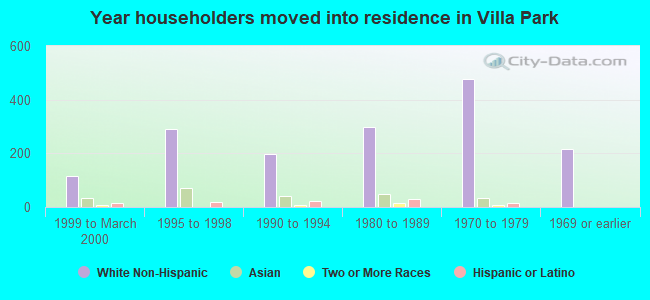
House/condo owner moved in on average 19 years ago