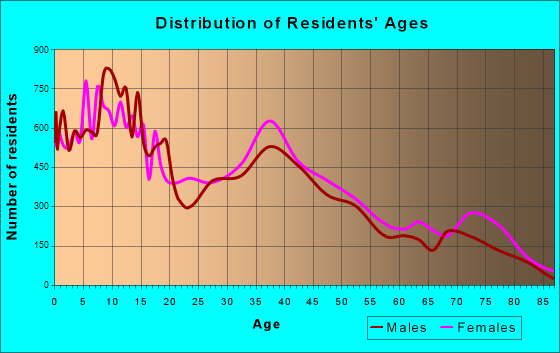
Victorville, CA (California) Houses and Residents
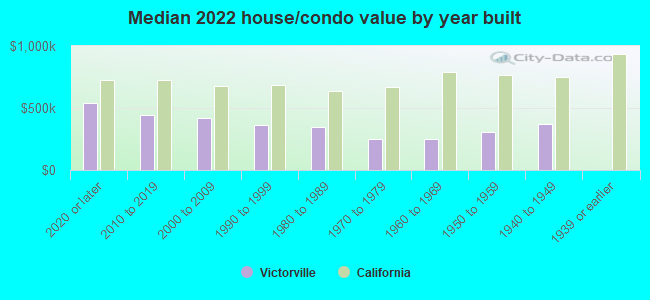
| Victorville: | $379,800 |
| California: | $715,900 |
Total population: 121,901 (Urban population: 63,240 (63,094 inside urbanized areas, 146 inside urban clusters), Rural population: 1,276 (all nonfarm))
Houses: 37,710 (36,647 occupied: 21,530 owner occupied, 15,117 renter occupied)
| % of renters here: | 41% |
| State: | 44% |
Housing density: 518 houses/condos per square mile
Median price asked for vacant for-sale houses and condos in 2022: $259,247.
Median contract rent in 2022: $1,334 (lower quartile is $1,015, upper quartile is $1,810)
Median rent asked for vacant for-rent units in 2022: $953
Median gross rent in Victorville, CA in 2022: $1,689
Housing units in Victorville with a mortgage: 16,156 (1,048 second mortgage, 0 home equity loan, 846 both second mortgage and home equity loan)
Houses without a mortgage: 126
Median household income for houses/condos with a mortgage: $86,013
Median household income for apartments without a mortgage: $67,024
Median monthly housing costs: $1,712
Compare current foreclosures in Victorville, CA:
| Photo | Address | Area | Beds / Baths | Price | Details |
|---|---|---|---|---|---|

|
#1
Coachman Rd
Victorville, CA 92394
|
2,961 sq. feet
|
3 baths 4 beds |
show details | |

|
#2
El Dorado Pl
Victorville, CA 92392
|
1,585 sq. feet
|
2 baths 4 beds |
show details | |

|
#3
Foxfire Rd
Victorville, CA 92392
|
1,257 sq. feet
|
2 baths 3 beds |
show details | |

|
#4
Roadrunner Ln
Victorville, CA 92392
|
2,328 sq. feet
|
2 baths 4 beds |
show details | |

|
#5
Ponderosa Ranch Rd
Victorville, CA 92392
|
1,697 sq. feet
|
2 baths 4 beds |
show details | |

|
#6
Jasmine Ct
Victorville, CA 92395
|
1,407 sq. feet
|
2 baths 3 beds |
show details | |

|
#7
Verde St
Victorville, CA 92395
|
1,052 sq. feet
|
1 baths 3 beds |
show details | |

|
#8
Butler Peak Ct
Victorville, CA 92394
|
4,023 sq. feet
|
4 baths 5 beds |
show details | |

|
#9
Thunderbird Pl
Victorville, CA 92392
|
2,385 sq. feet
|
2 baths 4 beds |
show details | |

|
#10
Yellowstone Ave
Victorville, CA 92395
|
2,786 sq. feet
|
3 baths 4 beds |
show details |
| Photo | Address | Area | Beds / Baths | Price | Details |
|---|---|---|---|---|---|

|
#11
Shorewood Way
Victorville, CA 92392
|
2,408 sq. feet
|
2 baths 4 beds |
show details | |

|
#12
Teton St
Victorville, CA 92395
|
1,632 sq. feet
|
2 baths 3 beds |
show details | |

|
#13
Tatum Ct
Victorville, CA 92395
|
838 sq. feet
|
1 baths 2 beds |
show details | |

|
#14
Admirals Bay St
Victorville, CA 92392
|
2,300 sq. feet
|
3 baths 4 beds |
show details | |

|
#15
Sunny Point St
Victorville, CA 92394
|
1,911 sq. feet
|
2 baths 3 beds |
show details | |

|
#16
Pamela St
Victorville, CA 92395
|
1,449 sq. feet
|
2 baths 4 beds |
show details | |

|
#17
Rain Lily Ct
Victorville, CA 92394
|
1,602 sq. feet
|
2 baths 3 beds |
show details | |

|
#18
Claremore St
Victorville, CA 92392
|
1,747 sq. feet
|
2 baths 3 beds |
show details | |

|
#19
Naples Ln
Victorville, CA 92394
|
1,923 sq. feet
|
3 baths 5 beds |
show details | |

|
#20
Bel Air Dr
Victorville, CA 92395
|
1,600 sq. feet
|
2 baths 3 beds |
show details |
| Photo | Address | Area | Beds / Baths | Price | Details |
|---|---|---|---|---|---|

|
#21
Rocca Ct
Victorville, CA 92395
|
1,361 sq. feet
|
2 baths 3 beds |
show details | |

|
#22
Butler Peak Ct
Victorville, CA 92394
|
4,023 sq. feet
|
4 baths 5 beds |
show details | |

|
#23
Spicewood Ct
Victorville, CA 92392
|
2,021 sq. feet
|
2 baths 4 beds |
show details | |

|
#24
Stoddard Wells Rd # 88
Victorville, CA 92395
|
1,056 sq. feet
|
2 baths 2 beds |
show details | |

|
#25
Camellia Rd
Victorville, CA 92392
|
1,510 sq. feet
|
2 baths 3 beds |
show details | |

|
#26
Sequoia Rd
Victorville, CA 92392
|
1,489 sq. feet
|
2 baths 3 beds |
show details | |

|
#27
Thunderhawk Pl
Victorville, CA 92392
|
2,669 sq. feet
|
3 baths 5 beds |
show details | |

|
#28
Gateside Ct
Victorville, CA 92394
|
994 sq. feet
|
2 baths 3 beds |
show details | |

|
#29
Seneca Rd Spc 341
Victorville, CA 92392
|
1,440 sq. feet
|
2 baths 3 beds |
show details | |

|
#30
Village Dr
Victorville, CA 92394
|
1,502 sq. feet
|
2 baths 3 beds |
show details |
| Photo | Address | Area | Beds / Baths | Price | Details |
|---|---|---|---|---|---|

|
#31
La Paz Dr
Victorville, CA 92395
|
1,936 sq. feet
|
2 baths 4 beds |
show details | |

|
#32
Teton St
Victorville, CA 92395
|
1,383 sq. feet
|
2 baths 3 beds |
show details | |

|
#33
Sunbird Ln
Victorville, CA 92392
|
1,585 sq. feet
|
2 baths 4 beds |
show details | |

|
#34
Desert Knoll Dr
Victorville, CA 92395
|
2,332 sq. feet
|
2 baths 4 beds |
show details | |

|
#35
Paso Robles Dr
Victorville, CA 92392
|
2,033 sq. feet
|
2 baths 6 beds |
show details | |

|
#36
Roundoak Way
Victorville, CA 92392
|
1,606 sq. feet
|
2 baths 3 beds |
show details | |

|
#37
Harwood Rd
Victorville, CA 92392
|
1,736 sq. feet
|
2 baths 3 beds |
show details | |

|
#38
Clovis St
Victorville, CA 92394
|
1,413 sq. feet
|
2 baths 3 beds |
show details | |

|
#39
Dandelion Way
Victorville, CA 92392
|
2,817 sq. feet
|
2 baths 3 beds |
show details | |

|
#40
Ventura Ln
Victorville, CA 92394
|
1,893 sq. feet
|
3 baths 4 beds |
show details |
| Photo | Address | Area | Beds / Baths | Price | Details |
|---|---|---|---|---|---|

|
#41
Fern Pine Rd
Victorville, CA 92392
|
2,741 sq. feet
|
3 baths 5 beds |
show details | |

|
#42
La Paz Dr
Victorville, CA 92395
|
1,420 sq. feet
|
2 baths 3 beds |
show details | |

|
#43
Sunset Gardens Ct
Victorville, CA 92394
|
3,439 sq. feet
|
4 baths 5 beds |
show details | |

|
#44
Camino Lindo
Victorville, CA 92392
|
2,104 sq. feet
|
2 baths 3 beds |
show details | |

|
#45
Galaxy St
Victorville, CA 92392
|
1,517 sq. feet
|
2 baths 3 beds |
show details | |

|
#46
Shorewood Way
Victorville, CA 92392
|
2,408 sq. feet
|
2 baths 4 beds |
show details | |

|
#47
Bullet Ave
Victorville, CA 92392
|
1,915 sq. feet
|
2 baths 3 beds |
show details | |

|
#48
Buttermilk Rd
Victorville, CA 92392
|
2,943 sq. feet
|
4 baths 6 beds |
show details | |

|
#49
Santa Fe Trl
Victorville, CA 92392
|
1,819 sq. feet
|
3 baths 4 beds |
show details | |

|
Check over 1 million property listings on Foreclosure.com!
|
browse all offers | |||

Latest news about housing in Victorville, CA collected exclusively by city-data.com from local newspapers, TV, and radio stations

 | Applied to rent a house at Spring Valley Lake in Victorville (3 replies) |
| CA Cities(Pop 65,000+) by Median Household Income, 2019 (8 replies) |
| How to get a 1wy ride from San Diego Ca to Victorville Ca without driving (16 replies) |
| SF/Bay Area Crime Thread (1410 replies) |
| Prop 13 (megatopic) (1358 replies) |
| La Mirage apartments in Victorville,CA (2 replies) |
Median year apartment built: 1994
Household type by relationship:
Households: 137,224- Male householders: 17,507 (1,799 living alone), Female householders: 19,140 (3,339 living alone)
17,189 spouses (17,020 opposite-sex spouses), 3,211 unmarried partners, (3,044 opposite-sex unmarried partners), 52,193 children (48,645 natural, 838 adopted, 2,710 stepchildren), 7,666 grandchildren, 2,036 brothers or sisters, 3,442 parents, 805 foster children, 5,892 other relatives, 3,518 non-relatives
- In group quarters: 4,625
Size of family households: 7,816 2-persons, 5,759 3-persons, 5,849 4-persons, 4,605 5-persons, 2,581 6-persons, 3,176 7-or-more-persons.
Size of nonfamily households: 5,138 1-person, 1,127 2-persons, 420 3-persons, 176 4-persons.
21,048 married couples with children.
11,946 single-parent households (4,381 men, 7,565 women).
56.9% of residents of Victorville speak English at home.
37.4% of residents speak Spanish at home (69% speak English very well, 16% speak English well, 11% speak English not well, 4% don't speak English at all).
0.9% of residents speak other Indo-European language at home (82% speak English very well, 11% speak English well, 7% speak English not well, 1% don't speak English at all).
3.3% of residents speak Asian or Pacific Island language at home (49% speak English very well, 31% speak English well, 11% speak English not well, 9% don't speak English at all).
0.9% of residents speak other language at home (75% speak English very well, 19% speak English well, 5% speak English not well, 1% don't speak English at all).
Foreign born population: 26,613 (19.4%)
(48.1% of them are naturalized citizens)
| Here: | 6.8 |
| State: | 6.0 |
| Here: | 4.9 |
| State: | 3.9 |
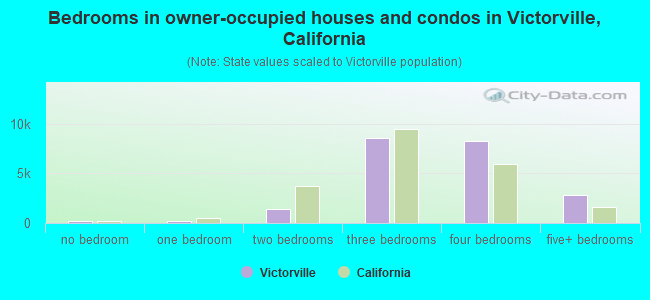
- Bedrooms in owner-occupied houses and condos in Victorville, California
- 184no bedroom
- 1931 bedroom
- 1,4632 bedrooms
- 8,5893 bedrooms
- 8,2544 bedrooms
- 2,8475+ bedrooms
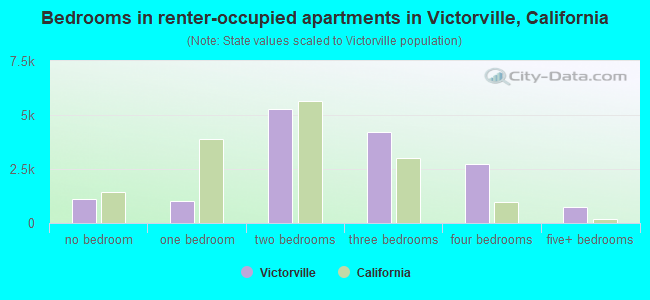
- Bedrooms in renter-occupied apartments in Victorville, California
- 1,119no bedroom
- 1,0301 bedroom
- 5,2772 bedrooms
- 4,1943 bedrooms
- 2,7544 bedrooms
- 7435+ bedrooms
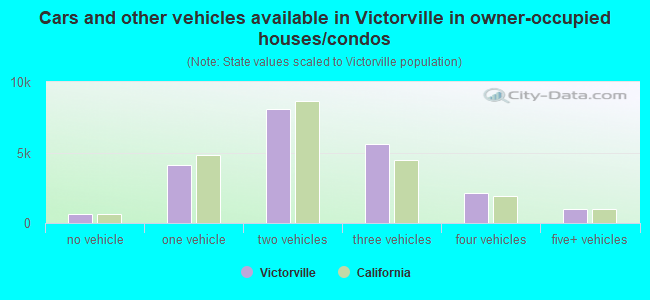
- Cars and other vehicles available in Victorville in owner-occupied houses/condos
- 610no vehicle
- 4,1351 vehicle
- 8,0752 vehicles
- 5,6313 vehicles
- 2,1154 vehicles
- 9645+ vehicles
- Cars and other vehicles available in Victorville in renter-occupied apartments
- 1,392no vehicle
- 5,1261 vehicle
- 5,4932 vehicles
- 2,1003 vehicles
- 4964 vehicles
- 5105+ vehicles
- Rooms in owner-occupied houses in Victorville, California
- 1491 room
- 02 rooms
- 4883 rooms
- 1,5224 rooms
- 2,9685 rooms
- 4,3996 rooms
- 4,5927 rooms
- 4,2748 rooms
- 3,1389+ rooms
- Rooms in renter-occupied apartments in Victorville, California
- 1,0651 room
- 692 rooms
- 1,3693 rooms
- 3,8074 rooms
- 2,8195 rooms
- 2,2206 rooms
- 1,6077 rooms
- 1,5138 rooms
- 6489+ rooms
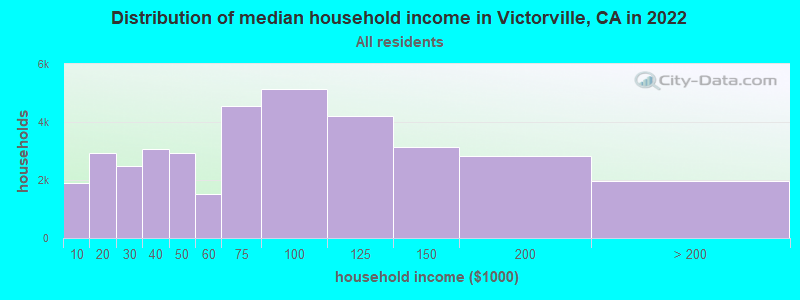
Victorville, CA household income distribution

- 1,887Less than $10,000
- 2,928$10,000 to $19,999
- 2,473$20,000 to $29,999
- 3,078$30,000 to $39,999
- 2,947$40,000 to $49,999
- 1,511$50,000 to $59,999
- 4,544$60,000 to $74,999
- 5,138$75,000 to $99,999
- 4,216$100,000 to $124,999
- 3,137$125,000 to $149,999
- 2,816$150,000 to $199,999
- 1,972$200,000 or more
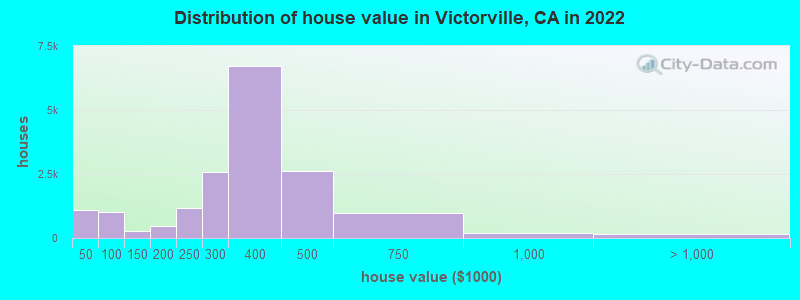
Home value of owner - occupied houses in 2022 in Victorville, CA
-
- 556Less than $10,000
- 17$10,000 to $14,999
- 145$15,000 to $19,999
- 83$20,000 to $24,999
- 66$25,000 to $29,999
- 24$30,000 to $34,999
- 126$35,000 to $39,999
- 92$40,000 to $49,999
- 406$50,000 to $59,999
- 84$60,000 to $69,999
- 179$70,000 to $79,999
- 116$80,000 to $89,999
- 147$90,000 to $99,999
- 151$100,000 to $124,999
- 110$125,000 to $149,999
- 136$150,000 to $174,999
- 333$175,000 to $199,999
- 1,182$200,000 to $249,999
- 2,576$250,000 to $299,999
- 6,720$300,000 to $399,999
- 2,606$400,000 to $499,999
- 969$500,000 to $749,999
- 193$750,000 to $999,999
- 41$1,000,000 to $1,499,999
- 44$1,500,000 to $1,999,999
- 73$2,000,000 or more
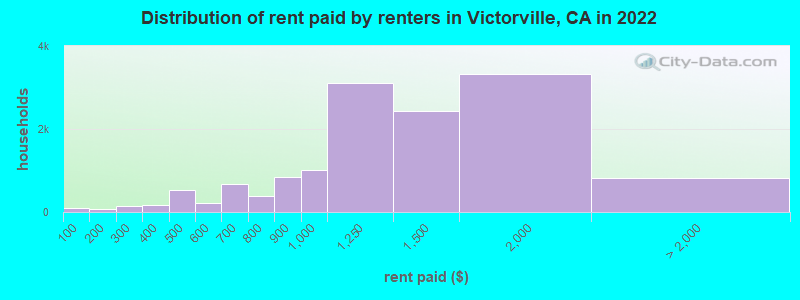
Rent paid by renters in 2022 in Victorville, CA
-
- 103Less than $100
- 35$100 to $149
- 38$150 to $199
- 110$200 to $249
- 27$250 to $299
- 132$300 to $349
- 30$350 to $399
- 401$400 to $449
- 118$450 to $499
- 56$500 to $549
- 148$550 to $599
- 253$600 to $649
- 425$650 to $699
- 153$700 to $749
- 231$750 to $799
- 833$800 to $899
- 1,012$900 to $999
- 3,111$1,000 to $1,249
- 2,444$1,250 to $1,499
- 3,336$1,500 to $1,999
- 422$2,000 to $2,499
- 65$2,500 to $2,999
- 6$3,000 to $3,499
- 26$3,500 or more
- 297No cash rent
Percentage of workers working in this county: 85.6%
Number of people working at home: 5,585 (11.2% of all workers)
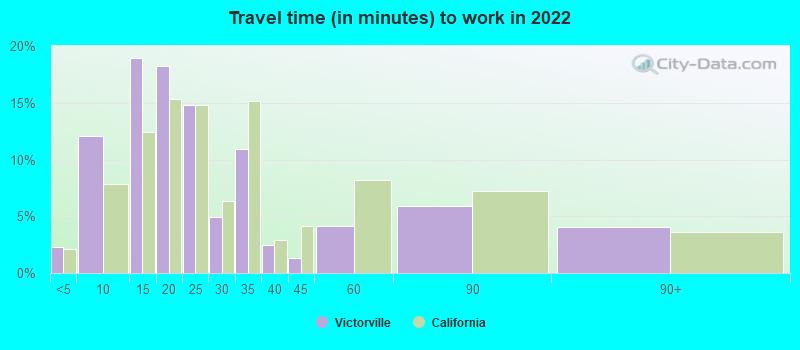
Travel time to work (commute)
- Less than 5 minutes: 1,031
- 5 to 9 minutes: 3,547
- 10 to 14 minutes: 6,565
- 15 to 19 minutes: 4,666
- 20 to 24 minutes: 4,936
- 25 to 29 minutes: 1,679
- 30 to 34 minutes: 2,557
- 35 to 39 minutes: 472
- 40 to 44 minutes: 1,331
- 45 to 59 minutes: 5,405
- 60 to 89 minutes: 7,027
- 90 or more minutes: 5,257
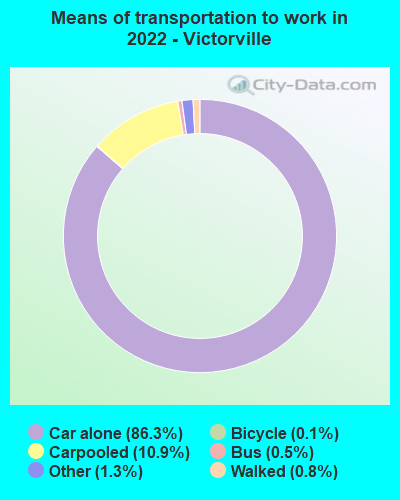
Means of transportation to work:
- Drove a car alone: 27,120 (73.0%)
- Carpooled: 3,698 (10.0%)
- Bus: 164 (0.4%)
- Taxi: 472 (1.3%)
- Bicycle: 28 (0.1%)
- Walked: 275 (0.7%)
- Worked at home: 5,585 (15.0%)
- Unemployment by race in 2022
- Unemployment rate for White non-Hispanic residents
- 24.2%Males
- 5.3%Females
- Unemployment rate for Black residents
- 13.7%Males
- 17.7%Females
- Unemployment rate for American Indian and Alaska Native residents
- 17.8%Males
- 10.2%Females
- Unemployment rate for Asian residents
- 5.2%Males
- 10.7%Females
- Unemployment rate for other race residents
- 5.1%Males
- 6.7%Females
- Unemployment rate for two or more race residents
- 5.1%Males
- 11.8%Females
- Unemployment rate for Hispanic or Latino residents
- 7.3%Males
- 13.2%Females
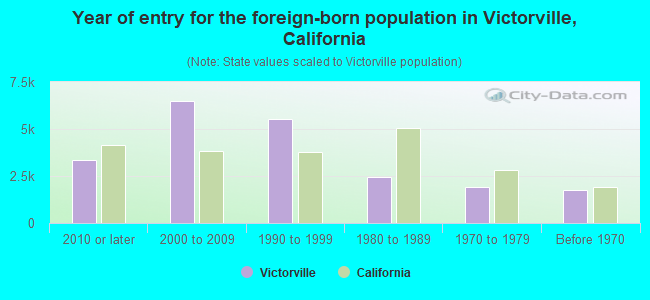
- Year of entry for the foreign-born population in Victorville, California
- 3,3322010 or later
- 6,4722000 to 2009
- 5,5321990 to 1999
- 2,4631980 to 1989
- 1,9201970 to 1979
- 1,762Before 1970
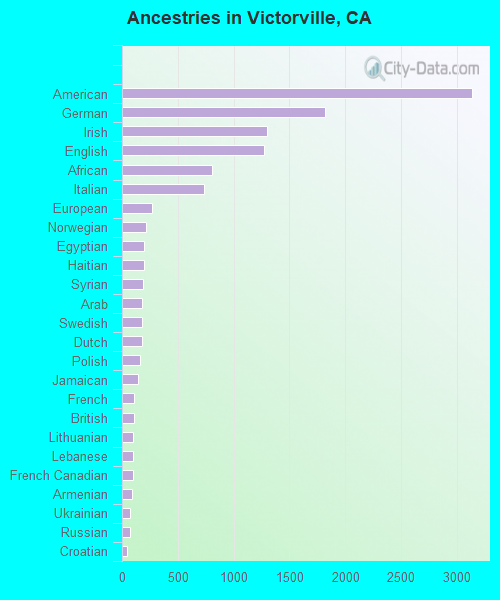
First ancestries reported:
- American: 3,133 (3.9%)
- German: 1,818 (2.3%)
- Irish: 1,298 (1.6%)
- English: 1,274 (1.6%)
- African: 808 (1.0%)
- Italian: 738 (0.9%)
- European: 273 (0.3%)
- Norwegian: 212 (0.3%)
- Egyptian: 197 (0.2%)
- Haitian: 196 (0.2%)
- Syrian: 184 (0.2%)
- Arab: 182 (0.2%)
- Swedish: 181 (0.2%)
- Dutch: 176 (0.2%)
- Polish: 163 (0.2%)
- Jamaican: 144 (0.2%)
- French: 112 (0.1%)
- British: 109 (0.1%)
- Lithuanian: 103 (0.1%)
- Lebanese: 101 (0.1%)
- French Canadian: 97 (0.1%)
- Armenian: 92 (0.1%)
- Ukrainian: 74 (0.09%)
- Russian: 70 (0.09%)
- Croatian: 46 (0.06%)
- Scottish: 44 (0.06%)
- Swiss: 43 (0.05%)
- Hungarian: 40 (0.05%)
- Scandinavian: 39 (0.05%)
- Eastern European: 38 (0.05%)
- Portuguese: 36 (0.05%)
- Northern European: 33 (0.04%)
- Jordanian: 23 (0.03%)
- Nigerian: 22 (0.03%)
- Australian: 19 (0.02%)
- Scotch-Irish: 19 (0.02%)
- Ghanaian: 18 (0.02%)
- Sudanese: 15 (0.02%)
- Austrian: 12 (0.02%)
- Iranian: 12 (0.02%)
- Czech: 11 (0.01%)
- Welsh: 11 (0.01%)
- Basque: 7 (0.01%)
- Czechoslovakian: 6 (0.01%)
Most common places of birth for foreign-born residents (%):
| Victorville: | 59.4% (15,467) |
| California: | 37.2% (3,881,193) |
| Victorville: | 10.2% (2,661) |
| California: | 7.8% (818,297) |
| Victorville: | 7.2% (1,886) |
| California: | 4.2% (440,287) |
| Victorville: | 3.2% (837) |
| California: | 2.8% (290,436) |
Place of birth for U.S.-born residents:
- This state: 90,665
- Other state: 18,045
- Northeast: 3,271
- Midwest: 4,355
- South: 6,971
- West: 3,448
88.3% of Victorville residents lived in the same house 1 years ago.
Out of people who lived in different houses, 36.9% lived in this county.
Out of people who lived in different counties, 76.5% lived in California.
| Victorville: | 88.3% |
| State average: | 88.9% |
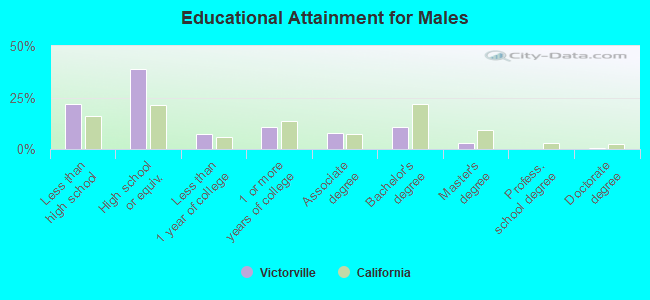
Education attainment for males 25 years and older:
- No schooling: 751
- Nursery to 4th grade: 532
- 5th and 6th grade: 881
- 7th and 8th grade: 759
- 9th grade: 768
- 10th grade: 724
- 11th grade: 2,246
- 12th grade, no diploma: 1,526
- High school graduate (or equivalency): 14,634
- Less than 1 year of college: 2,725
- Some college more than 1 year, no degree: 3,996
- Associate degree: 2,981
- Bachelor's degree: 3,994
- Master's degree: 1,146
- Professional school degree: 47
- Doctorate degree: 140
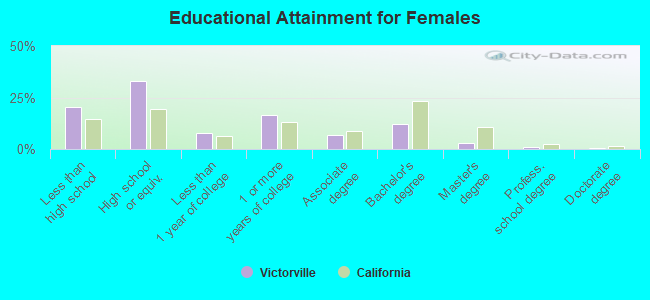
Education attainment for females 25 years and older:
- No schooling: 2,093
- Nursery to 4th grade: 356
- 5th and 6th grade: 1,553
- 7th and 8th grade: 465
- 9th grade: 793
- 10th grade: 715
- 11th grade: 1,418
- 12th grade, no diploma: 1,052
- High school graduate (or equivalency): 13,472
- Less than 1 year of college: 3,134
- Some college more than 1 year, no degree: 6,700
- Associate degree: 2,723
- Bachelor's degree: 4,917
- Master's degree: 1,209
- Professional school degree: 344
- Doctorate degree: 125
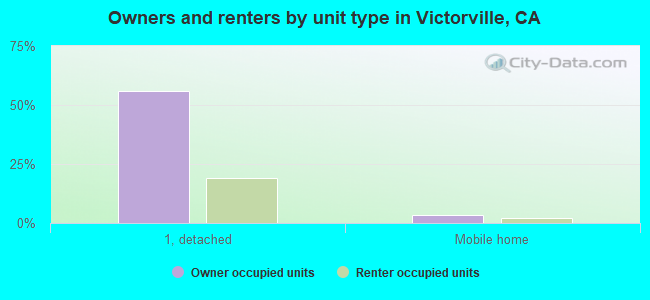
Housing units in structures:
- One, detached: 28,373
- One, attached: 308
- Two: 103
- 3 or 4: 1,422
- 5 to 9: 1,897
- 10 to 19: 769
- 20 to 49: 491
- 50 or more: 2,739
- Mobile homes: 1,575
- Boats, RVs, vans, etc.: 33
Median worth of mobile homes: $195,900
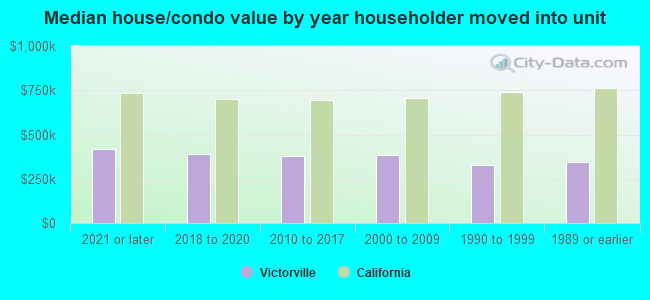
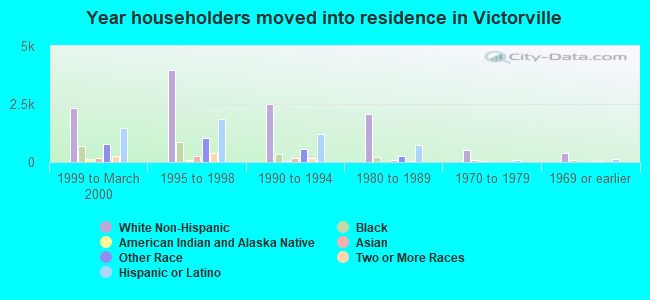
House/condo owner moved in on average 9 years ago
Renter moved in on average 3 years ago
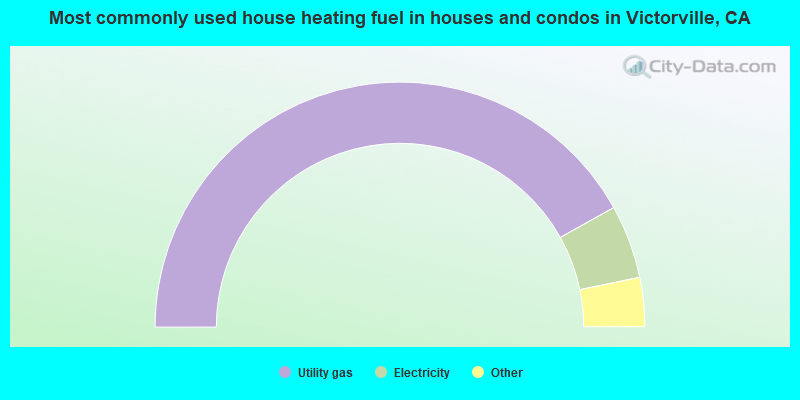
- 83.8%Utility gas
- 9.7%Electricity
- 3.2%Solar energy
- 1.3%Wood
- 1.0%No fuel used
- 1.0%Bottled, tank, or LP gas
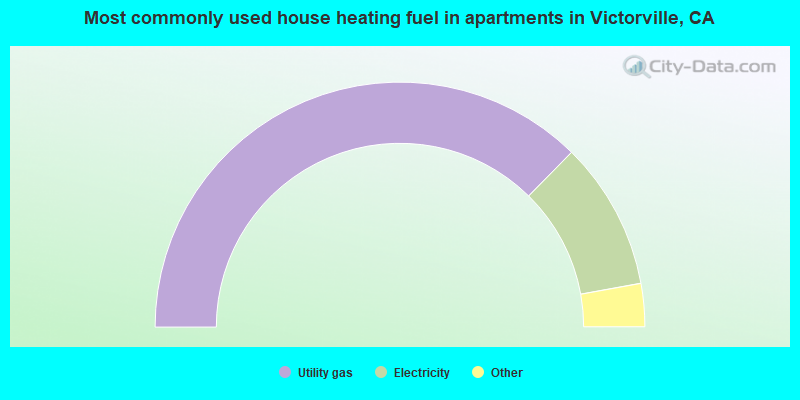
- 74.8%Utility gas
- 19.6%Electricity
- 3.0%Bottled, tank, or LP gas
- 1.2%Solar energy
- 0.8%Wood
- 0.6%No fuel used
- 0.1%Other fuel
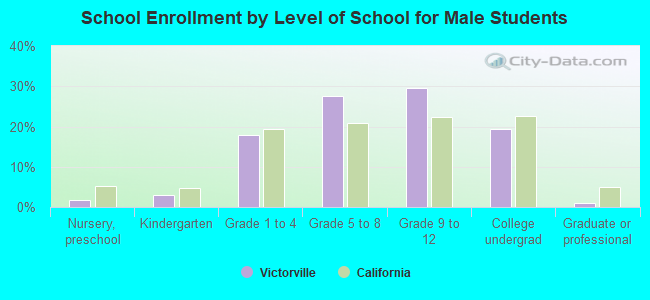
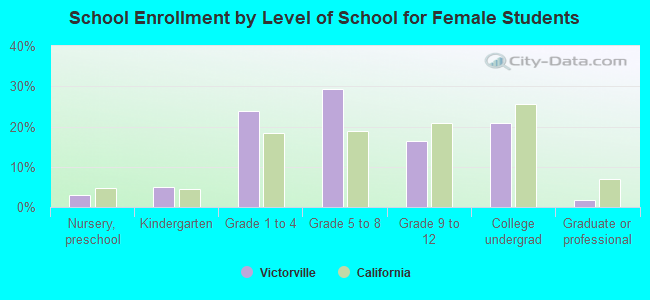
Private vs. public school enrollment:
| Here: | 3.7% |
| California: | 10.5% |
| Here: | 3.3% |
| California: | 8.5% |
| Here: | 20.1% |
| California: | 15.9% |