Ventura, CA (California) Houses and Residents
| Ventura: | $773,958 |
| California: | $715,900 |
Total population: 110,873 (Urban population: 104,328, Rural population: 1,905 (115 farm, 1,790 nonfarm))
Houses: 41,811 (40,310 occupied: 23,749 owner occupied, 16,561 renter occupied)
| % of renters here: | 41% |
| State: | 44% |
Housing density: 336 houses/condos per square mile
Median price asked for vacant for-sale houses and condos in 2022 in this county: $1,328,053.
Median contract rent in 2022: $1,937 (lower quartile is $1,423, upper quartile is over $2,000)
Median rent asked for vacant for-rent units in 2022: $2,220
Median gross rent in Ventura, CA in 2022: over $2,000
Housing units in Ventura with a mortgage: 15,070 (2,242 second mortgage, 1,493 home equity loan, 68 both second mortgage and home equity loan)
Houses without a mortgage: 4,194


Household type by relationship:
Households: 812,718- In family households: 718,629 (142,676 male householders, 54,502 female householders)
150,512 spouses, 259,236 children (244,302 natural, 5,026 adopted, 9,908 stepchildren), 21,818 grandchildren, 12,267 brothers or sisters, 10,207 parents, foster children, 22,537 other relatives, 34,534 non-relatives
- In nonfamily households: 94,089 (31,428 male householders (22,021 living alone)), 38,314 female householders (31,016 living alone)), 24,347 nonrelatives
- In group quarters: 10,600 (3,855 institutionalized population)
151,560 married couples with children.
36,351 single-parent households (10,187 men, 26,164 women).
78.2% of residents of Ventura speak English at home.
17.1% of residents speak Spanish at home (55% speak English very well, 21% speak English well, 15% speak English not well, 9% don't speak English at all).
2.3% of residents speak other Indo-European language at home (74% speak English very well, 20% speak English well, 6% speak English not well).
2.0% of residents speak Asian or Pacific Island language at home (55% speak English very well, 31% speak English well, 13% speak English not well, 2% don't speak English at all).
0.4% of residents speak other language at home (68% speak English very well, 13% speak English well, 11% speak English not well, 8% don't speak English at all).
Foreign born population: 16,809 (14.3%)
(54.7% of them are naturalized citizens)
| Here: | 5.2 |
| State: | 6.0 |
| Here: | 4.1 |
| State: | 3.9 |

- Bedrooms in owner-occupied houses and condos in Ventura, California
- 284no bedroom
- 1,0281 bedroom
- 5,6422 bedrooms
- 9,9473 bedrooms
- 5,8414 bedrooms
- 1,0075+ bedrooms

- Bedrooms in renter-occupied apartments in Ventura, California
- 1,592no bedroom
- 5,0861 bedroom
- 6,2682 bedrooms
- 2,7573 bedrooms
- 7874 bedrooms
- 715+ bedrooms

- Cars and other vehicles available in Ventura in owner-occupied houses/condos
- 720no vehicle
- 6,5191 vehicle
- 10,8342 vehicles
- 4,1183 vehicles
- 1,1394 vehicles
- 4195+ vehicles

- Cars and other vehicles available in Ventura in renter-occupied apartments
- 2,065no vehicle
- 7,2521 vehicle
- 5,5942 vehicles
- 1,3283 vehicles
- 2364 vehicles
- 865+ vehicles

- Rooms in owner-occupied houses in Ventura, California
- 1191 room
- 5102 rooms
- 1,1593 rooms
- 2,2424 rooms
- 5,3205 rooms
- 6,3406 rooms
- 4,6257 rooms
- 2,1508 rooms
- 1,2849+ rooms

- Rooms in renter-occupied apartments in Ventura, California
- 1,1251 room
- 2,3402 rooms
- 3,6243 rooms
- 4,4884 rooms
- 2,6195 rooms
- 1,4636 rooms
- 6027 rooms
- 1928 rooms
- 1089+ rooms


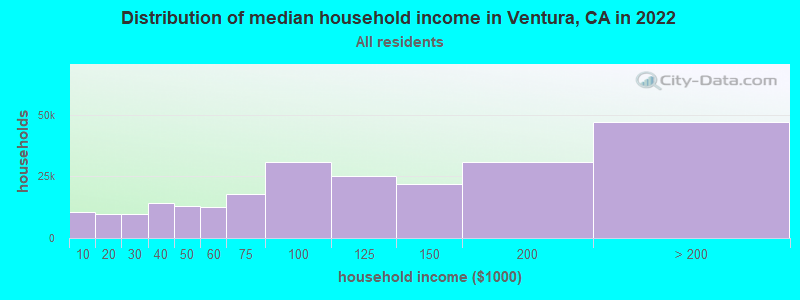
Ventura, CA household income distribution

- 10,373Less than $10,000
- 9,771$10,000 to $19,999
- 9,580$20,000 to $29,999
- 14,313$30,000 to $39,999
- 13,177$40,000 to $49,999
- 12,601$50,000 to $59,999
- 17,746$60,000 to $74,999
- 30,738$75,000 to $99,999
- 25,091$100,000 to $124,999
- 21,951$125,000 to $149,999
- 30,734$150,000 to $199,999
- 47,085$200,000 or more
Percentage of workers working in this county: 94.1%
Number of people working at home: 9,377 (15.4% of all workers)
Travel time to work (commute)
- Less than 5 minutes: 1,269
- 5 to 9 minutes: 6,559
- 10 to 14 minutes: 10,048
- 15 to 19 minutes: 9,120
- 20 to 24 minutes: 7,025
- 25 to 29 minutes: 2,452
- 30 to 34 minutes: 5,074
- 35 to 39 minutes: 845
- 40 to 44 minutes: 1,372
- 45 to 59 minutes: 2,358
- 60 to 89 minutes: 1,698
- 90 or more minutes: 1,229
Means of transportation to work:
- Drove a car alone: 40,389 (79.0%)
- Carpooled: 5,903 (11.5%)
- Bus or trolley bus: 633 (1.2%)
- Railroad: 54 (0.1%)
- Ferryboat: 6 (0.0%)
- Taxi: 20 (0.0%)
- Motorcycle: 79 (0.2%)
- Bicycle: 426 (0.8%)
- Walked: 1,294 (2.5%)
- Other means: 245 (0.5%)
- Worked at home: 2,094 (4.1%)


- Year of entry for the foreign-born population in Ventura, California
- 2,2651995 to March 2000
- 2,4061990 to 1994
- 2,0971985 to 1989
- 1,6541980 to 1984
- 1,4291975 to 1979
- 1,0901970 to 1974
- 8841965 to 1969
- 2,155Before 1965
Most common places of birth for foreign-born residents (%):
| Ventura: | 55.9% (7,814) |
| California: | 44.3% (3,928,701) |
| Ventura: | 4.2% (587) |
| California: | 7.5% (664,935) |
| Ventura: | 4.0% (557) |
| California: | 1.6% (141,181) |
| Ventura: | 3.8% (531) |
| California: | 1.5% (133,090) |
| Ventura: | 2.9% (405) |
| California: | 1.1% (98,160) |
| Ventura: | 2.4% (336) |
| California: | 1.3% (112,212) |
| Ventura: | 2.0% (281) |
| California: | 4.7% (418,249) |
| Ventura: | 1.7% (232) |
| California: | 2.4% (211,458) |
Place of birth for U.S.-born residents:
- This state: 60,713
- Other state: 30,134
- Northeast: 6,435
- Midwest: 10,887
- South: 6,411
- West: 6,401
49% of Ventura residents lived in the same house 5 years ago.
Out of people who lived in different houses, 65% lived in this county.
Out of people who lived in different counties, 70% lived in California.
Education attainment for males 25 years and older:
- No schooling: 445
- Nursery to 4th grade: 314
- 5th and 6th grade: 743
- 7th and 8th grade: 549
- 9th grade: 558
- 10th grade: 530
- 11th grade: 597
- 12th grade, no diploma: 1,250
- High school graduate (or equivalency): 6,371
- Less than 1 year of college: 2,677
- Some college more than 1 year, no degree: 6,453
- Associate degree: 2,869
- Bachelor's degree: 6,378
- Master's degree: 2,722
- Professional school degree: 1,202
- Doctorate degree: 545

Education attainment for females 25 years and older:
- No schooling: 320
- Nursery to 4th grade: 248
- 5th and 6th grade: 878
- 7th and 8th grade: 748
- 9th grade: 583
- 10th grade: 795
- 11th grade: 543
- 12th grade, no diploma: 1,458
- High school graduate (or equivalency): 7,717
- Less than 1 year of college: 3,394
- Some college more than 1 year, no degree: 6,946
- Associate degree: 3,790
- Bachelor's degree: 6,100
- Master's degree: 2,403
- Professional school degree: 727
- Doctorate degree: 253


Housing units in structures:
- One, detached: 23,773
- One, attached: 3,460
- Two: 1,586
- 3 or 4: 2,653
- 5 to 9: 2,385
- 10 to 19: 1,577
- 20 to 49: 1,412
- 50 or more: 2,069
- Mobile homes: 2,666
- Boats, RVs, vans, etc.: 230
Median worth of mobile homes: $271,560
Housing units lacking complete kitchen facilities: 1.0%

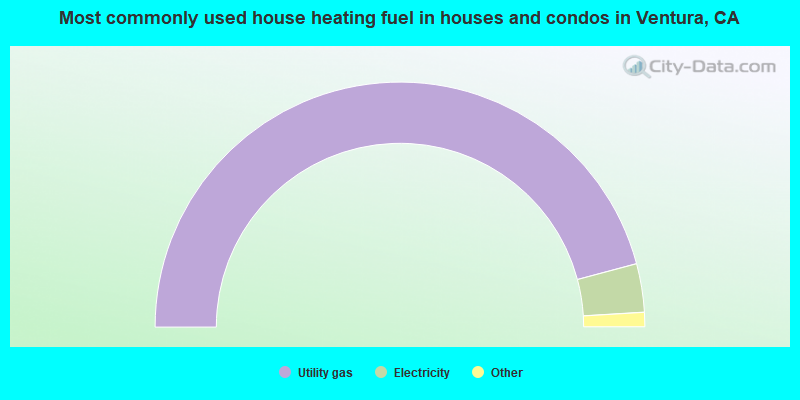
- 91.7%Utility gas
- 6.4%Electricity
- 0.8%Bottled, tank, or LP gas
- 0.5%No fuel used
- 0.5%Wood
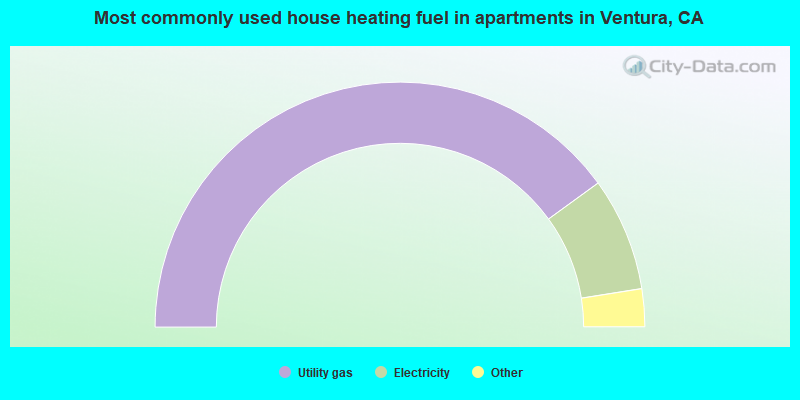
- 80.0%Utility gas
- 15.0%Electricity
- 2.3%No fuel used
- 1.5%Bottled, tank, or LP gas
- 1.0%Solar energy
- 0.2%Other fuel
Private vs. public school enrollment:
| Here: | 14.2% |
| California: | 9.9% |
| Here: | 8.2% |
| California: | 7.8% |
| Here: | 11.5% |
| California: | 15.4% |


