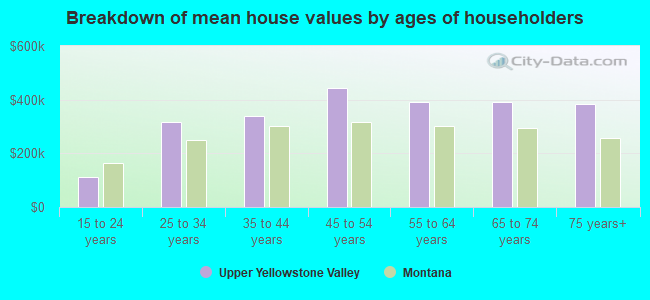
Median price asked for vacant for-sale houses and condos in 2022 in this county: $563,123.
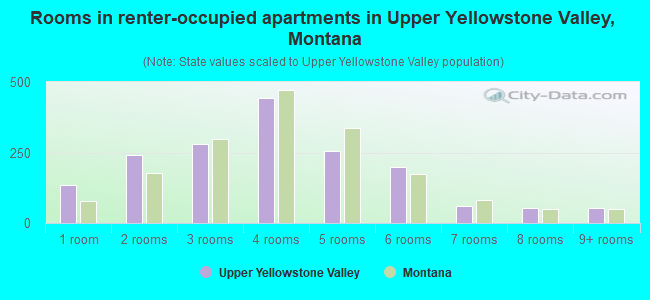
Median contract rent in 2022: $791 (lower quartile is $575, upper quartile is $1,156)
Median rent asked for vacant for-rent units in 2022: $757
Median gross rent in Upper Yellowstone Valley, MT in 2022: $976
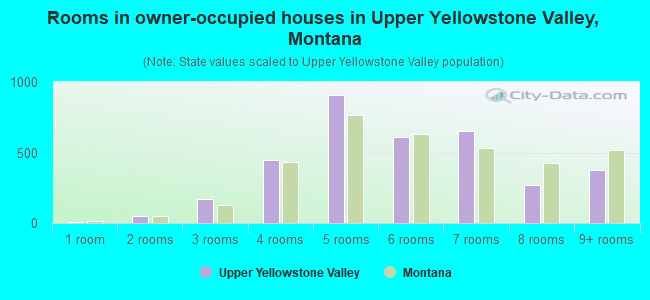
Housing units in Upper Yellowstone Valley with a mortgage: 1,320 (74 second mortgage, 115 home equity loan, 7 both second mortgage and home equity loan) Houses without a mortgage: 957
Compare current foreclosures near Upper Yellowstone Valley, MT:
In family households: 11,783 (3,054 male householders, 1,123 female householders)
3,414 spouses, 3,493 children (3,231 natural, 95 adopted, 167 stepchildren), 139 grandchildren, 73 brothers or sisters, 70 parents, foster children, 69 other relatives, 311 non-relatives
In nonfamily households: 3,745 (1,632 male householders (1,326 living alone)), 1,501 female householders (1,285 living alone)), 612 nonrelatives
In group quarters: 108 (66 institutionalized population)
2,728 married couples with children.
784 single-parent households (267 men, 517 women).
96.6% of residents of Upper Yellowstone Valley speak English at home.
1.6% of residents speak Spanish at home (76% speak English very well, 10% speak English well, 14% speak English not well).
1.6% of residents speak other Indo-European language at home (93% speak English very well, 7% speak English well).
0.2% of residents speak other language at home (100% speak English very well).
Foreign born population: 542 (3.7%)
(27.5% of them are naturalized citizens)
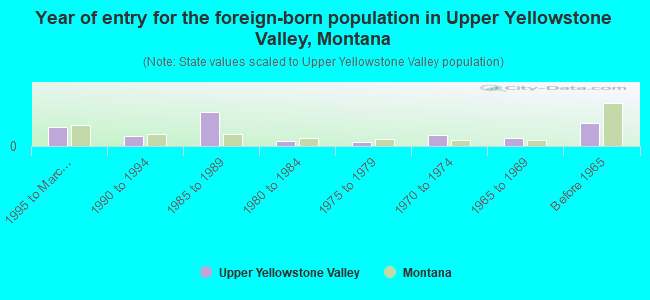
Year of entry for the foreign-born population in Upper Yellowstone Valley, Montana
581995 to March 2000
311990 to 1994
1011985 to 1989
141980 to 1984
111975 to 1979
321970 to 1974
231965 to 1969
68Before 1965
Most common places of birth for foreign-born residents (%):
Canada
Upper Yellowstone Valley:
27.2% (92)
Montana:
27.8% (4,550)
Other Northern Europe
Upper Yellowstone Valley:
10.1% (34)
Montana:
2.8% (465)
United Kingdom
Upper Yellowstone Valley:
8.6% (29)
Montana:
7.3% (1,205)
Germany
Upper Yellowstone Valley:
8.6% (29)
Montana:
10.7% (1,750)
Netherlands
Upper Yellowstone Valley:
5.9% (20)
Montana:
1.8% (295)
Other Western Europe
Upper Yellowstone Valley:
5.9% (20)
Montana:
1.0% (168)
Mexico
Upper Yellowstone Valley:
5.9% (20)
Montana:
5.4% (880)
Sweden
Upper Yellowstone Valley:
5.3% (18)
Montana:
0.9% (150)
Poland
Upper Yellowstone Valley:
3.0% (10)
Montana:
1.5% (251)
Lebanon
Upper Yellowstone Valley:
2.7% (9)
Montana:
0.1% (21)
South Africa
Upper Yellowstone Valley:
2.4% (8)
Montana:
0.6% (92)
Venezuela
Upper Yellowstone Valley:
2.4% (8)
Montana:
0.2% (39)
Ireland
Upper Yellowstone Valley:
2.1% (7)
Montana:
0.9% (145)
Russia
Upper Yellowstone Valley:
2.1% (7)
Montana:
2.9% (480)
Japan
Upper Yellowstone Valley:
2.1% (7)
Montana:
2.6% (424)
Place of birth for U.S.-born residents:
This state: 5,975
Other state: 5,609
Northeast: 582
Midwest: 2,140
South: 689
West: 2,198
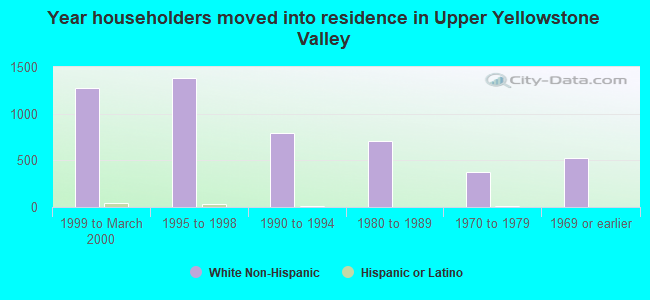
51% of Upper Yellowstone Valley residents lived in the same house 5 years ago. Out of people who lived in different houses, 48% lived in this county. Out of people who lived in different counties, 41% lived in Montana.
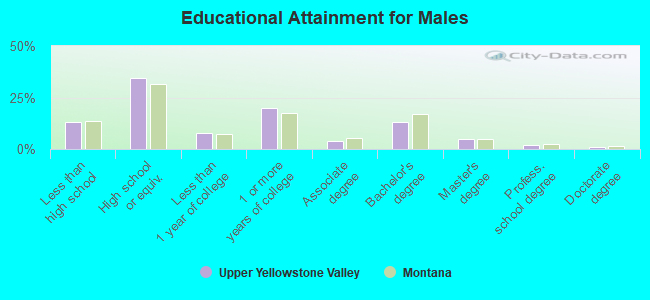
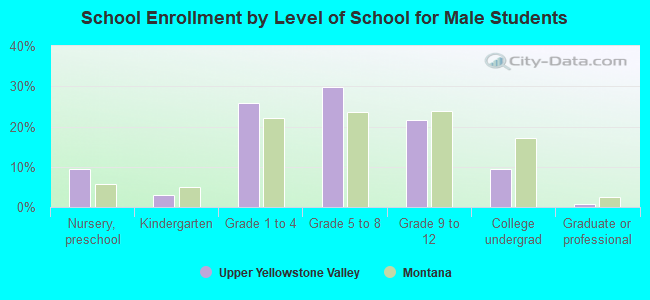
Education attainment for males 25 years and older:
No schooling: 10
Nursery to 4th grade: 11
5th and 6th grade: 31
7th and 8th grade: 147
9th grade: 107
10th grade: 85
11th grade: 47
12th grade, no diploma: 78
High school graduate (or equivalency): 1,380
Less than 1 year of college: 307
Some college more than 1 year, no degree: 802
Associate degree: 160
Bachelor's degree: 522
Master's degree: 195
Professional school degree: 75
Doctorate degree: 40
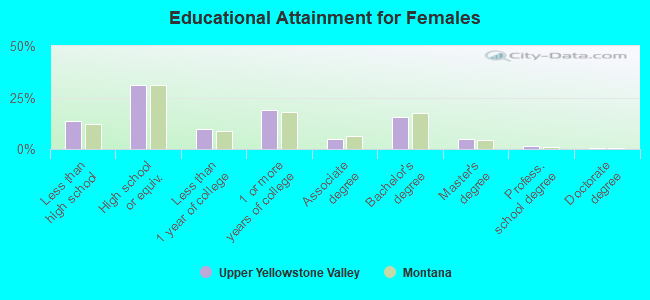
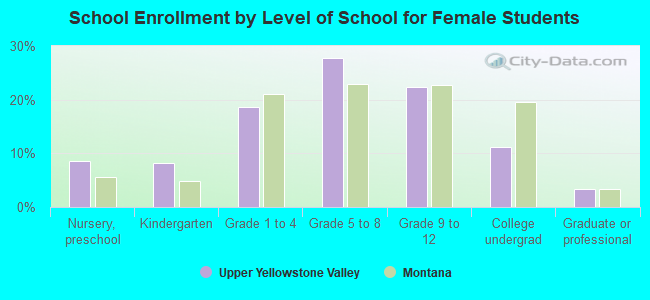
Education attainment for females 25 years and older:
No schooling: 0
Nursery to 4th grade: 17
5th and 6th grade: 0
7th and 8th grade: 153
9th grade: 64
10th grade: 84
11th grade: 158
12th grade, no diploma: 122
High school graduate (or equivalency): 1,355
Less than 1 year of college: 424
Some college more than 1 year, no degree: 827
Associate degree: 223
Bachelor's degree: 678
Master's degree: 204
Professional school degree: 57
Doctorate degree: 13
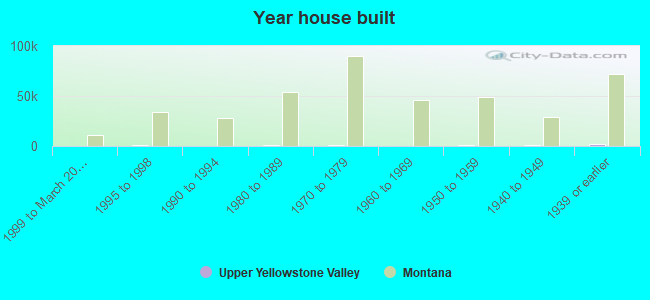
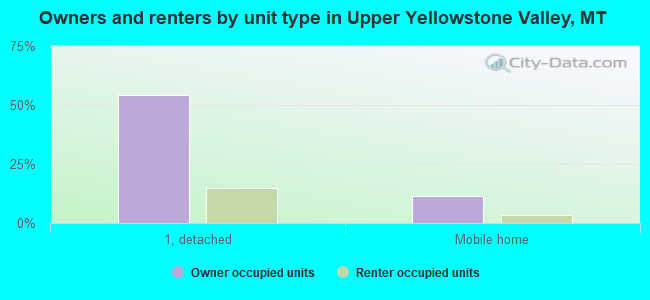
Housing units in structures:
One, detached: 4,215
One, attached: 113
Two: 190
3 or 4: 172
5 to 9: 138
10 to 19: 122
20 to 49: 137
50 or more: 69
Mobile homes: 877
Boats, RVs, vans, etc.: 9
Median worth of mobile homes: $51,553
Housing units lacking complete plumbing facilities: 1.6%
Housing units lacking complete kitchen facilities: 1.8%