Housing density: 828 houses/condos per square mile
Median price asked for vacant for-sale houses and condos in 2022 in this county: $238,015.
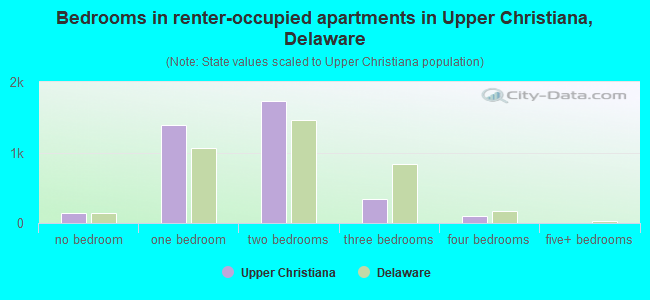
Median contract rent in 2022: $1,235 (lower quartile is $1,095, upper quartile is $1,470)
Median rent asked for vacant for-rent units in 2022: $1,315
Median gross rent in Upper Christiana, DE in 2022: $1,349
Housing units in Upper Christiana with a mortgage: 4,786 (689 second mortgage, 744 home equity loan, 29 both second mortgage and home equity loan) Houses without a mortgage: 823
Compare current foreclosures near Upper Christiana, DE:
In family households: 432,579 (87,243 male householders, 47,500 female householders)
94,343 spouses, 154,234 children (144,377 natural, 3,150 adopted, 6,707 stepchildren), 13,869 grandchildren, 5,731 brothers or sisters, 5,248 parents, foster children, 7,594 other relatives, 13,545 non-relatives
In nonfamily households: 88,746 (30,762 male householders (22,487 living alone)), 37,146 female householders (30,500 living alone)), 20,838 nonrelatives
In group quarters: 17,154 (7,943 institutionalized population)
79,448 married couples with children.
31,255 single-parent households (6,358 men, 24,897 women).
85.7% of residents of Upper Christiana speak English at home.
4.7% of residents speak Spanish at home (70% speak English very well, 21% speak English well, 9% speak English not well).
5.1% of residents speak other Indo-European language at home (71% speak English very well, 19% speak English well, 8% speak English not well, 1% don't speak English at all).
3.2% of residents speak Asian or Pacific Island language at home (53% speak English very well, 27% speak English well, 20% speak English not well).
1.3% of residents speak other language at home (83% speak English very well, 6% speak English well, 11% speak English not well).
Foreign born population: 4,804 (17.0%)
(61.3% of them are naturalized citizens)
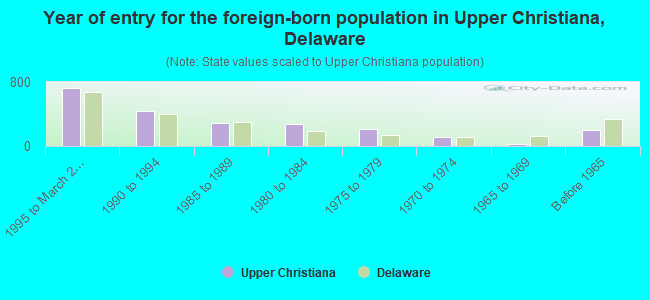
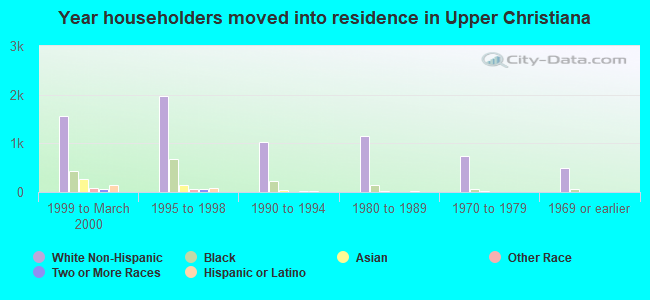
Year of entry for the foreign-born population in Upper Christiana, Delaware
7291995 to March 2000
4361990 to 1994
2921985 to 1989
2751980 to 1984
2081975 to 1979
1151970 to 1974
301965 to 1969
202Before 1965
Most common places of birth for foreign-born residents (%):
India
Upper Christiana:
24.5% (561)
Delaware:
8.3% (3,736)
Philippines
Upper Christiana:
7.3% (166)
Delaware:
3.4% (1,507)
Korea
Upper Christiana:
6.0% (137)
Delaware:
3.5% (1,577)
Colombia
Upper Christiana:
4.5% (102)
Delaware:
1.6% (720)
China, excluding Hong Kong and Taiwan
Upper Christiana:
3.5% (81)
Delaware:
5.3% (2,392)
Jamaica
Upper Christiana:
3.3% (76)
Delaware:
3.7% (1,682)
Egypt
Upper Christiana:
3.3% (76)
Delaware:
0.8% (348)
Pakistan
Upper Christiana:
3.3% (75)
Delaware:
1.3% (593)
Guyana
Upper Christiana:
3.3% (75)
Delaware:
0.8% (366)
Germany
Upper Christiana:
2.9% (67)
Delaware:
4.2% (1,901)
Canada
Upper Christiana:
2.8% (65)
Delaware:
3.4% (1,544)
Other Eastern Africa
Upper Christiana:
2.2% (50)
Delaware:
0.7% (317)
Greece
Upper Christiana:
2.1% (49)
Delaware:
1.0% (446)
Vietnam
Upper Christiana:
2.1% (48)
Delaware:
1.3% (565)
Italy
Upper Christiana:
2.0% (45)
Delaware:
2.3% (1,014)
Ghana
Upper Christiana:
2.0% (45)
Delaware:
0.8% (348)
Chile
Upper Christiana:
1.9% (44)
Delaware:
0.5% (203)
Mexico
Upper Christiana:
1.7% (40)
Delaware:
17.5% (7,846)
United Kingdom
Upper Christiana:
1.7% (40)
Delaware:
5.6% (2,521)
Nigeria
Upper Christiana:
1.7% (39)
Delaware:
1.2% (549)
Hong Kong
Upper Christiana:
1.6% (37)
Delaware:
0.7% (314)
Other Caribbean
Upper Christiana:
1.5% (35)
Delaware:
0.7% (296)
Place of birth for U.S.-born residents:
This state: 11,466
Other state: 10,418
Northeast: 6,583
Midwest: 788
South: 2,603
West: 444
52% of Upper Christiana residents lived in the same house 5 years ago. Out of people who lived in different houses, 63% lived in this county. Out of people who lived in different counties, 7% lived in Delaware.
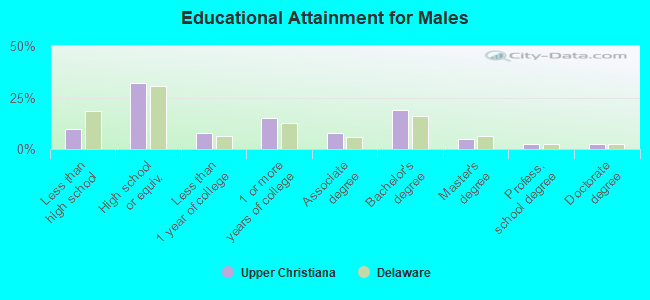
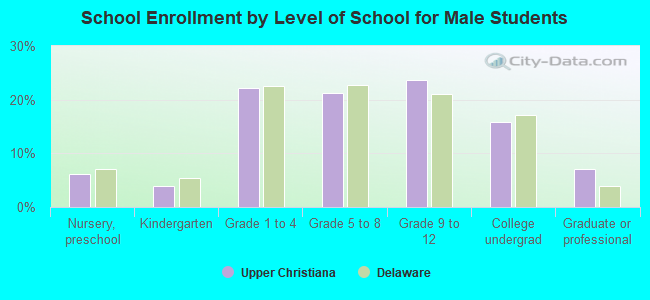
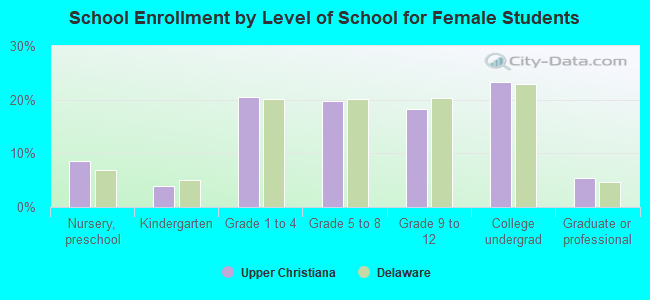
Education attainment for males 25 years and older:
No schooling: 39
Nursery to 4th grade: 6
5th and 6th grade: 5
7th and 8th grade: 54
9th grade: 111
10th grade: 218
11th grade: 76
12th grade, no diploma: 207
High school graduate (or equivalency): 2,382
Less than 1 year of college: 580
Some college more than 1 year, no degree: 1,105
Associate degree: 563
Bachelor's degree: 1,409
Master's degree: 354
Professional school degree: 181
Doctorate degree: 165
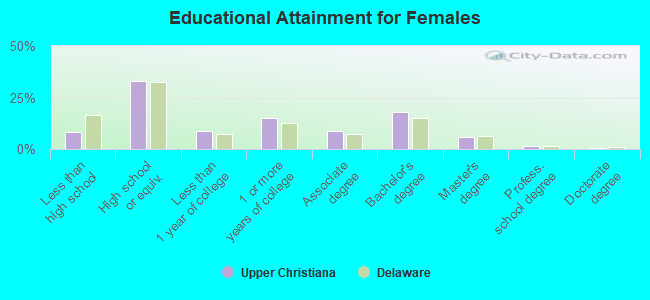
Education attainment for females 25 years and older:
No schooling: 81
Nursery to 4th grade: 15
5th and 6th grade: 18
7th and 8th grade: 110
9th grade: 112
10th grade: 94
11th grade: 48
12th grade, no diploma: 184
High school graduate (or equivalency): 2,656
Less than 1 year of college: 712
Some college more than 1 year, no degree: 1,213
Associate degree: 705
Bachelor's degree: 1,471
Master's degree: 475
Professional school degree: 136
Doctorate degree: 56
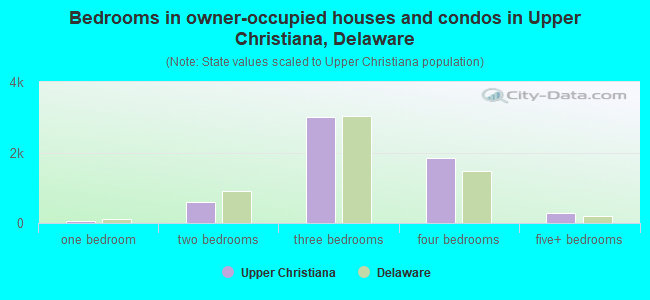
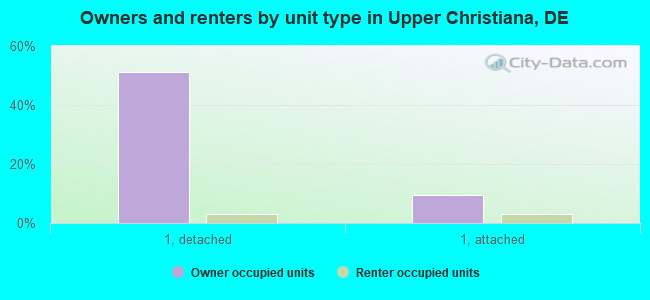
Housing units in structures:
One, detached: 5,179
One, attached: 1,236
Two: 77
3 or 4: 84
5 to 9: 1,138
10 to 19: 1,630
20 to 49: 276
50 or more: 278
Housing units lacking complete plumbing facilities: 0.5%
Housing units lacking complete kitchen facilities: 0.4%