Housing density: 1,820 houses/condos per square mile
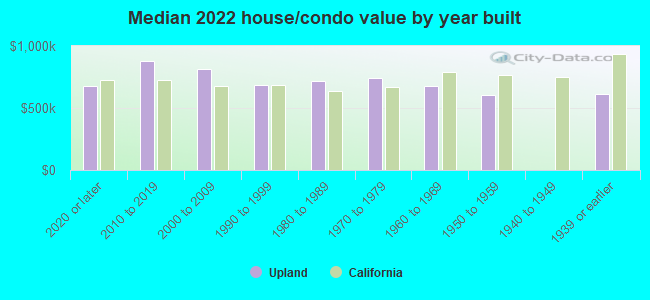
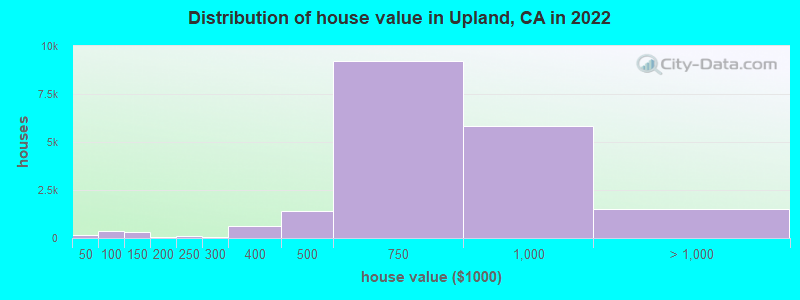
Median price asked for vacant for-sale houses and condos in 2022: $722,108.
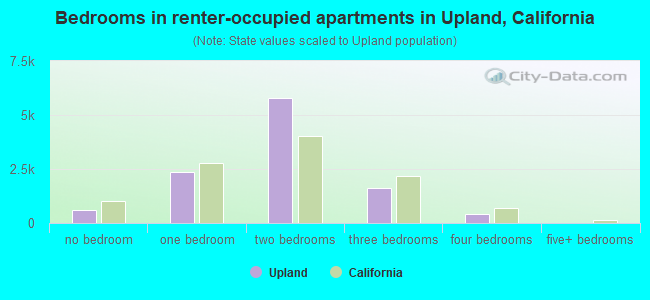
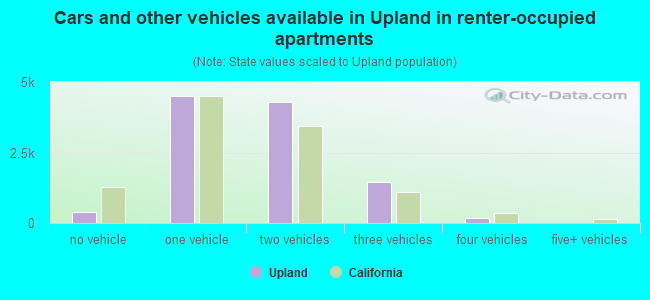
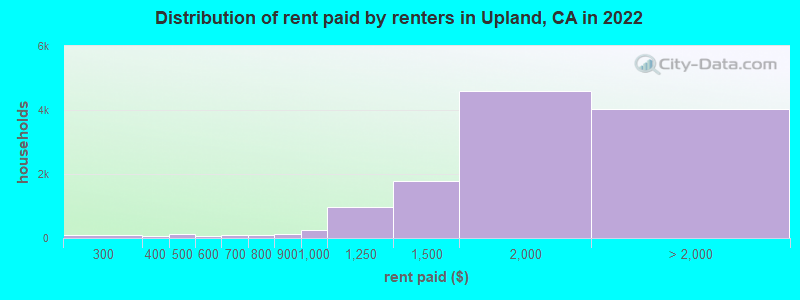
Median contract rent in 2022: $1,702 (lower quartile is $1,364, upper quartile is $1,975)
Median rent asked for vacant for-rent units in 2022: $1,677
Median gross rent in Upland, CA in 2022: $1,829
Housing units in Upland with a mortgage: 10,952 (1,110 second mortgage, 109 home equity loan, 809 both second mortgage and home equity loan) Houses without a mortgage: 694
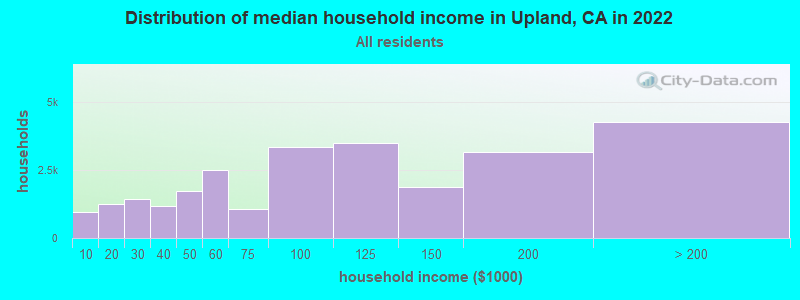
Median household income for houses/condos with a mortgage: $150,154
Median household income for apartments without a mortgage: $69,611
10,942 married couples with children.
3,469 single-parent households (1,252 men, 2,217 women).
65.6% of residents of Upland speak English at home.
22.3% of residents speak Spanish at home (71% speak English very well, 14% speak English well, 10% speak English not well, 4% don't speak English at all).
2.6% of residents speak other Indo-European language at home (66% speak English very well, 19% speak English well, 16% speak English not well).
6.6% of residents speak Asian or Pacific Island language at home (55% speak English very well, 28% speak English well, 13% speak English not well, 4% don't speak English at all).
2.2% of residents speak other language at home (76% speak English very well, 18% speak English well, 5% speak English not well, 1% don't speak English at all).
Foreign born population: 13,614 (17.3%)
(61.8% of them are naturalized citizens)
Percentage of workers working in this county: 61.2% Number of people working at home: 5,631 (13.9% of all workers)
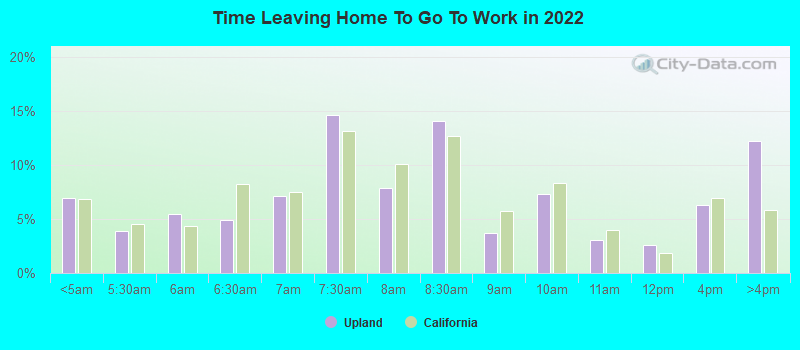
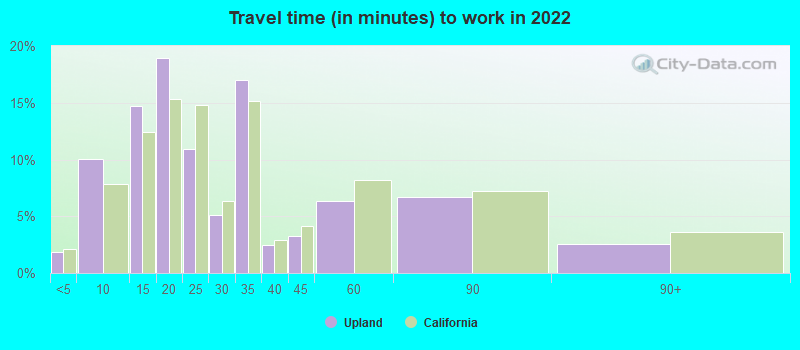
Travel time to work (commute)
Less than 5 minutes: 455
5 to 9 minutes: 1,798
10 to 14 minutes: 4,342
15 to 19 minutes: 4,655
20 to 24 minutes: 3,759
25 to 29 minutes: 3,137
30 to 34 minutes: 4,308
35 to 39 minutes: 479
40 to 44 minutes: 1,463
45 to 59 minutes: 1,603
60 to 89 minutes: 2,936
90 or more minutes: 1,225
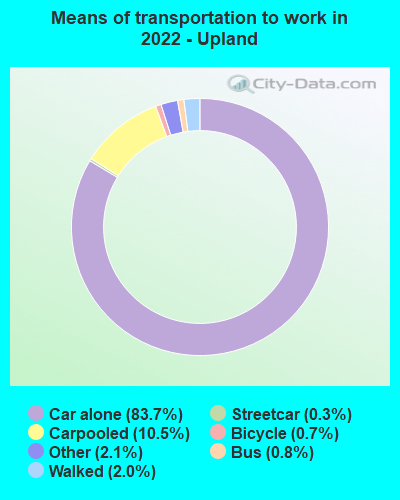
Means of transportation to work:
Drove a car alone: 24,788 (70.2%)
Carpooled: 3,337 (9.4%)
Bus: 234 (0.7%)
Subway or elevated rail: 61 (0.2%)
Long-distance train or commuter rail: 2 (0.0%)
Taxi: 697 (2.0%)
Bicycle: 169 (0.5%)
Walked: 638 (1.8%)
Worked at home: 5,631 (15.9%)
Unemployment by race in 2022
Unemployment rate for White non-Hispanic residents
7.7%Males
4.3%Females
Unemployment rate for Black residents
4.9%Males
7.1%Females
Unemployment rate for American Indian and Alaska Native residents
3.0%Males
3.2%Females
Unemployment rate for Asian residents
2.0%Males
1.2%Females
Unemployment rate for other race residents
1.3%Males
6.2%Females
Unemployment rate for two or more race residents
5.7%Males
3.8%Females
Unemployment rate for Hispanic or Latino residents
6.8%Males
5.7%Females
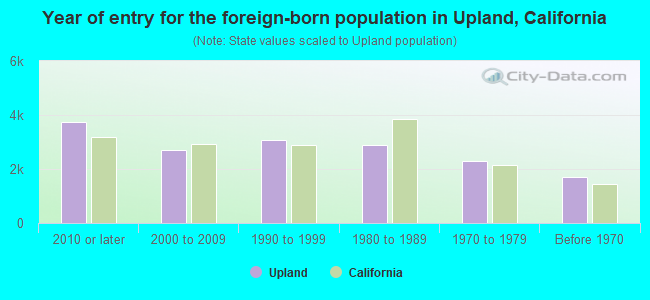
Year of entry for the foreign-born population in Upland, California
3,7362010 or later
2,7172000 to 2009
3,0561990 to 1999
2,8941980 to 1989
2,3071970 to 1979
1,704Before 1970
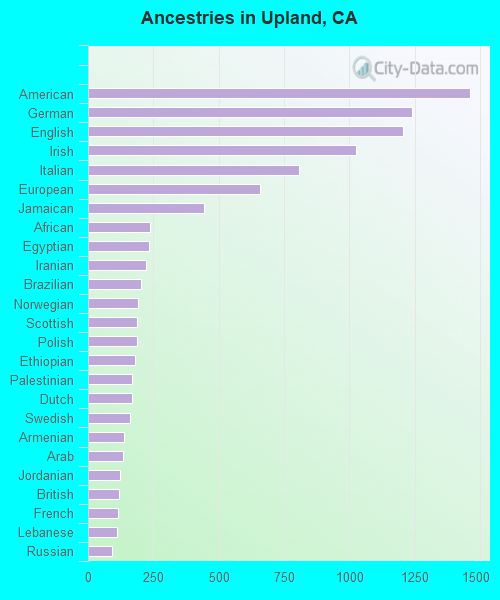
First ancestries reported:
American: 1,462 (3.3%)
German: 1,239 (2.8%)
English: 1,204 (2.8%)
Irish: 1,027 (2.3%)
Italian: 807 (1.8%)
European: 658 (1.5%)
Jamaican: 445 (1.0%)
African: 236 (0.5%)
Egyptian: 235 (0.5%)
Iranian: 221 (0.5%)
Brazilian: 201 (0.5%)
Norwegian: 191 (0.4%)
Scottish: 187 (0.4%)
Polish: 186 (0.4%)
Ethiopian: 179 (0.4%)
Palestinian: 169 (0.4%)
Dutch: 167 (0.4%)
Swedish: 159 (0.4%)
Armenian: 139 (0.3%)
Arab: 134 (0.3%)
Jordanian: 121 (0.3%)
British: 118 (0.3%)
French: 115 (0.3%)
Lebanese: 112 (0.3%)
Russian: 92 (0.2%)
Ghanaian: 90 (0.2%)
Canadian: 80 (0.2%)
Iraqi: 78 (0.2%)
South African: 70 (0.2%)
Haitian: 69 (0.2%)
French Canadian: 67 (0.2%)
Scotch-Irish: 62 (0.1%)
Austrian: 57 (0.1%)
Portuguese: 57 (0.1%)
Greek: 56 (0.1%)
West Indian: 54 (0.1%)
Welsh: 48 (0.1%)
Romanian: 48 (0.1%)
Sudanese: 44 (0.1%)
Northern European: 41 (0.09%)
Eastern European: 40 (0.09%)
Afghan: 39 (0.09%)
Scandinavian: 38 (0.09%)
Hungarian: 34 (0.08%)
Czechoslovakian: 34 (0.08%)
Yugoslavian: 33 (0.08%)
Syrian: 32 (0.07%)
Ukrainian: 32 (0.07%)
Maltese: 31 (0.07%)
Nigerian: 28 (0.06%)
Danish: 27 (0.06%)
Liberian: 23 (0.05%)
Israeli: 22 (0.05%)
Turkish: 21 (0.05%)
Czech: 18 (0.04%)
Lithuanian: 17 (0.04%)
Swiss: 16 (0.04%)
Croatian: 13 (0.03%)
Trinidadian and Tobagonian: 13 (0.03%)
Finnish: 12 (0.03%)
Serbian: 11 (0.03%)
British West Indian: 10 (0.02%)
Basque: 9 (0.02%)
Latvian: 8 (0.02%)
Most common places of birth for foreign-born residents (%):
Mexico
Upland:
35.0% (5,160)
California:
37.2% (3,881,193)
Philippines
Upland:
7.7% (1,133)
California:
7.8% (818,297)
China, excluding Hong Kong and Taiwan
Upland:
5.7% (834)
California:
6.6% (684,672)
El Salvador
Upland:
4.8% (713)
California:
4.2% (440,287)
Vietnam
Upland:
3.4% (500)
California:
4.9% (512,335)
Taiwan
Upland:
3.3% (480)
California:
1.7% (176,274)
India
Upland:
2.9% (429)
California:
5.2% (539,184)
Korea
Upland:
2.4% (348)
California:
3.0% (315,248)
Iran
Upland:
1.6% (239)
California:
2.0% (206,004)
Place of birth for U.S.-born residents:
This state: 53,457
Other state: 11,253
Northeast: 1,831
Midwest: 3,891
South: 2,603
West: 2,928
88.9% of Upland residents lived in the same house 1 years ago. Out of people who lived in different houses, 37.6% lived in this county. Out of people who lived in different counties, 78.3% lived in California.
Upland:
88.9%
State average:
88.9%
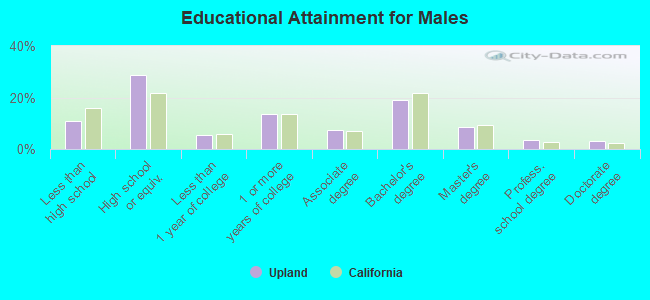
Education attainment for males 25 years and older:
No schooling: 805
Nursery to 4th grade: 0
5th and 6th grade: 293
7th and 8th grade: 203
9th grade: 228
10th grade: 325
11th grade: 357
12th grade, no diploma: 453
High school graduate (or equivalency): 7,155
Less than 1 year of college: 1,405
Some college more than 1 year, no degree: 3,345
Associate degree: 1,864
Bachelor's degree: 4,716
Master's degree: 2,144
Professional school degree: 830
Doctorate degree: 811
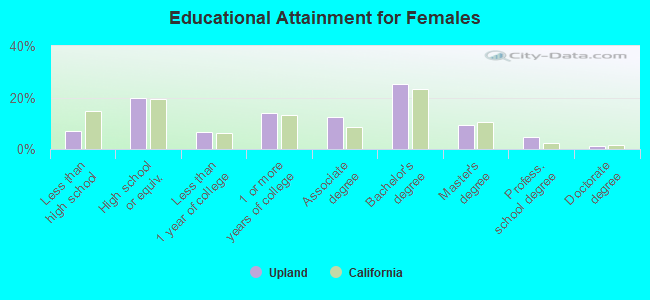
Education attainment for females 25 years and older:
No schooling: 386
Nursery to 4th grade: 221
5th and 6th grade: 270
7th and 8th grade: 98
9th grade: 79
10th grade: 472
11th grade: 49
12th grade, no diploma: 447
High school graduate (or equivalency): 5,563
Less than 1 year of college: 1,893
Some college more than 1 year, no degree: 3,980
Associate degree: 3,452
Bachelor's degree: 7,112
Master's degree: 2,575
Professional school degree: 1,280
Doctorate degree: 302
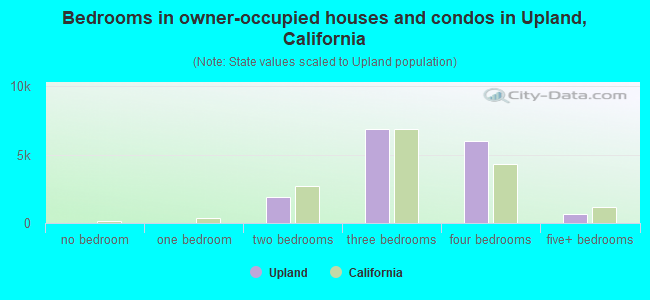
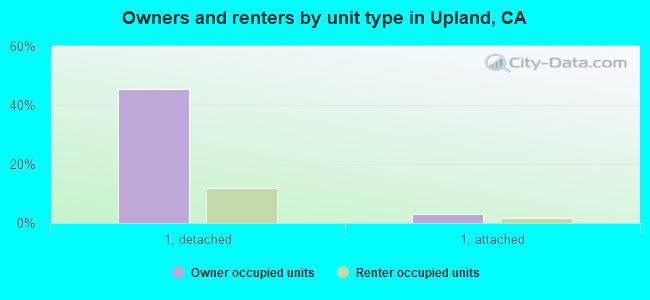
Housing units in structures:
One, detached: 15,635
One, attached: 3,065
Two: 406
3 or 4: 2,617
5 to 9: 1,520
10 to 19: 741
20 to 49: 437
50 or more: 2,306
Mobile homes: 786
Median worth of mobile homes: $123,300
Housing units lacking complete plumbing facilities in 2022: 0.8%
Housing units lacking complete kitchen facilities in 2022: 3.8%
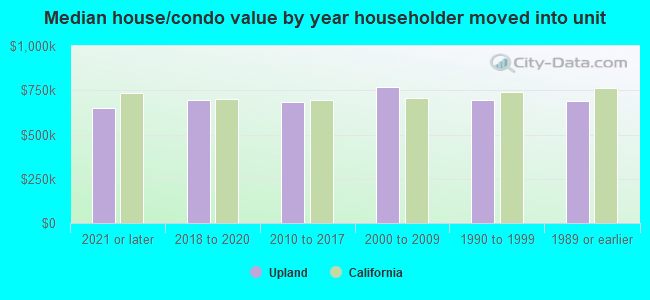
House/condo owner moved in on average 13 years ago