Housing density: 2,380 houses/condos per square mile
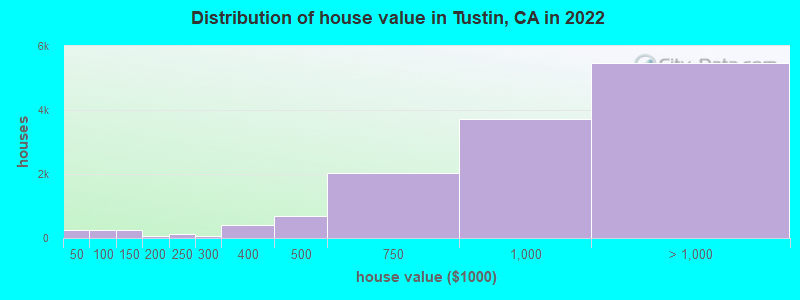
Median price asked for vacant for-sale houses and condos in 2022: $407,460.
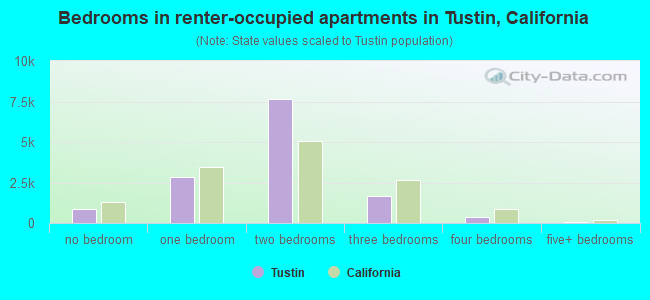
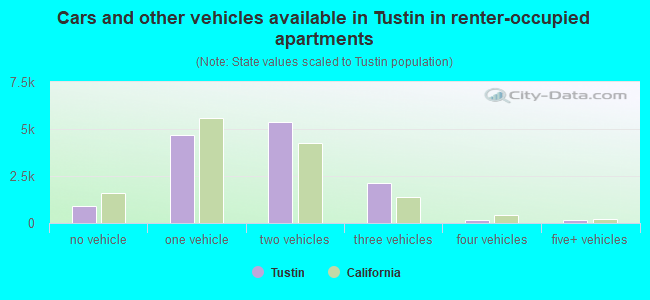
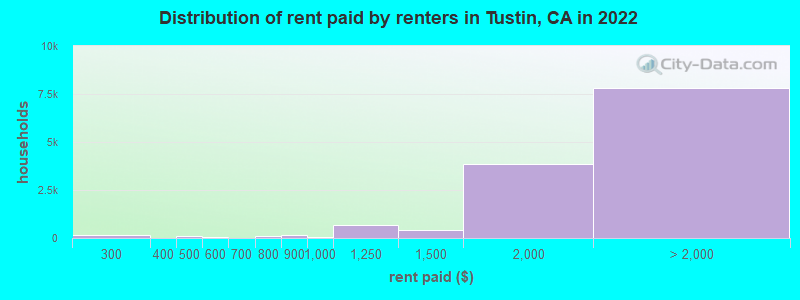
Median contract rent in 2022: over $2,000 (lower quartile is $1,678, upper quartile is over $2,000)
Median rent asked for vacant for-rent units in 2022: $2,287
Median gross rent in Tustin, CA in 2022: over $2,000
Housing units in Tustin with a mortgage: 8,263 (1,037 second mortgage, 182 home equity loan, 813 both second mortgage and home equity loan) Houses without a mortgage: 239
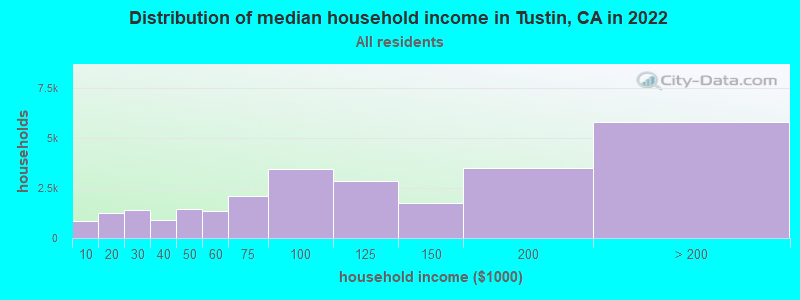
Median household income for houses/condos with a mortgage: $168,518
Median household income for apartments without a mortgage: $128,444
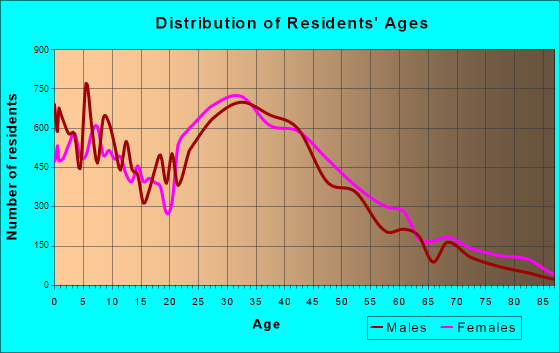
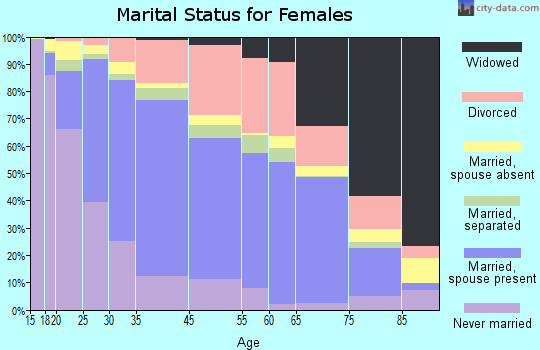
12,817 married couples with children.
3,473 single-parent households (741 men, 2,732 women).
47.3% of residents of Tustin speak English at home.
29.5% of residents speak Spanish at home (62% speak English very well, 21% speak English well, 10% speak English not well, 6% don't speak English at all).
7.2% of residents speak other Indo-European language at home (73% speak English very well, 13% speak English well, 10% speak English not well, 4% don't speak English at all).
15.7% of residents speak Asian or Pacific Island language at home (58% speak English very well, 24% speak English well, 15% speak English not well, 3% don't speak English at all).
0.7% of residents speak other language at home (67% speak English very well, 20% speak English well, 6% speak English not well, 7% don't speak English at all).
Foreign born population: 25,632 (32.7%)
(64.2% of them are naturalized citizens)
Percentage of workers working in this county: 94.7% Number of people working at home: 6,942 (17.2% of all workers)
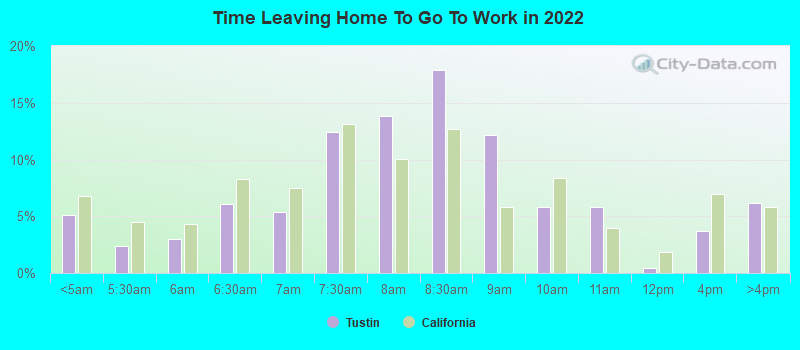
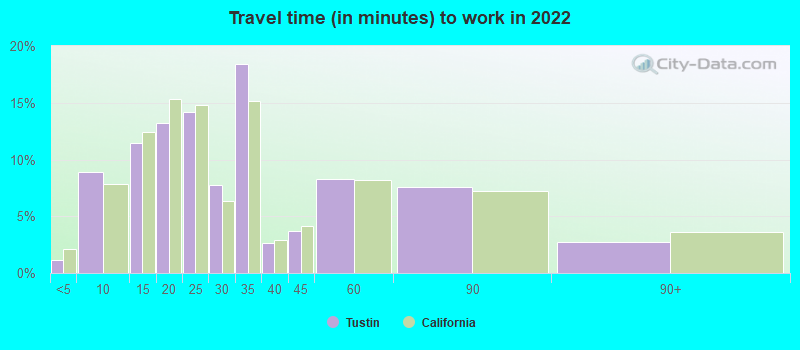
Travel time to work (commute)
Less than 5 minutes: 283
5 to 9 minutes: 2,225
10 to 14 minutes: 4,231
15 to 19 minutes: 5,805
20 to 24 minutes: 7,887
25 to 29 minutes: 2,281
30 to 34 minutes: 4,379
35 to 39 minutes: 1,820
40 to 44 minutes: 284
45 to 59 minutes: 1,245
60 to 89 minutes: 837
90 or more minutes: 253
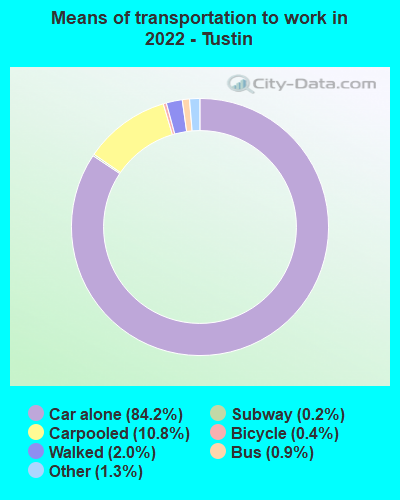
Means of transportation to work:
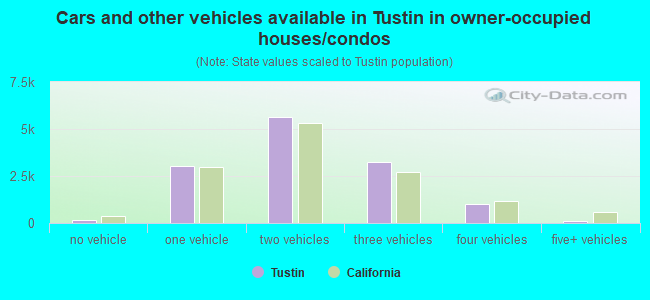
Drove a car alone: 30,366 (69.9%)
Carpooled: 4,226 (9.7%)
Bus: 295 (0.7%)
Subway or elevated rail: 8 (0.0%)
Long-distance train or commuter rail: 62 (0.1%)
Taxi: 544 (1.3%)
Bicycle: 164 (0.4%)
Walked: 732 (1.7%)
Worked at home: 6,942 (16.0%)
Unemployment by race in 2022
Unemployment rate for White non-Hispanic residents
8.2%Males
14.1%Females
Unemployment rate for Black residents
7.9%Males
13.0%Females
Unemployment rate for Asian residents
2.7%Males
2.6%Females
Unemployment rate for other race residents
4.6%Males
5.0%Females
Unemployment rate for two or more race residents
4.4%Males
2.5%Females
Unemployment rate for Hispanic or Latino residents
4.7%Males
5.0%Females
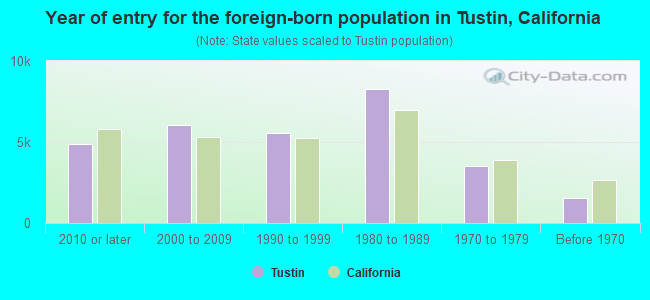
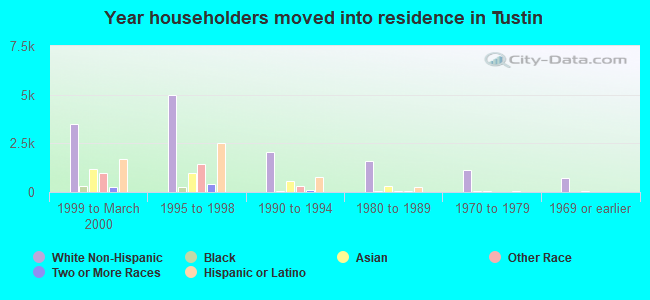
Year of entry for the foreign-born population in Tustin, California
4,8472010 or later
6,0742000 to 2009
5,5571990 to 1999
8,2951980 to 1989
3,5071970 to 1979
1,571Before 1970
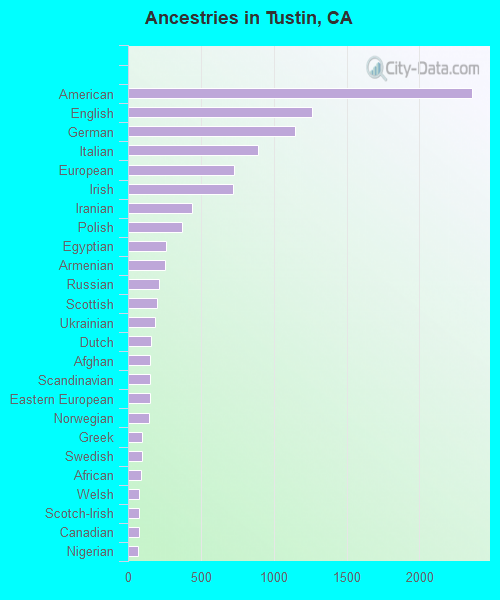
First ancestries reported:
American: 2,360 (4.9%)
English: 1,262 (2.6%)
German: 1,148 (2.4%)
Italian: 890 (1.8%)
European: 731 (1.5%)
Irish: 724 (1.5%)
Iranian: 437 (0.9%)
Polish: 371 (0.8%)
Egyptian: 264 (0.5%)
Armenian: 252 (0.5%)
Russian: 212 (0.4%)
Scottish: 200 (0.4%)
Ukrainian: 188 (0.4%)
Dutch: 156 (0.3%)
Afghan: 154 (0.3%)
Scandinavian: 151 (0.3%)
Eastern European: 149 (0.3%)
Norwegian: 142 (0.3%)
Greek: 97 (0.2%)
Swedish: 94 (0.2%)
African: 88 (0.2%)
Welsh: 75 (0.2%)
Scotch-Irish: 75 (0.2%)
Canadian: 73 (0.2%)
Nigerian: 72 (0.1%)
British: 70 (0.1%)
Syrian: 67 (0.1%)
French Canadian: 65 (0.1%)
Turkish: 58 (0.1%)
Serbian: 58 (0.1%)
Palestinian: 57 (0.1%)
French: 55 (0.1%)
Danish: 49 (0.1%)
Yugoslavian: 41 (0.08%)
Czech: 38 (0.08%)
Iraqi: 37 (0.08%)
Albanian: 30 (0.06%)
Estonian: 25 (0.05%)
Romanian: 23 (0.05%)
Lebanese: 22 (0.05%)
Slovak: 21 (0.04%)
Bulgarian: 21 (0.04%)
Swiss: 18 (0.04%)
Hungarian: 15 (0.03%)
Lithuanian: 15 (0.03%)
Ethiopian: 14 (0.03%)
Czechoslovakian: 14 (0.03%)
Croatian: 13 (0.03%)
Jordanian: 12 (0.02%)
Belizean: 10 (0.02%)
Pennsylvania German: 9 (0.02%)
Jamaican: 8 (0.02%)
Arab: 7 (0.01%)
Austrian: 7 (0.01%)
Northern European: 6 (0.01%)
New Zealander: 4 (0.01%)
Most common places of birth for foreign-born residents (%):
Mexico
Tustin:
33.1% (8,434)
California:
37.2% (3,881,193)
India
Tustin:
9.4% (2,395)
California:
5.2% (539,184)
Korea
Tustin:
7.2% (1,825)
California:
3.0% (315,248)
Philippines
Tustin:
7.0% (1,794)
California:
7.8% (818,297)
Vietnam
Tustin:
6.7% (1,697)
California:
4.9% (512,335)
China, excluding Hong Kong and Taiwan
Tustin:
5.2% (1,313)
California:
6.6% (684,672)
Taiwan
Tustin:
2.7% (686)
California:
1.7% (176,274)
Iran
Tustin:
2.4% (616)
California:
2.0% (206,004)
Guatemala
Tustin:
2.1% (536)
California:
2.8% (290,436)
El Salvador
Tustin:
1.9% (482)
California:
4.2% (440,287)
Japan
Tustin:
1.9% (478)
California:
1.0% (103,575)
Place of birth for U.S.-born residents:
This state: 40,760
Other state: 10,703
Northeast: 3,721
Midwest: 3,094
South: 2,102
West: 1,786
86.5% of Tustin residents lived in the same house 1 years ago. Out of people who lived in different houses, 42.7% lived in this county. Out of people who lived in different counties, 66.1% lived in California.
Tustin:
86.5%
State average:
88.9%
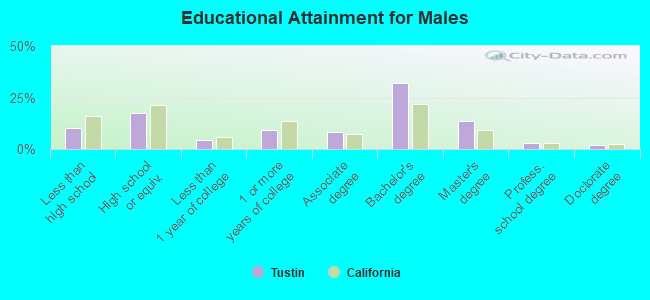
Education attainment for males 25 years and older:
No schooling: 1,069
Nursery to 4th grade: 0
5th and 6th grade: 241
7th and 8th grade: 137
9th grade: 304
10th grade: 76
11th grade: 149
12th grade, no diploma: 547
High school graduate (or equivalency): 4,311
Less than 1 year of college: 1,117
Some college more than 1 year, no degree: 2,290
Associate degree: 2,023
Bachelor's degree: 7,828
Master's degree: 3,336
Professional school degree: 661
Doctorate degree: 435
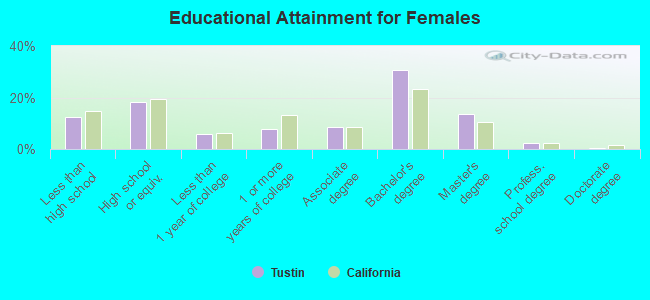
Education attainment for females 25 years and older:
No schooling: 1,273
Nursery to 4th grade: 199
5th and 6th grade: 730
7th and 8th grade: 211
9th grade: 0
10th grade: 231
11th grade: 235
12th grade, no diploma: 733
High school graduate (or equivalency): 5,216
Less than 1 year of college: 1,695
Some college more than 1 year, no degree: 2,275
Associate degree: 2,438
Bachelor's degree: 8,759
Master's degree: 3,868
Professional school degree: 705
Doctorate degree: 85
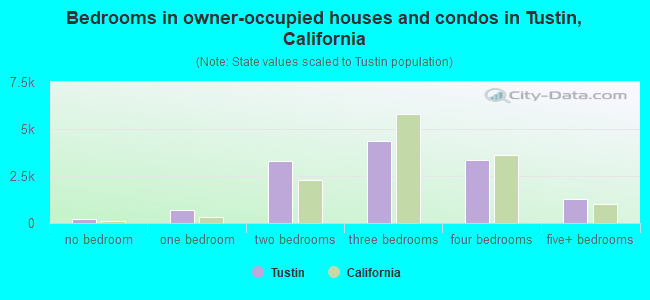
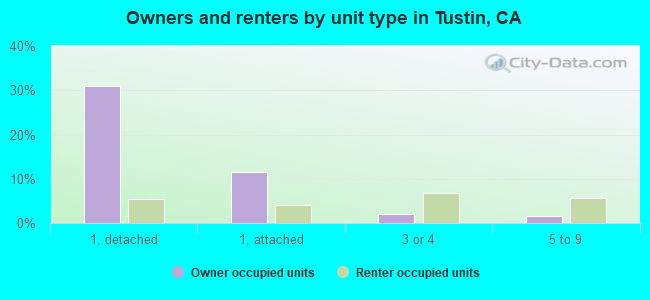
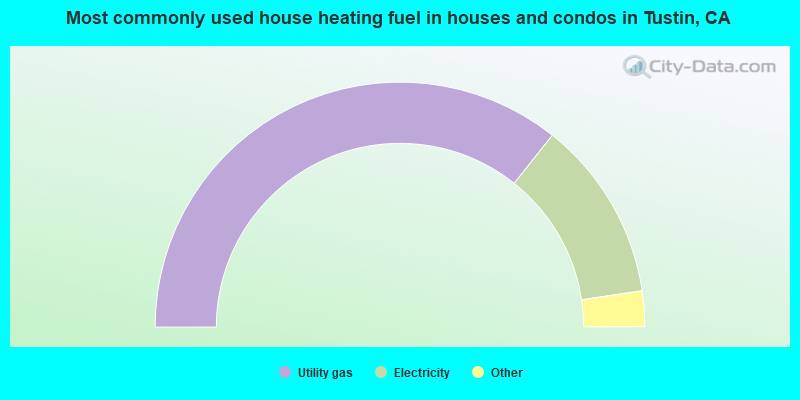
Housing units in structures:
One, detached: 9,083
One, attached: 4,785
Two: 22
3 or 4: 2,942
5 to 9: 1,722
10 to 19: 1,371
20 to 49: 2,138
50 or more: 3,845
Mobile homes: 1,049
Boats, RVs, vans, etc.: 177
Median worth of mobile homes: $110,400
Housing units lacking complete plumbing facilities in 2022: 1.2%
Housing units lacking complete kitchen facilities in 2022: 1.4%
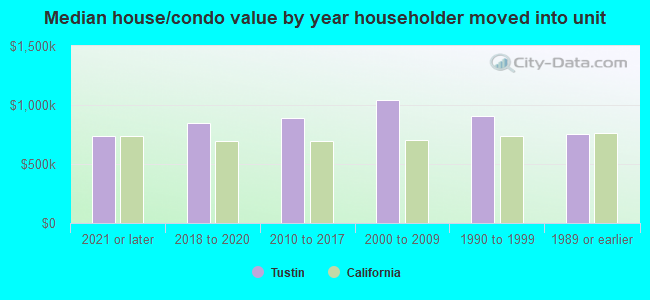
House/condo owner moved in on average 12 years ago