Housing density: 1,951 houses/condos per square mile
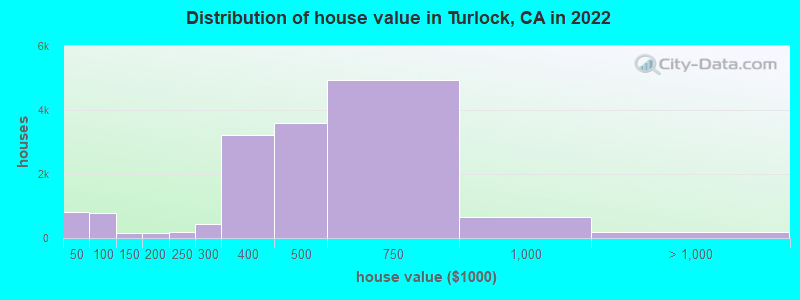
Median price asked for vacant for-sale houses and condos in 2022: $266,817.
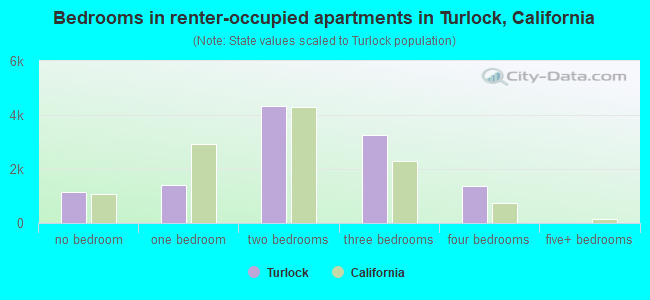
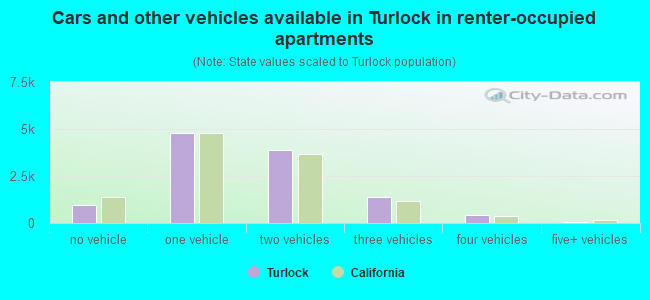
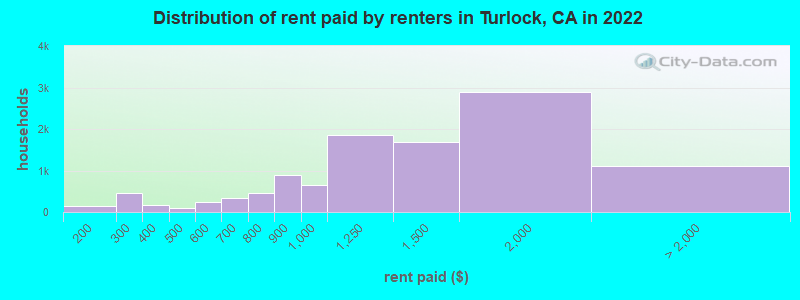
Median contract rent in 2022: $1,341 (lower quartile is $984, upper quartile is $1,703)
Median rent asked for vacant for-rent units in 2022: $1,673
Median gross rent in Turlock, CA in 2022: $1,482
Housing units in Turlock with a mortgage: 9,759 (663 second mortgage, 56 home equity loan, 453 both second mortgage and home equity loan) Houses without a mortgage: 217
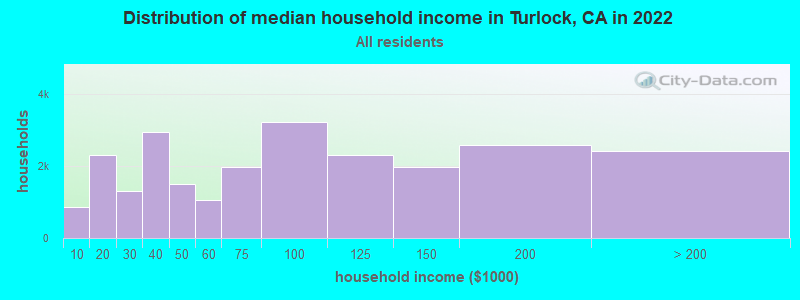
Median household income for houses/condos with a mortgage: $123,426
Median household income for apartments without a mortgage: $79,199
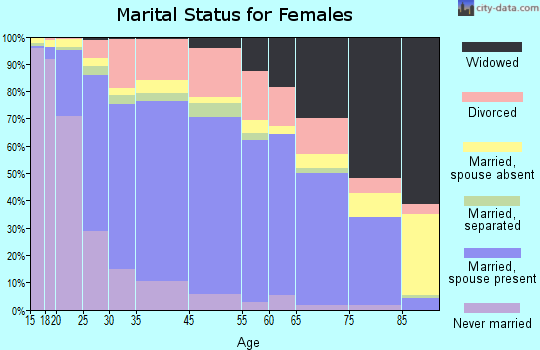
13,851 married couples with children.
2,804 single-parent households (907 men, 1,897 women).
57.5% of residents of Turlock speak English at home.
28.4% of residents speak Spanish at home (69% speak English very well, 9% speak English well, 13% speak English not well, 9% don't speak English at all).
8.6% of residents speak other Indo-European language at home (63% speak English very well, 20% speak English well, 12% speak English not well, 5% don't speak English at all).
1.3% of residents speak Asian or Pacific Island language at home (58% speak English very well, 34% speak English well, 7% speak English not well, 1% don't speak English at all).
4.8% of residents speak other language at home (45% speak English very well, 26% speak English well, 22% speak English not well, 7% don't speak English at all).
Foreign born population: 11,742 (16.2%)
(52.7% of them are naturalized citizens)
Percentage of workers working in this county: 82.5% Number of people working at home: 1,761 (5.6% of all workers)
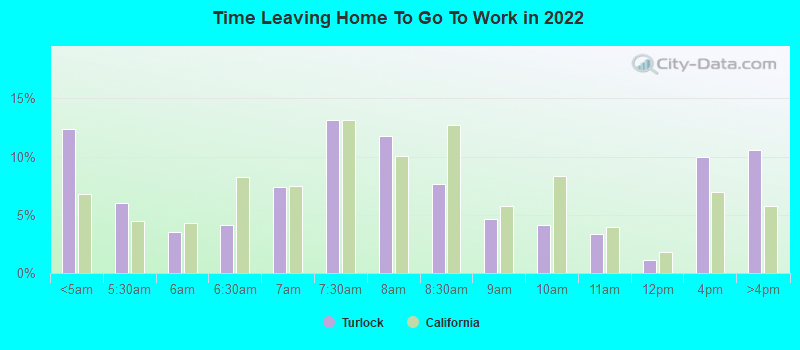
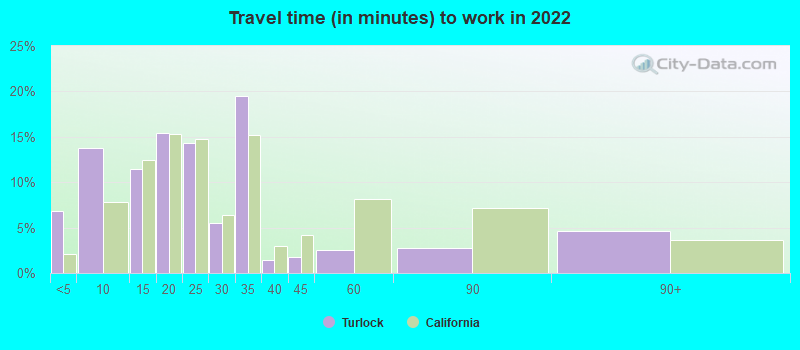
Travel time to work (commute)
Less than 5 minutes: 2,261
5 to 9 minutes: 4,862
10 to 14 minutes: 3,264
15 to 19 minutes: 4,605
20 to 24 minutes: 2,969
25 to 29 minutes: 1,474
30 to 34 minutes: 6,006
35 to 39 minutes: 736
40 to 44 minutes: 243
45 to 59 minutes: 1,471
60 to 89 minutes: 1,366
90 or more minutes: 1,659
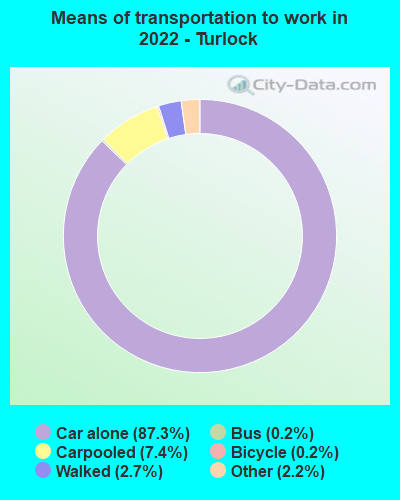
Means of transportation to work:
Drove a car alone: 27,794 (80.5%)
Carpooled: 2,827 (8.2%)
Bus: 82 (0.2%)
Taxi: 772 (2.2%)
Bicycle: 70 (0.2%)
Walked: 1,116 (3.2%)
Worked at home: 1,761 (5.1%)
Unemployment by race in 2022
Unemployment rate for White non-Hispanic residents
2.6%Males
3.8%Females
Unemployment rate for Black residents
22.7%Males
20.9%Females
Unemployment rate for American Indian and Alaska Native residents
2.6%Males
8.9%Females
Unemployment rate for Asian residents
4.6%Males
8.4%Females
Unemployment rate for other race residents
5.8%Males
8.1%Females
Unemployment rate for two or more race residents
8.2%Males
3.5%Females
Unemployment rate for Hispanic or Latino residents
6.3%Males
8.5%Females
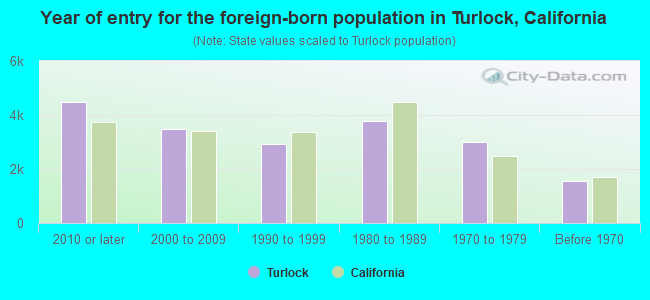
Year of entry for the foreign-born population in Turlock, California
4,4882010 or later
3,4782000 to 2009
2,9371990 to 1999
3,7621980 to 1989
2,9921970 to 1979
1,551Before 1970
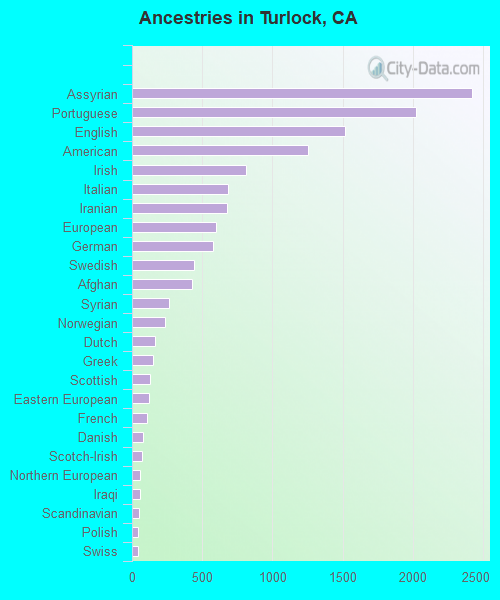
First ancestries reported:
Assyrian: 2,420 (5.2%)
Portuguese: 2,020 (4.4%)
English: 1,516 (3.3%)
American: 1,251 (2.7%)
Irish: 813 (1.8%)
Italian: 680 (1.5%)
Iranian: 679 (1.5%)
European: 595 (1.3%)
German: 573 (1.2%)
Swedish: 442 (1.0%)
Afghan: 429 (0.9%)
Syrian: 265 (0.6%)
Norwegian: 235 (0.5%)
Dutch: 163 (0.4%)
Greek: 152 (0.3%)
Scottish: 128 (0.3%)
Eastern European: 121 (0.3%)
French: 110 (0.2%)
Danish: 75 (0.2%)
Scotch-Irish: 74 (0.2%)
Northern European: 57 (0.1%)
Iraqi: 55 (0.1%)
Scandinavian: 52 (0.1%)
Polish: 45 (0.10%)
Swiss: 45 (0.10%)
African: 44 (0.09%)
Canadian: 43 (0.09%)
Palestinian: 40 (0.09%)
Russian: 34 (0.07%)
Romanian: 33 (0.07%)
Kenyan: 30 (0.06%)
Czechoslovakian: 28 (0.06%)
Lebanese: 23 (0.05%)
Armenian: 23 (0.05%)
British: 23 (0.05%)
French Canadian: 15 (0.03%)
Lithuanian: 15 (0.03%)
Brazilian: 10 (0.02%)
Maltese: 8 (0.02%)
Nigerian: 3 (0.01%)
Most common places of birth for foreign-born residents (%):
Mexico
Turlock:
42.1% (6,633)
California:
37.2% (3,881,193)
Iran
Turlock:
15.8% (2,498)
California:
2.0% (206,004)
India
Turlock:
9.5% (1,491)
California:
5.2% (539,184)
Afghanistan
Turlock:
4.2% (664)
California:
0.5% (53,260)
Iraq
Turlock:
4.2% (661)
California:
0.4% (40,941)
Guatemala
Turlock:
3.2% (512)
California:
2.8% (290,436)
Portugal
Turlock:
3.2% (509)
California:
0.2% (25,462)
Peru
Turlock:
2.7% (430)
California:
0.7% (74,025)
Azores Islands
Turlock:
2.1% (337)
California:
0.1% (8,659)
Philippines
Turlock:
1.9% (296)
California:
7.8% (818,297)
Syria
Turlock:
1.9% (295)
California:
0.3% (30,949)
Fiji
Turlock:
1.7% (269)
California:
0.3% (33,937)
Place of birth for U.S.-born residents:
This state: 53,610
Other state: 6,058
Northeast: 914
Midwest: 1,627
South: 1,829
West: 1,688
87.7% of Turlock residents lived in the same house 1 years ago. Out of people who lived in different houses, 36.8% lived in this county. Out of people who lived in different counties, 83.5% lived in California.
Turlock:
87.7%
State average:
88.9%
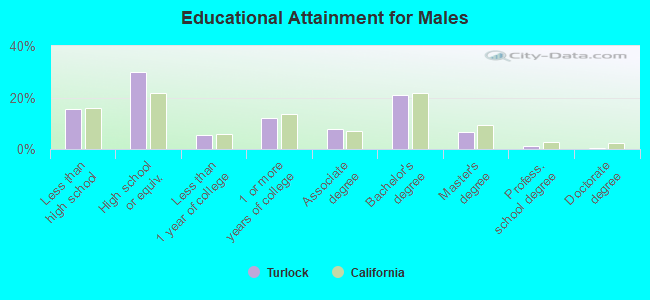
Education attainment for males 25 years and older:
No schooling: 807
Nursery to 4th grade: 349
5th and 6th grade: 502
7th and 8th grade: 255
9th grade: 359
10th grade: 278
11th grade: 132
12th grade, no diploma: 658
High school graduate (or equivalency): 6,466
Less than 1 year of college: 1,153
Some college more than 1 year, no degree: 2,623
Associate degree: 1,645
Bachelor's degree: 4,525
Master's degree: 1,406
Professional school degree: 286
Doctorate degree: 110
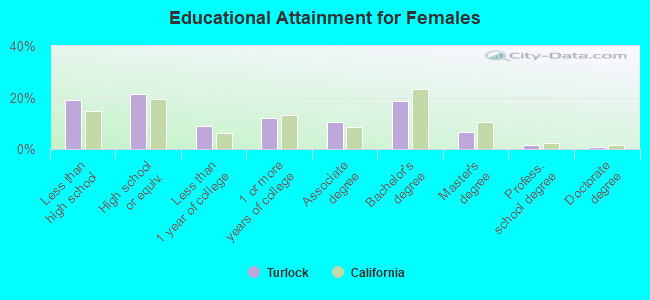
Education attainment for females 25 years and older:
No schooling: 1,009
Nursery to 4th grade: 576
5th and 6th grade: 597
7th and 8th grade: 477
9th grade: 282
10th grade: 99
11th grade: 238
12th grade, no diploma: 1,145
High school graduate (or equivalency): 5,000
Less than 1 year of college: 2,107
Some college more than 1 year, no degree: 2,810
Associate degree: 2,455
Bachelor's degree: 4,313
Master's degree: 1,550
Professional school degree: 389
Doctorate degree: 222
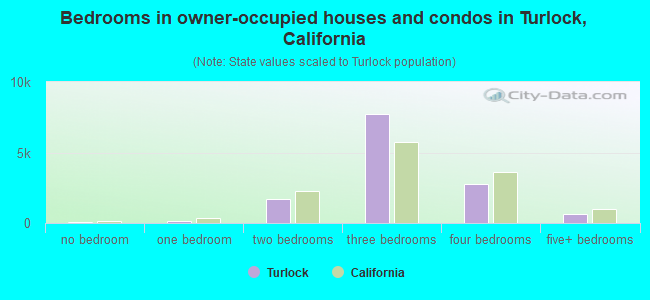
Housing units in structures:
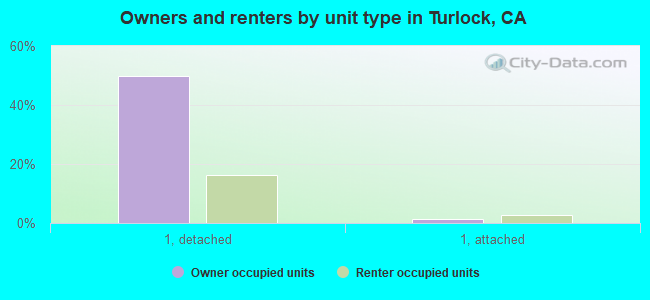
One, detached: 16,941
One, attached: 926
Two: 971
3 or 4: 2,449
5 to 9: 1,346
10 to 19: 837
20 to 49: 445
50 or more: 937
Mobile homes: 1,018
Boats, RVs, vans, etc.: 90
Median worth of mobile homes: $72,600
Housing units lacking complete plumbing facilities in 2022: 0.5%
Housing units lacking complete kitchen facilities in 2022: 1.1%
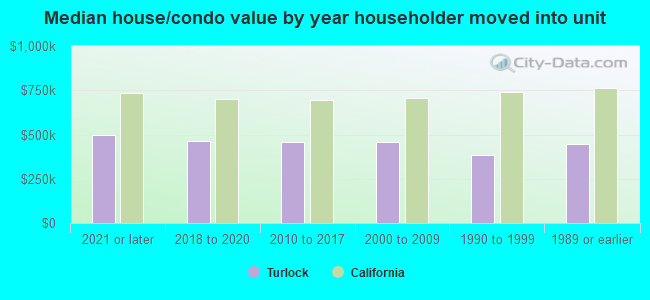
House/condo owner moved in on average 12 years ago