Tupelo, MS (Mississippi) Houses and Residents
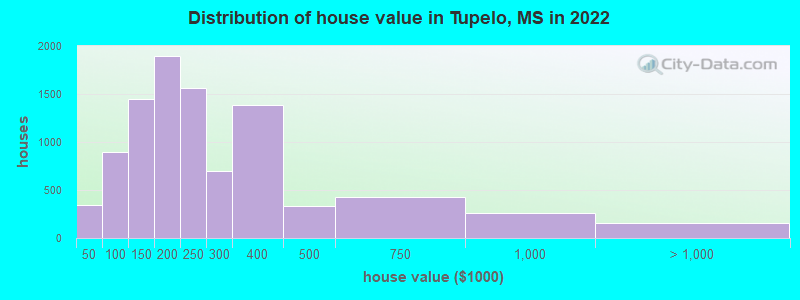
Estimated median house or condo value in 2022: $201,988 (it was $91,200 in 2000 )
Tupelo:
$201,988Mississippi:
$162,500
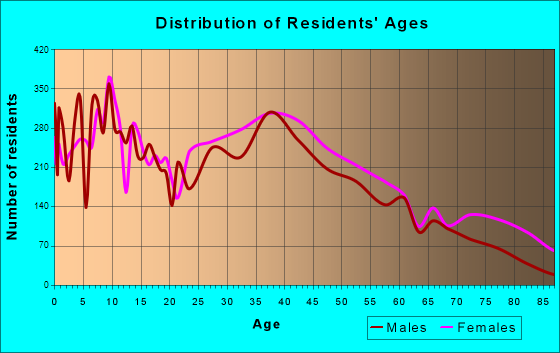
Lower value quartile - upper value quartile: $132,214 - $294,611Total population: 35,688 (Urban population: 32,005 (all inside urban clusters), Rural population: 2,413 (13 farm, 2,400 nonfarm ))
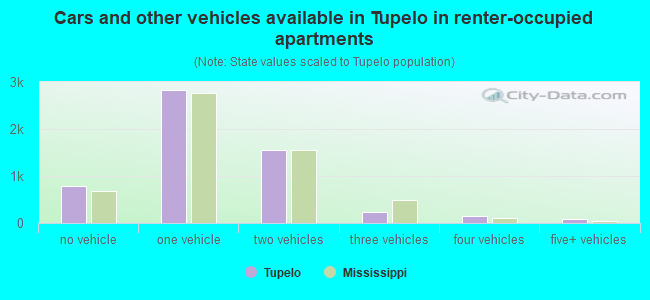
Houses: 17,489 (15,446 occupied: 9,188 owner occupied, 5,645 renter occupied )
% of renters here:
38%State:
30%
Housing density: 342 houses/condos per square mile
Median price asked for vacant for-sale houses and condos in 2022: $407,667.
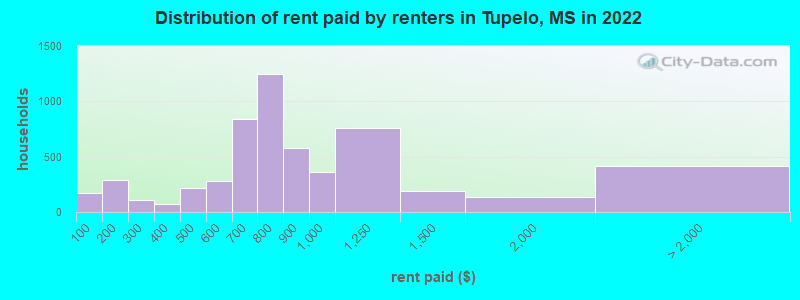
Median contract rent in 2022: $755 (lower quartile is $581, upper quartile is $998)
Median rent asked for vacant for-rent units in 2022: $1,385
Median gross rent in Tupelo, MS in 2022: $944
Housing units in Tupelo with a mortgage: 5,806 (442 second mortgage, 8 home equity loan, 307 both second mortgage and home equity loan )Houses without a mortgage: 237
Median household income for houses/condos with a mortgage: $89,227
Median household income for apartments without a mortgage: $57,935
Median monthly housing costs: $917
Data:
Median house or condo value ($)
Median house or condo value ($ change since 2000)
Median house or condo value ($) - White
Median house or condo value ($) - Black or African American
Median house or condo value ($) - Asian
Median house or condo value ($) - Hispanic or Latino
Median house or condo value ($) - American Indian and Alaska Native
Median house or condo value ($) - Multirace
Median house or condo value ($) - Other Race
Median price asked for mobile homes ($)
Household density (households per square mile)
Mean house or condo value by units in structure - 1, detached ($)
Mean house or condo value by units in structure - 1, attached ($)
Mean house or condo value by units in structure - 2 ($)
Mean house or condo value by units in structure by units in structure - 3 or 4 ($)
Mean house or condo value by units in structure - 5 or more ($)
Mean house or condo value by units in structure - Boat, RV, van, etc. ($)
Mean house or condo value by units in structure - Mobile home ($)
Median contract rent ($)
Median contract rent - Lower quartile ($)
Median contract rent - Upper quartile ($)
Median gross rent ($)
Urban houses (%)
Rural houses (%)
Houses occupied (%)
Houses occupied (% change since 2000)
Houses owner occupied (%)
Houses owner occupied (% change since 2000)
Houses renter occupied (%)
Houses renter occupied (% change since 2000)
Vacant housing units - For rent (%)
Vacant housing units - For rent (% change since 2000)
Vacant housing units - For sale only (%)
Vacant housing units - For sale only (% change since 2000)
Vacant housing units - Rented or sold, not occupied (%)
Vacant housing units - Rented or sold, not occupied (% change since 2000)
Vacant housing units - For seasonal, recreational, or occasional use (%)
Vacant housing units - For seasonal, recreational, or occasional use (% change since 2000)
Vacant housing units - For migrant workers (%)
Vacant housing units - For migrant workers (% change since 2000)
Vacant housing units - Other vacant (%)
Vacant housing units - Other vacant (% change since 2000)
Median monthly housing costs ($)
Median household income for houses/condos with a mortgage ($)
Median household income for houses/condos without a mortgage ($)
Median household income ($)
Median household income ($) - White
Median household income ($) - Black or African American
Median household income ($) - Asian
Median household income ($) - Hispanic or Latino
Median household income ($) - American Indian and Alaska Native
Median household income ($) - Multirace
Median household income ($) - Other Race
Mortgage status - with mortgage (%)
Mortgage status - with second mortgage (%)
Mortgage status - with home equity loan (%)
Mortgage status - with both second mortgage and home equity loan (%)
Mortgage status - without a mortgage (%)
Median year house/condo built
Median year apartment built
Household type by relationship - Male householder living alone (%)
Household type by relationship - Male householder not living alone (%)
Household type by relationship - Female householder living alone (%)
Household type by relationship - Female householder not living alone (%)
Household type by relationship - Opposite-Sex spouse (%)
Household type by relationship - Same-Sex spouse (%)
Household type by relationship - Opposite-Sex unmarried partner (%)
Household type by relationship - Same-Sex unmarried partner (%)
Household type by relationship - In group quarters (%)
Size of family households - 2-person household (%)
Size of family households - 3-person household (%)
Size of family households - 4-person household (%)
Size of family households - 5-person household (%)
Size of family households - 6-person household (%)
Size of family households - 7-or-more-person household (%)
Size of nonfamily households - 1-person household (%)
Size of nonfamily households - 2-person household (%)
Size of nonfamily households - 3-person household (%)
Size of nonfamily households - 4-person household (%)
Size of nonfamily households - 5-person household (%)
Size of nonfamily households - 6-person household (%)
Size of nonfamily households - 7-or-moreperson household (%)
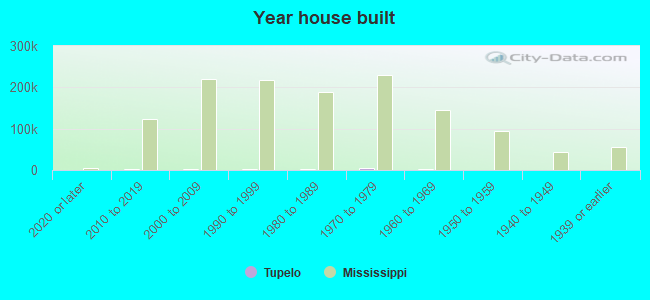
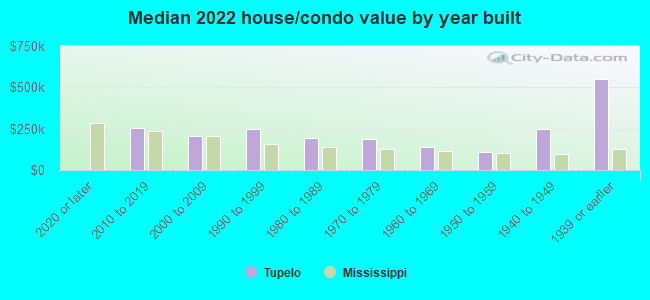
Year house built - Built 2010 or later (%)
Year house built - Built 2000 to 2009 (%)
Year house built - Built 1990 to 1999 (%)
Year house built - Built 1980 to 1989 (%)
Year house built - Built 1970 to 1979 (%)
Year house built - Built 1960 to 1969 (%)
Year house built - Built 1950 to 1959 (%)
Year house built - Built 1940 to 1949 (%)
Year house built - Built 1939 or earlier (%)
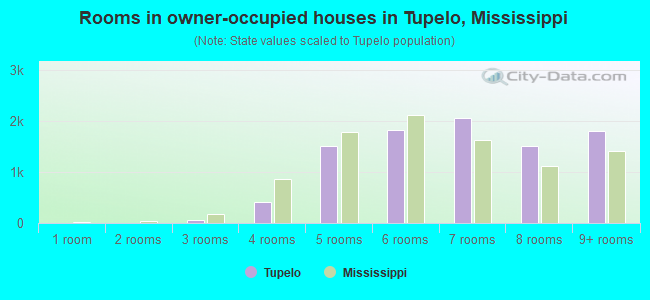
Median number of rooms in houses and condos
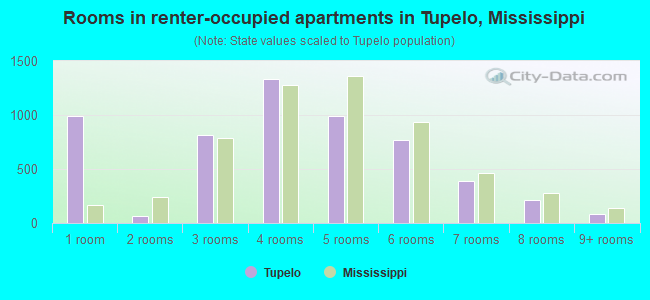
Median number of rooms in apartments
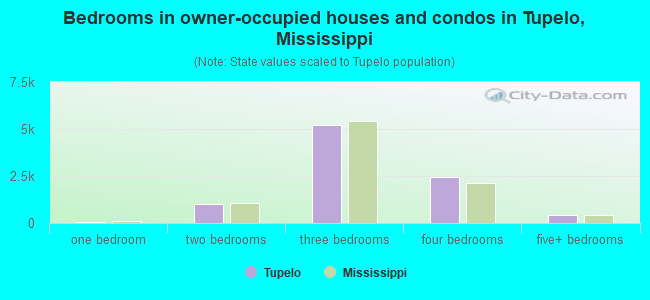
Median number of bedrooms in owner occupied houses
Mean number of bedrooms in owner occupied houses
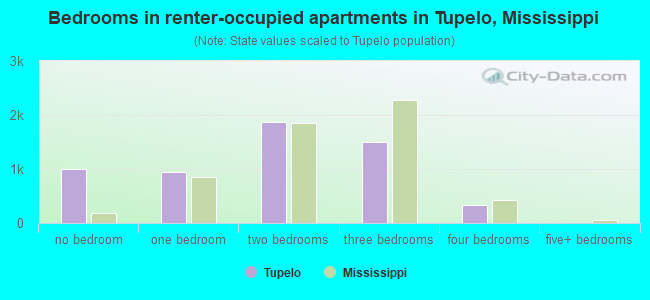
Median number of bedrooms in renter occupied houses
Mean number of bedrooms in renter occupied houses
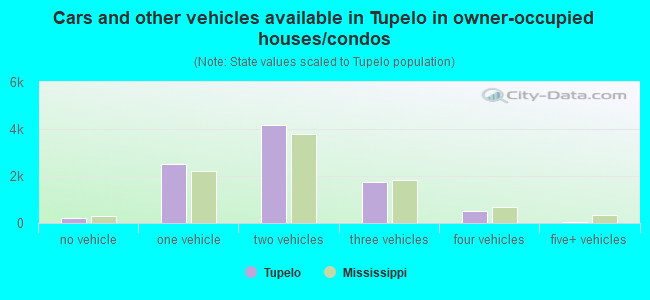
Median number of vehichles in owner occupied houses
Mean number of vehichles in owner occupied houses
Median number of vehichles in renter occupied houses
Mean number of vehichles in renter occupied houses
Rooms in owner-occupied houses - 1 room (%)
Rooms in owner-occupied houses - 2 rooms (%)
Rooms in owner-occupied houses - 3 rooms (%)
Rooms in owner-occupied houses - 4 rooms (%)
Rooms in owner-occupied houses - 5 rooms (%)
Rooms in owner-occupied houses - 6 rooms (%)
Rooms in owner-occupied houses - 7 rooms (%)
Rooms in owner-occupied houses - 8 rooms (%)
Rooms in owner-occupied houses - 9+ rooms (%)
Rooms in renter-occupied houses - 1 room (%)
Rooms in renter-occupied houses - 2 rooms (%)
Rooms in renter-occupied houses - 3 rooms (%)
Rooms in renter-occupied houses - 4 rooms (%)
Rooms in renter-occupied houses - 5 rooms (%)
Rooms in renter-occupied houses - 6 rooms (%)
Rooms in renter-occupied houses - 7 rooms (%)
Rooms in renter-occupied houses - 8 rooms (%)
Rooms in renter-occupied houses - 9+ rooms (%)
Bedrooms in owner-occupied houses - no bedrooms (%)
Bedrooms in owner-occupied houses - 1 bedroom (%)
Bedrooms in owner-occupied houses - 2 bedrooms (%)
Bedrooms in owner-occupied houses - 3 bedrooms (%)
Bedrooms in owner-occupied houses - 4 bedrooms (%)
Bedrooms in owner-occupied houses - 5+ bedrooms (%)
Bedrooms in renter-occupied houses - no bedrooms (%)
Bedrooms in renter-occupied houses - 1 bedroom (%)
Bedrooms in renter-occupied houses - 2 bedrooms (%)
Bedrooms in renter-occupied houses - 3 bedrooms (%)
Bedrooms in renter-occupied houses - 4 bedrooms (%)
Bedrooms in renter-occupied houses - 5+ bedrooms (%)
Vehicles available in owner-occupied houses - no vehicle available (%)
Vehicles available in owner-occupied houses - 1 vehicle available(%)
Vehicles available in owner-occupied houses - 2 Vehicles available (%)
Vehicles available in owner-occupied houses - 3 Vehicles available (%)
Vehicles available in owner-occupied houses - 4 Vehicles available (%)
Vehicles available in owner-occupied houses - 5+ Vehicles available (%)
Vehicles available in renter-occupied houses - no vehicle available (%)
Vehicles available in renter-occupied houses - 1 vehicle available (%)
Vehicles available in renter-occupied houses - 2 Vehicles available (%)
Vehicles available in renter-occupied houses - 3 Vehicles available (%)
Vehicles available in renter-occupied houses - 4 Vehicles available (%)
Vehicles available in renter-occupied houses - 5+ Vehicles available (%)
Housing units in structures - 1, detached (%)
Housing units in structures - 1, attached (%)
Housing units in structures - 2 (%)
Housing units in structures - 3 or 4 (%)
Housing units in structures - 5 to 9 (%)
Housing units in structures - 10 to 19 (%)
Housing units in structures - 20 to 49 (%)
Housing units in structures - 50 or more (%)
Housing units in structures - Mobile home (%)
Housing units in structures - Boat, RV, van, etc. (%)
Housing units in structures - Owners - 1, detached (%)
Housing units in structures - Owners - 1, attached (%)
Housing units in structures - Owners - 2 (%)
Housing units in structures - Owners - 3 or 4 (%)
Housing units in structures - Owners - 5 to 9 (%)
Housing units in structures - Owners - 10 to 19 (%)
Housing units in structures - Owners - 20 to 49 (%)
Housing units in structures - Owners - 50 or more (%)
Housing units in structures - Owners - Mobile home (%)
Housing units in structures - Owners - Boat, RV, van, etc. (%)
Housing units in structures - Renters - 1, detached (%)
Housing units in structures - Renters - 1, attached (%)
Housing units in structures - Renters - 2 (%)
Housing units in structures - Renters - 3 or 4 (%)
Housing units in structures - Renters - 5 to 9 (%)
Housing units in structures - Renters - 10 to 19 (%)
Housing units in structures - Renters - 20 to 49 (%)
Housing units in structures - Renters - 50 or more (%)
Housing units in structures - Renters - Mobile home (%)
Housing units in structures - Renters - Boat, RV, van, etc. (%)
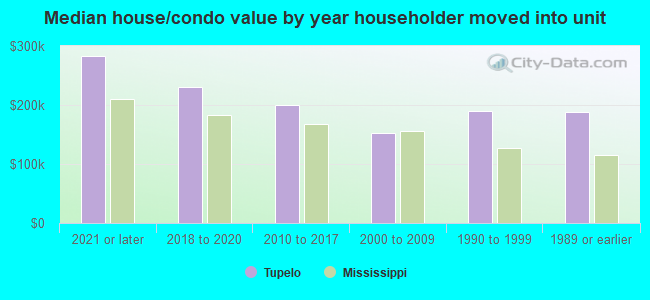
House/condo owner moved in on average (years ago)
Renter moved in on average (years ago)
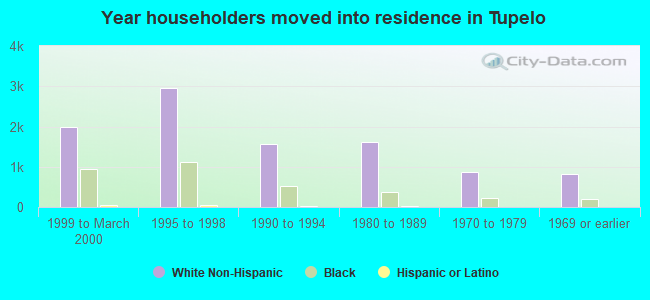
Year householder moved into unit - Moved in 1999 to March 2000 (%)
Year householder moved into unit - Moved in 1999 to March 2000 (%) - White
Year householder moved into unit - Moved in 1999 to March 2000 (%) - Black or African American
Year householder moved into unit - Moved in 1999 to March 2000 (%) - Asian
Year householder moved into unit - Moved in 1999 to March 2000 (%) - Hispanic or Latino
Year householder moved into unit - Moved in 1999 to March 2000 (%) - American Indian and Alaska Native
Year householder moved into unit - Moved in 1999 to March 2000 (%) - Multirace
Year householder moved into unit - Moved in 1999 to March 2000 (%) - Other Race
Year householder moved into unit - Moved in 1995 to 1998 (%)
Year householder moved into unit - Moved in 1995 to 1998 (%) - White
Year householder moved into unit - Moved in 1995 to 1998 (%) - Black or African American
Year householder moved into unit - Moved in 1995 to 1998 (%) - Asian
Year householder moved into unit - Moved in 1995 to 1998 (%) - Hispanic or Latino
Year householder moved into unit - Moved in 1995 to 1998 (%) - American Indian and Alaska Native
Year householder moved into unit - Moved in 1995 to 1998 (%) - Multirace
Year householder moved into unit - Moved in 1995 to 1998 (%) - Other Race
Year householder moved into unit - Moved in 1990 to 1994 (%)
Year householder moved into unit - Moved in 1990 to 1994 (%) - White
Year householder moved into unit - Moved in 1990 to 1994 (%) - Black or African American
Year householder moved into unit - Moved in 1990 to 1994 (%) - Asian
Year householder moved into unit - Moved in 1990 to 1994 (%) - Hispanic or Latino
Year householder moved into unit - Moved in 1990 to 1994 (%) - American Indian and Alaska Native
Year householder moved into unit - Moved in 1990 to 1994 (%) - Multirace
Year householder moved into unit - Moved in 1990 to 1994 (%) - Other Race
Year householder moved into unit - Moved in 1980 to 1989 (%)
Year householder moved into unit - Moved in 1980 to 1989 (%) - White
Year householder moved into unit - Moved in 1980 to 1989 (%) - Black or African American
Year householder moved into unit - Moved in 1980 to 1989 (%) - Asian
Year householder moved into unit - Moved in 1980 to 1989 (%) - Hispanic or Latino
Year householder moved into unit - Moved in 1980 to 1989 (%) - American Indian and Alaska Native
Year householder moved into unit - Moved in 1980 to 1989 (%) - Multirace
Year householder moved into unit - Moved in 1980 to 1989 (%) - Other Race
Year householder moved into unit - Moved in 1970 to 1979 (%)
Year householder moved into unit - Moved in 1970 to 1979 (%) - White
Year householder moved into unit - Moved in 1970 to 1979 (%) - Black or African American
Year householder moved into unit - Moved in 1970 to 1979 (%) - Asian
Year householder moved into unit - Moved in 1970 to 1979 (%) - Hispanic or Latino
Year householder moved into unit - Moved in 1970 to 1979 (%) - American Indian and Alaska Native
Year householder moved into unit - Moved in 1970 to 1979 (%) - Multirace
Year householder moved into unit - Moved in 1970 to 1979 (%) - Other Race
Year householder moved into unit - Moved in 1969 or earlier (%)
Year householder moved into unit - Moved in 1969 or earlier (%) - White
Year householder moved into unit - Moved in 1969 or earlier (%) - Black or African American
Year householder moved into unit - Moved in 1969 or earlier (%) - Asian
Year householder moved into unit - Moved in 1969 or earlier (%) - Hispanic or Latino
Year householder moved into unit - Moved in 1969 or earlier (%) - American Indian and Alaska Native
Year householder moved into unit - Moved in 1969 or earlier (%) - Multirace
Year householder moved into unit - Moved in 1969 or earlier (%) - Other Race
Housing units lacking complete plumbing facilities (%)
Housing units lacking complete kitchen facilities (%)
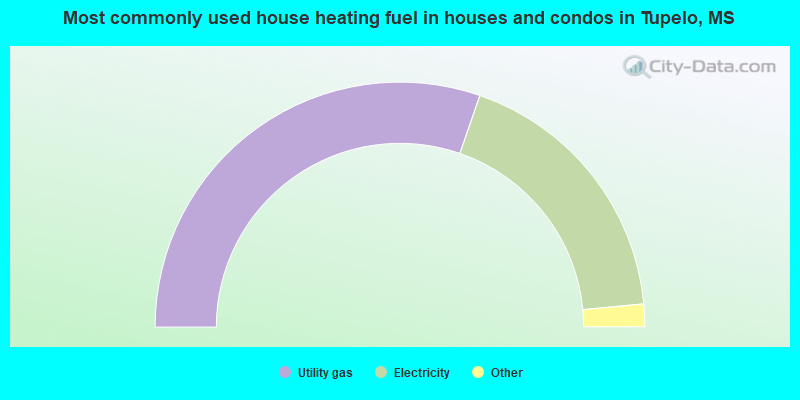
House heating fuel used in houses and condos - Utility gas (%)
House heating fuel used in houses and condos - Bottled, tank, or LP gas (%)
House heating fuel used in houses and condos - Electricity (%)
House heating fuel used in houses and condos - Fuel oil, kerosene, etc. (%)
House heating fuel used in houses and condos - Coal or coke (%)
House heating fuel used in houses and condos - Wood (%)
House heating fuel used in houses and condos - Solar energy (%)
House heating fuel used in houses and condos - Other fuel (%)
House heating fuel used in houses and condos - No fuel used (%)
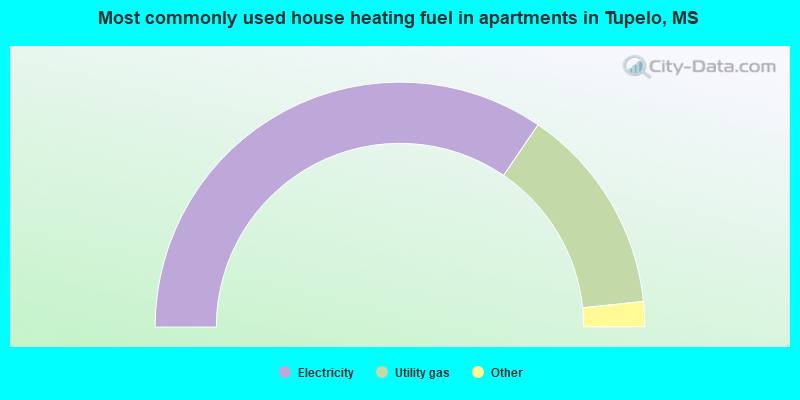
House heating fuel used in apartments - Utility gas (%)
House heating fuel used in apartments - Bottled, tank, or LP gas (%)
House heating fuel used in apartments - Electricity (%)
House heating fuel used in apartments - Fuel oil, kerosene, etc. (%)
House heating fuel used in apartments - Coal or coke (%)
House heating fuel used in apartments - Wood (%)
House heating fuel used in apartments - Solar energy (%)
House heating fuel used in apartments - Other fuel (%)
House heating fuel used in apartments - No fuel used (%)
Latest news about housing in Tupelo, MS collected exclusively by city-data.com from local newspapers, TV, and radio stations
Median year house/condo built: 1985Median year apartment built: 1976Household type by relationship:
Households: 37,764
Male householders: 6,720 (2,122 living alone ), Female householders: 8,490 (2,975 living alone )6,969 spouses (6,913 opposite-sex spouses ), 417 unmarried partners , (406 opposite-sex unmarried partners ), 11,463 children (10,709 natural , 196 adopted , 558 stepchildren ), 1,079 grandchildren , 153 brothers or sisters , 294 parents , 39 foster children , 642 other relatives , 659 non-relatives In group quarters: 833
Size of family households: 4,478 2-persons , 2,227 3-persons , 1,862 4-persons , 544 5-persons , 349 6-persons , 96 7-or-more-persons .
Size of nonfamily households: 5,046 1-person , 195 2-persons , 81 3-persons , 29 5-persons .
5,306 married couples with children. single-parent households (270 men , 2,409 women ).
95.4% of residents of Tupelo speak English at home. of residents speak Spanish at home (51% speak English very well , 6% speak English well , 12% speak English not well , 31% don't speak English at all ).of residents speak other Indo-European language at home (78% speak English very well , 16% speak English well , 6% speak English not well ).of residents speak Asian or Pacific Island language at home (74% speak English very well , 26% don't speak English at all ).of residents speak other language at home (80% speak English very well , 20% speak English well ).
Foreign born population: 1,133 (3.0%)of them are naturalized citizens )
Median number of rooms in houses and condos:
Median number of rooms in apartments
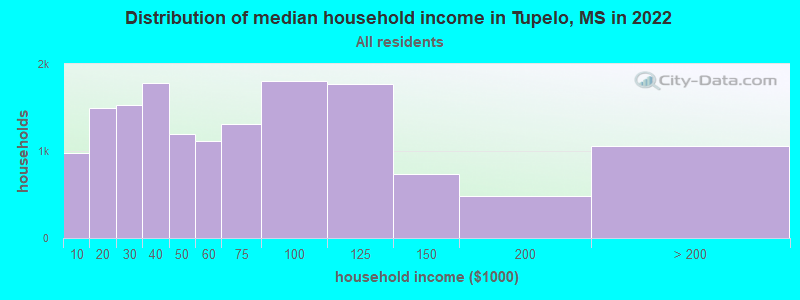
Tupelo, MS household income distribution 974 Less than $10,0001,498 $10,000 to $19,9991,524 $20,000 to $29,9991,777 $30,000 to $39,9991,196 $40,000 to $49,9991,113 $50,000 to $59,9991,307 $60,000 to $74,9991,809 $75,000 to $99,9991,775 $100,000 to $124,999732 $125,000 to $149,999488 $150,000 to $199,9991,062 $200,000 or more
Home value of owner - occupied houses in 2022 in Tupelo, MS 42 Less than $10,00078 $10,000 to $14,99937 $15,000 to $19,999132 $20,000 to $24,9996 $30,000 to $34,99926 $35,000 to $39,99920 $40,000 to $49,99945 $50,000 to $59,999107 $60,000 to $69,999207 $70,000 to $79,999401 $80,000 to $89,999116 $90,000 to $99,999753 $100,000 to $124,999689 $125,000 to $149,999851 $150,000 to $174,9991,044 $175,000 to $199,9991,561 $200,000 to $249,999700 $250,000 to $299,9991,381 $300,000 to $399,999333 $400,000 to $499,999428 $500,000 to $749,999257 $750,000 to $999,999116 $1,000,000 to $1,499,99916 $1,500,000 to $1,999,99925 $2,000,000 or moreRent paid by renters in 2022 in Tupelo, MS 174 Less than $100127 $100 to $149158 $150 to $19971 $200 to $24940 $250 to $29923 $300 to $34944 $350 to $39955 $400 to $449159 $450 to $499159 $500 to $549116 $550 to $599471 $600 to $649368 $650 to $699577 $700 to $749666 $750 to $799581 $800 to $899360 $900 to $999756 $1,000 to $1,249188 $1,250 to $1,499140 $1,500 to $1,9998 $2,500 to $2,999404 No cash rent
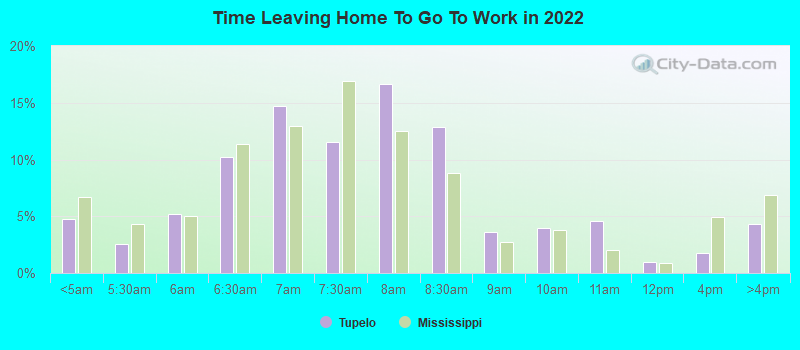
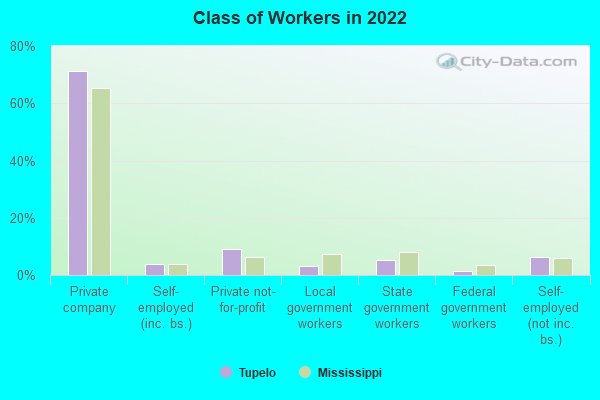
Percentage of workers working in this county: 80.2%Number of people working at home: 1,070 (5.9% of all workers )
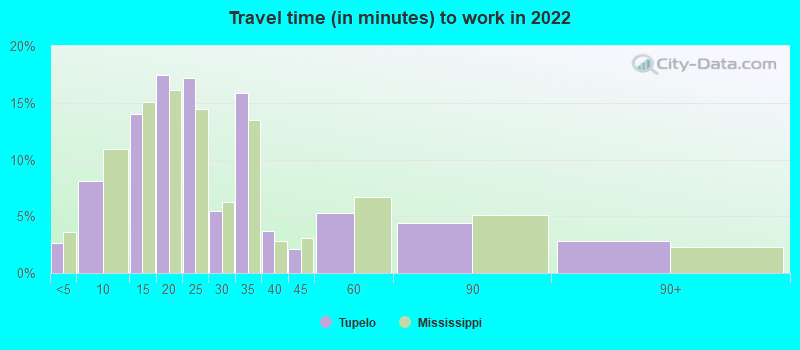
Travel time to work (commute)
Less than 5 minutes: 8755 to 9 minutes: 2,54410 to 14 minutes: 4,31715 to 19 minutes: 3,56820 to 24 minutes: 2,25925 to 29 minutes: 44330 to 34 minutes: 1,33735 to 39 minutes: 11640 to 44 minutes: 9245 to 59 minutes: 46760 to 89 minutes: 22990 or more minutes: 257
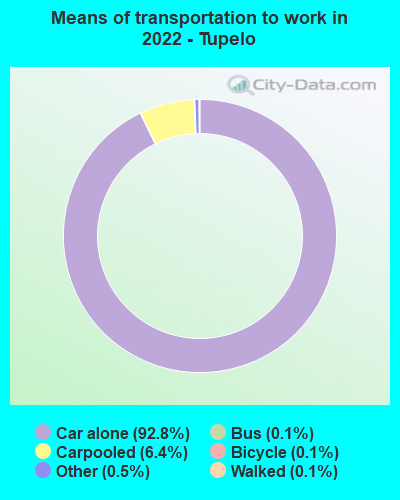
Means of transportation to work:
Drove a car alone: 34,059 (88.7%)Carpooled: 2,605 (6.8%)Bus : 44 (0.1%)Taxi: 141 (0.4%)Bicycle: 41 (0.1%)Walked: 63 (0.2%)Worked at home: 1,070 (2.8%)
Unemployment by race in 2022
Unemployment rate for White non-Hispanic residents 5.8% Males2.5% FemalesUnemployment rate for Black residents 3.1% Males9.4% FemalesUnemployment rate for American Indian and Alaska Native residents 100.0% MalesUnemployment rate for other race residents 9.2% FemalesUnemployment rate for two or more race residents 37.3% Males16.1% FemalesUnemployment rate for Hispanic or Latino residents 8.1% Females
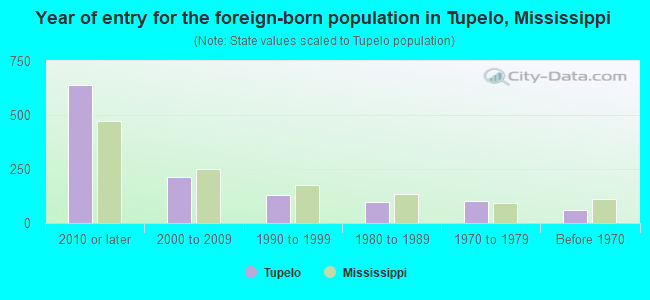
Year of entry for the foreign-born population in Tupelo, Mississippi
639 2010 or later 212 2000 to 2009 130 1990 to 1999 95 1980 to 1989 100 1970 to 1979 59 Before 1970
First ancestries reported:
English: 2,885 (13.3%)
American: 2,425 (11.2%)
Irish: 1,118 (5.1%)
German: 678 (3.1%)
Scotch-Irish: 559 (2.6%)
European: 435 (2.0%)
Scottish: 242 (1.1%)
Italian: 195 (0.9%)
Jamaican: 169 (0.8%)
Nigerian: 108 (0.5%)
African: 106 (0.5%)
Welsh: 35 (0.2%)
Scandinavian: 28 (0.1%)
French: 26 (0.1%)
Polish: 26 (0.1%)
Jordanian: 25 (0.1%)
Pennsylvania German: 22 (0.1%)
Northern European: 13 (0.06%)
Dutch: 10 (0.05%)
Swiss: 10 (0.05%)
Greek: 6 (0.03%) Most common places of birth for foreign-born residents (%): Mexico Tupelo:
20.8% (221)Mississippi:
25.4% (17,354)
India Tupelo:
20.1% (213)Mississippi:
6.3% (4,325)
Guatemala Tupelo:
15.0% (159)Mississippi:
5.5% (3,723)
Honduras Tupelo:
11.5% (122)Mississippi:
5.1% (3,475)
England Tupelo:
6.9% (73)Mississippi:
1.5% (1,053)
Yemen Tupelo:
6.4% (68)Mississippi:
1.0% (680)
Thailand Tupelo:
5.9% (63)Mississippi:
1.2% (815)
Pakistan Tupelo:
5.3% (56)Mississippi:
0.7% (455)
Senegal Tupelo:
2.3% (24)Mississippi:
0.2% (131)
Congo Tupelo:
2.2% (23)Mississippi:
0.0% (28)
Jordan Tupelo:
1.8% (19)Mississippi:
0.6% (396)
Germany Tupelo:
1.6% (17)Mississippi:
3.1% (2,126)
Place of birth for U.S.-born residents:
This state: 27,374Other state: 9,115Northeast: 311Midwest: 2,646South: 5,549West: 544 90.3% of Tupelo residents lived in the same house 1 years ago.
Out of people who lived in different houses, 31.0% lived in this county.
Out of people who lived in different counties, 66.2% lived in Mississippi.
Tupelo:
90.3%State average:
88.9%
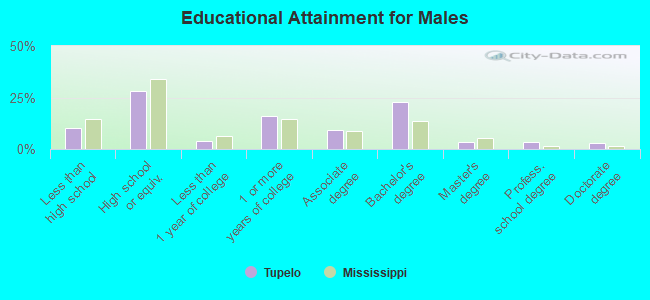
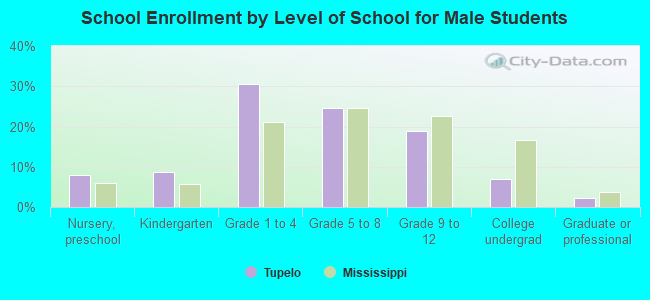
Education attainment for males 25 years and older:
No schooling: 104Nursery to 4th grade: 445th and 6th grade: 457th and 8th grade: 1549th grade: 9610th grade: 26511th grade: 34612th grade, no diploma: 78High school graduate (or equivalency): 3,052Less than 1 year of college: 411Some college more than 1 year, no degree: 1,727Associate degree: 1,023Bachelor's degree: 2,485Master's degree: 392Professional school degree: 359Doctorate degree: 330
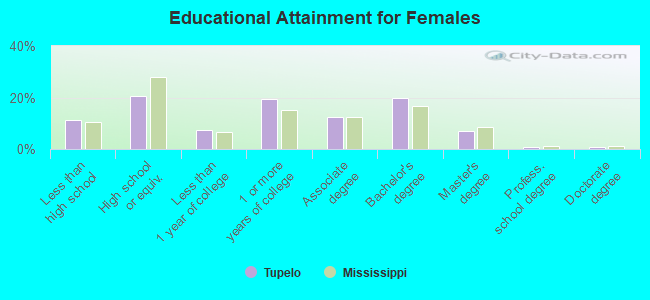
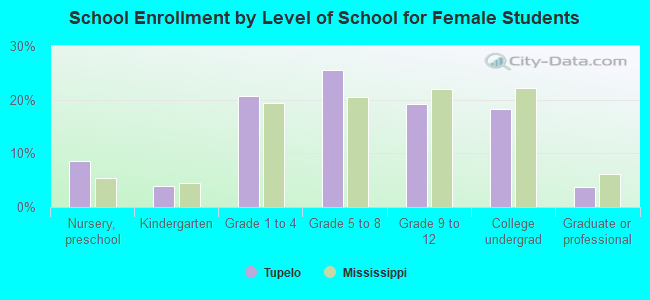
Education attainment for females 25 years and older:
No schooling: 156Nursery to 4th grade: 285th and 6th grade: 377th and 8th grade: 6019th grade: 17810th grade: 12111th grade: 29212th grade, no diploma: 152High school graduate (or equivalency): 2,880Less than 1 year of college: 1,033Some college more than 1 year, no degree: 2,701Associate degree: 1,727Bachelor's degree: 2,751Master's degree: 992Professional school degree: 113Doctorate degree: 119
Housing units in structures:
One, detached: 11,957One, attached: 327Two: 1,3703 or 4: 5775 to 9: 73210 to 19: 78220 to 49: 25550 or more: 1,254Mobile homes: 232Housing units lacking complete plumbing facilities in 2022: 2.6%Housing units lacking complete kitchen facilities in 2022: 5.2%House/condo owner moved in on average 10 years ago
Renter moved in on average 3 years ago
Private vs. public school enrollment:
Students in private schools in grades 1 to 8 (elementary and middle school): 1,091 Here:
23.0%Mississippi:
16.1%
Students in private schools in grades 9 to 12 (high school): 373 Here:
20.6%Mississippi:
14.6%
Students in private undergraduate colleges: 45 Here:
3.7%Mississippi:
12.8%