Tucson, AZ (Arizona) Houses and Residents
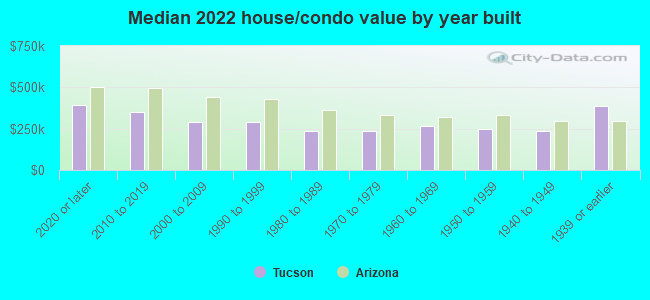
| Tucson: | $268,000 |
| Arizona: | $402,800 |
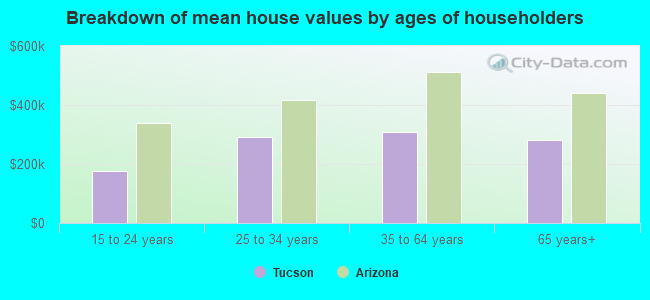
Mean price in 2022:
Detached houses: $308,227
Here: $308,227 State: $521,408 Townhouses or other attached units: $227,918
Here: $227,918 State: $387,465 In 2-unit structures: $3,792,242
Here: $3,792,242 State: $1,060,724 In 3-to-4-unit structures: $196,320
Here: $196,320 State: $342,505 In 5-or-more-unit structures: $226,703
Here: $226,703 State: $371,286 Mobile homes: $65,019
Here: $65,019 State: $141,516 Occupied boats, RVs, vans, etc.: $18,208
Here: $18,208 State: $60,504
Total population: 527,972 (Urban population: 482,913 (466,753 inside urbanized areas, 16,160 inside urban clusters), Rural population: 3,678 (all nonfarm))
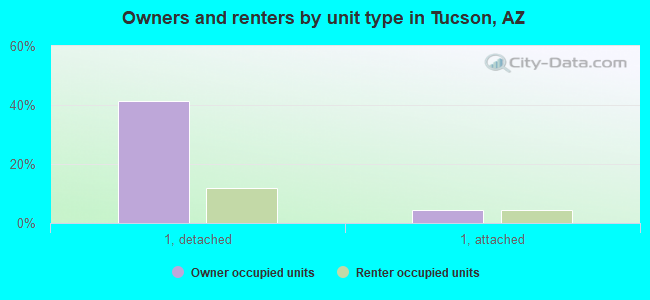
Houses: 249,788 (228,268 occupied: 119,054 owner occupied, 109,214 renter occupied)
| % of renters here: | 48% |
| State: | 33% |
Housing density: 1,283 houses/condos per square mile
Median price asked for vacant for-sale houses and condos in 2022: $232,505.
Median contract rent in 2022: $912 (lower quartile is $713, upper quartile is $1,221)
Median rent asked for vacant for-rent units in 2022: $998
Median gross rent in Tucson, AZ in 2022: $1,051
Housing units in Tucson with a mortgage: 71,230 (3,899 second mortgage, 174 home equity loan, 3,434 both second mortgage and home equity loan)
Houses without a mortgage: 1,426
Median household income for houses/condos with a mortgage: $78,827
Median household income for apartments without a mortgage: $55,131
Median monthly housing costs: $1,015
Compare current foreclosures in Tucson, AZ:
| Photo | Address | Area | Beds / Baths | Price | Details |
|---|---|---|---|---|---|

|
#1
N Fairview Ave
Tucson, AZ 85705
|
1,792 sq. feet
|
2 baths 4 beds |
show details | |

|
#2
S Buckwheat Dr
Tucson, AZ 85710
|
1,783 sq. feet
|
2 baths 3 beds |
show details | |

|
#3
E 29th St
Tucson, AZ 85748
|
2,180 sq. feet
|
2 baths 4 beds |
show details | |

|
#4
E Kingston Dr
Tucson, AZ 85710
|
2,449 sq. feet
|
2 baths 5 beds |
show details | |

|
#5
E Eastview Dr
Tucson, AZ 85710
|
1,972 sq. feet
|
2 baths 3 beds |
show details | |

|
#6
S Winmor Ave
Tucson, AZ 85713
|
1,699 sq. feet
|
1 baths 3 beds |
show details | |

|
#7
S Zircon Crystal Dr
Tucson, AZ 85747
|
2,156 sq. feet
|
2 baths 4 beds |
show details | |

|
#8
S Paseo Don Rolando
Tucson, AZ 85746
|
1,862 sq. feet
|
2 baths 4 beds |
show details | |

|
#9
W Bopp Rd
Tucson, AZ 85735
|
1,536 sq. feet
|
2 baths 3 beds |
show details | |

|
#10
S Birch Ave
Tucson, AZ 85730
|
1,313 sq. feet
|
2 baths 3 beds |
show details |
| Photo | Address | Area | Beds / Baths | Price | Details |
|---|---|---|---|---|---|

|
#11
W Copperwood Way
Tucson, AZ 85757
|
1,727 sq. feet
|
2 baths 4 beds |
show details | |

|
#12
S Black Moon Dr
Tucson, AZ 85730
|
1,140 sq. feet
|
2 baths 3 beds |
show details | |

|
#13
W Jusnic Cir
Tucson, AZ 85705
|
1,080 sq. feet
|
2 baths 3 beds |
show details | |

|
#14
E Drexel Manor Stra
Tucson, AZ 85706
|
2,072 sq. feet
|
3 baths 4 beds |
show details | |

|
#15
N Lyra Ln
Tucson, AZ 85742
|
1,513 sq. feet
|
3 baths 3 beds |
show details | |

|
#16
S Logger Dr
Tucson, AZ 85746
|
1,413 sq. feet
|
2 baths 3 beds |
show details | |

|
#17
W Calle De Rosita
Tucson, AZ 85746
|
1,448 sq. feet
|
2 baths 3 beds |
show details | |

|
#18
E Calle Orion
Tucson, AZ 85710
|
1,654 sq. feet
|
2 baths 3 beds |
show details | |

|
#19
W 34th St
Tucson, AZ 85713
|
1,469 sq. feet
|
2 baths 3 beds |
show details | |

|
#20
S Egyptian Dr
Tucson, AZ 85747
|
2,213 sq. feet
|
2 baths 4 beds |
show details |
| Photo | Address | Area | Beds / Baths | Price | Details |
|---|---|---|---|---|---|

|
#21
E Potomac Pl
Tucson, AZ 85748
|
1,475 sq. feet
|
2 baths 3 beds |
show details | |

|
#22
W District St
Tucson, AZ 85714
|
1,782 sq. feet
|
2 baths 4 beds |
show details | |

|
#23
E Malvern St
Tucson, AZ 85711
|
- sq. feet
|
2 baths 4 beds |
show details | |

|
#24
W Calle Sancho Panza
Tucson, AZ 85757
|
2,094 sq. feet
|
2 baths 4 beds |
show details | |

|
#25
E Lakeside Dr
Tucson, AZ 85730
|
1,680 sq. feet
|
2 baths 3 beds |
show details | |

|
#26
W Santa Luisa St
Tucson, AZ 85706
|
1,305 sq. feet
|
2 baths 3 beds |
show details | |

|
#27
N Warner Ter
Tucson, AZ 85705
|
1,369 sq. feet
|
3 baths 3 beds |
show details | |

|
#28
S Redwater Dr
Tucson, AZ 85757
|
1,873 sq. feet
|
3 baths 4 beds |
show details | |

|
#29
S Hunnic Dr
Tucson, AZ 85747
|
1,417 sq. feet
|
2 baths 3 beds |
show details | |

|
#30
E 5th St
Tucson, AZ 85711
|
1,343 sq. feet
|
1 baths 2 beds |
show details |
| Photo | Address | Area | Beds / Baths | Price | Details |
|---|---|---|---|---|---|

|
#31
E Warwick Vis
Tucson, AZ 85713
|
1,326 sq. feet
|
2 baths 2 beds |
show details | |

|
#32
S Yellow Rattle Ct
Tucson, AZ 85756
|
1,634 sq. feet
|
2 baths 3 beds |
show details | |

|
#33
S Olsen Ave
Tucson, AZ 85713
|
945 sq. feet
|
1 baths 3 beds |
show details | |

|
#34
W Tucana St
Tucson, AZ 85745
|
4,496 sq. feet
|
3 baths 5 beds |
show details | |

|
#35
W Nebraska St
Tucson, AZ 85706
|
988 sq. feet
|
1 baths 3 beds |
show details | |

|
#36
S San Rafael Dr
Tucson, AZ 85713
|
1,471 sq. feet
|
2 baths 4 beds |
show details | |

|
#37
N Monmouth Ct
Tucson, AZ 85742
|
1,495 sq. feet
|
2 baths 4 beds |
show details | |

|
#38
W Firebrook Rd
Tucson, AZ 85741
|
1,330 sq. feet
|
2 baths 3 beds |
show details | |

|
#39
E Paseo Luisa
Tucson, AZ 85711
|
1,624 sq. feet
|
2 baths 3 beds |
show details | |

|
#40
N Sabino Creek Pl
Tucson, AZ 85750
|
2,569 sq. feet
|
3 baths 4 beds |
show details |
| Photo | Address | Area | Beds / Baths | Price | Details |
|---|---|---|---|---|---|

|
#41
W Brightwater Way
Tucson, AZ 85757
|
1,601 sq. feet
|
2 baths 3 beds |
show details | |

|
#42
W Nebraska St
Tucson, AZ 85746
|
2,341 sq. feet
|
2 baths 4 beds |
show details | |

|
#43
W Cattail Pl
Tucson, AZ 85745
|
1,278 sq. feet
|
2 baths 3 beds |
show details | |

|
#44
E Victoria Ln
Tucson, AZ 85730
|
1,385 sq. feet
|
2 baths 3 beds |
show details | |

|
#45
S Sarnoff Dr
Tucson, AZ 85730
|
1,471 sq. feet
|
2 baths 3 beds |
show details | |

|
#46
S Downing Ave
Tucson, AZ 85756
|
1,428 sq. feet
|
2 baths 3 beds |
show details | |

|
#47
S Helena Stra
Tucson, AZ 85706
|
1,475 sq. feet
|
2 baths 3 beds |
show details | |

|
#48
W Window Rock Dr
Tucson, AZ 85745
|
2,045 sq. feet
|
2 baths 4 beds |
show details | |

|
#49
N Camino Esplanade
Tucson, AZ 85750
|
1,975 sq. feet
|
2 baths 3 beds |
show details | |

|
Check over 1 million property listings on Foreclosure.com!
|
browse all offers | |||

Latest news about housing in Tucson, AZ collected exclusively by city-data.com from local newspapers, TV, and radio stations

 | Any truly quiet apartments for rent in Tucson? (8 replies) |
| Rent Condo, Townhouse, Home in Tucson (15 replies) |
| Honest Assessment Of Tucson Housing Market 2021 (14 replies) |
| Considering move to Tucson from Phoenix: Buying a condo or home (5 replies) |
| Tucson Trailer Parks (4 replies) |
| Small furnished apartments with in-unit laundry? (8 replies) |
Median year apartment built: 1982
Household type by relationship:
Households: 546,598- Male householders: 109,124 (41,118 living alone), Female householders: 119,144 (45,098 living alone)
71,540 spouses (69,818 opposite-sex spouses), 23,979 unmarried partners, (23,092 opposite-sex unmarried partners), 135,072 children (125,434 natural, 4,742 adopted, 4,896 stepchildren), 15,490 grandchildren, 7,500 brothers or sisters, 5,496 parents, 293 foster children, 9,644 other relatives, 25,362 non-relatives
- In group quarters: 23,954
Size of family households: 50,928 2-persons, 27,311 3-persons, 21,279 4-persons, 11,244 5-persons, 4,947 6-persons, 2,276 7-or-more-persons.
Size of nonfamily households: 86,216 1-person, 18,871 2-persons, 2,589 3-persons, 2,090 4-persons, 219 5-persons, 298 6-persons.
51,478 married couples with children.
36,516 single-parent households (10,970 men, 25,546 women).
69.2% of residents of Tucson speak English at home.
26.1% of residents speak Spanish at home (73% speak English very well, 13% speak English well, 9% speak English not well, 6% don't speak English at all).
1.4% of residents speak other Indo-European language at home (77% speak English very well, 11% speak English well, 10% speak English not well, 1% don't speak English at all).
2.3% of residents speak Asian or Pacific Island language at home (67% speak English very well, 18% speak English well, 12% speak English not well, 3% don't speak English at all).
1.0% of residents speak other language at home (59% speak English very well, 24% speak English well, 16% speak English not well, 1% don't speak English at all).
Foreign born population: 74,996 (13.7%)
(49.0% of them are naturalized citizens)
| Here: | 5.7 |
| State: | 6.0 |
| Here: | 3.8 |
| State: | 4.1 |
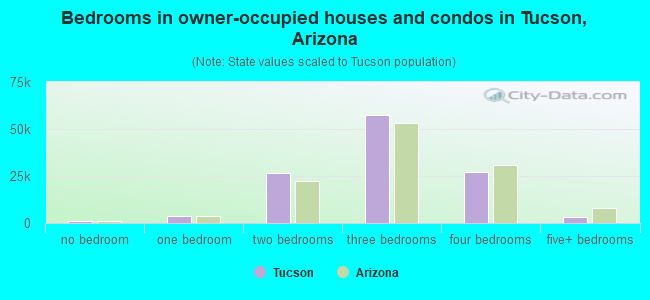
- Bedrooms in owner-occupied houses and condos in Tucson, Arizona
- 811no bedroom
- 3,7281 bedroom
- 26,4442 bedrooms
- 57,6883 bedrooms
- 26,9384 bedrooms
- 3,4455+ bedrooms
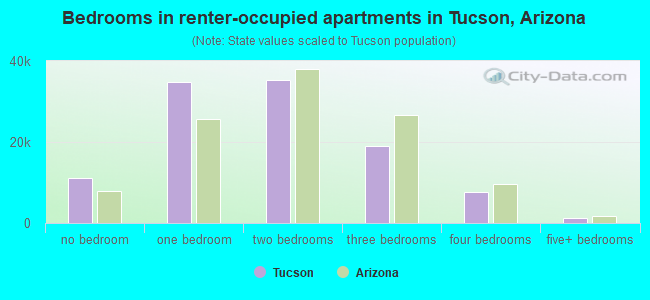
- Bedrooms in renter-occupied apartments in Tucson, Arizona
- 11,034no bedroom
- 34,7901 bedroom
- 35,2092 bedrooms
- 19,1133 bedrooms
- 7,7614 bedrooms
- 1,3075+ bedrooms
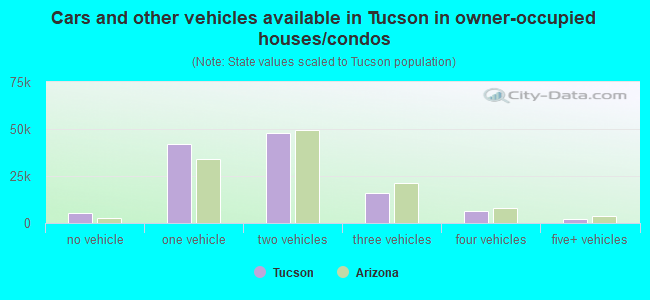
- Cars and other vehicles available in Tucson in owner-occupied houses/condos
- 5,469no vehicle
- 41,8251 vehicle
- 47,6422 vehicles
- 15,7693 vehicles
- 6,1514 vehicles
- 2,1985+ vehicles
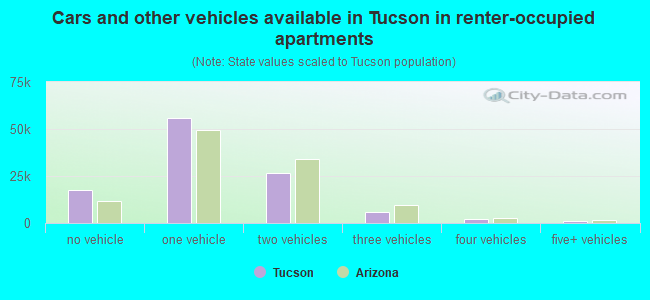
- Cars and other vehicles available in Tucson in renter-occupied apartments
- 17,588no vehicle
- 55,6641 vehicle
- 26,5362 vehicles
- 5,8433 vehicles
- 2,3924 vehicles
- 1,1915+ vehicles
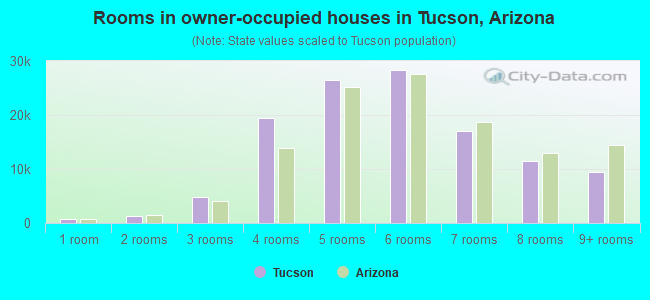
- Rooms in owner-occupied houses in Tucson, Arizona
- 7261 room
- 1,2152 rooms
- 4,7823 rooms
- 19,3704 rooms
- 26,5445 rooms
- 28,3146 rooms
- 17,0527 rooms
- 11,5338 rooms
- 9,5189+ rooms
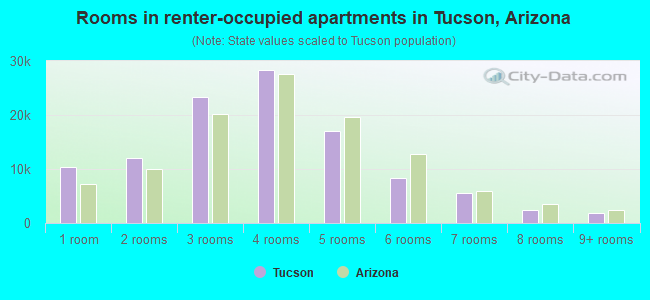
- Rooms in renter-occupied apartments in Tucson, Arizona
- 10,3061 room
- 12,0172 rooms
- 23,3123 rooms
- 28,3454 rooms
- 17,0575 rooms
- 8,2716 rooms
- 5,5907 rooms
- 2,3818 rooms
- 1,9359+ rooms
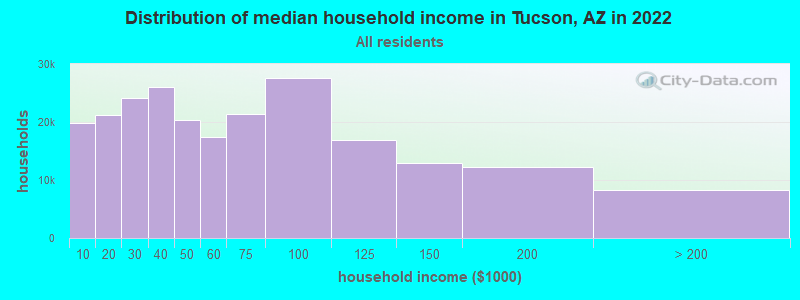
Tucson, AZ household income distribution

- 19,748Less than $10,000
- 21,138$10,000 to $19,999
- 24,156$20,000 to $29,999
- 25,956$30,000 to $39,999
- 20,409$40,000 to $49,999
- 17,388$50,000 to $59,999
- 21,451$60,000 to $74,999
- 27,638$75,000 to $99,999
- 16,831$100,000 to $124,999
- 12,985$125,000 to $149,999
- 12,247$150,000 to $199,999
- 8,321$200,000 or more
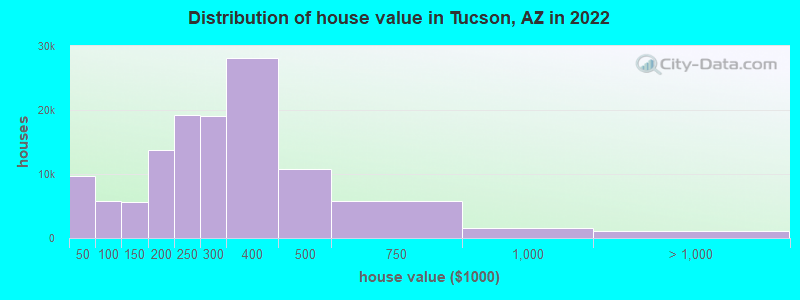
Home value of owner - occupied houses in 2022 in Tucson, AZ
-
- 2,103Less than $10,000
- 958$10,000 to $14,999
- 1,263$15,000 to $19,999
- 983$20,000 to $24,999
- 1,157$25,000 to $29,999
- 1,367$30,000 to $34,999
- 464$35,000 to $39,999
- 1,350$40,000 to $49,999
- 321$50,000 to $59,999
- 1,264$60,000 to $69,999
- 802$70,000 to $79,999
- 920$80,000 to $89,999
- 1,129$90,000 to $99,999
- 3,908$100,000 to $124,999
- 1,700$125,000 to $149,999
- 7,125$150,000 to $174,999
- 6,659$175,000 to $199,999
- 19,182$200,000 to $249,999
- 19,132$250,000 to $299,999
- 28,065$300,000 to $399,999
- 10,796$400,000 to $499,999
- 5,770$500,000 to $749,999
- 1,503$750,000 to $999,999
- 502$1,000,000 to $1,499,999
- 45$1,500,000 to $1,999,999
- 586$2,000,000 or more
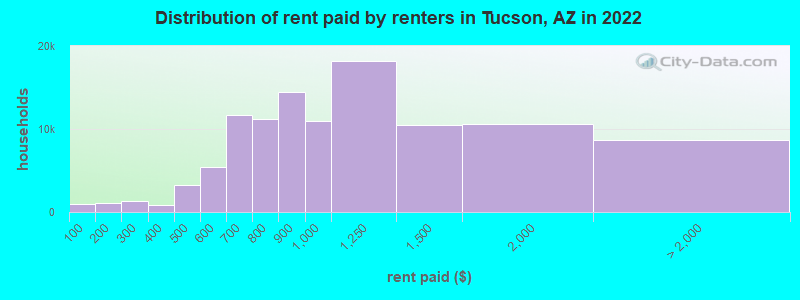
Rent paid by renters in 2022 in Tucson, AZ
-
- 909Less than $100
- 202$100 to $149
- 933$150 to $199
- 932$200 to $249
- 434$250 to $299
- 550$300 to $349
- 319$350 to $399
- 869$400 to $449
- 2,413$450 to $499
- 2,413$500 to $549
- 2,968$550 to $599
- 6,445$600 to $649
- 5,232$650 to $699
- 4,622$700 to $749
- 6,530$750 to $799
- 14,510$800 to $899
- 10,953$900 to $999
- 18,244$1,000 to $1,249
- 10,499$1,250 to $1,499
- 10,547$1,500 to $1,999
- 1,487$2,000 to $2,499
- 314$2,500 to $2,999
- 268$3,000 to $3,499
- 533$3,500 or more
- 6,088No cash rent

Percentage of workers working in this county: 97.9%
Number of people working at home: 34,383 (13.4% of all workers)

Travel time to work (commute)
- Less than 5 minutes: 6,781
- 5 to 9 minutes: 21,381
- 10 to 14 minutes: 31,612
- 15 to 19 minutes: 41,341
- 20 to 24 minutes: 44,599
- 25 to 29 minutes: 19,767
- 30 to 34 minutes: 31,989
- 35 to 39 minutes: 6,466
- 40 to 44 minutes: 2,991
- 45 to 59 minutes: 8,159
- 60 to 89 minutes: 5,033
- 90 or more minutes: 2,691

Means of transportation to work:
- Drove a car alone: 229,902 (72.9%)
- Carpooled: 31,389 (10.0%)
- Bus: 4,675 (1.5%)
- Subway or elevated rail: 52 (0.0%)
- Taxi: 4,028 (1.3%)
- Bicycle: 3,397 (1.1%)
- Walked: 7,625 (2.4%)
- Worked at home: 34,383 (10.9%)
- Unemployment by race in 2022
- Unemployment rate for White non-Hispanic residents
- 3.7%Males
- 3.9%Females
- Unemployment rate for Black residents
- 12.6%Males
- 17.1%Females
- Unemployment rate for American Indian and Alaska Native residents
- 4.5%Males
- 18.0%Females
- Unemployment rate for Asian residents
- 2.6%Males
- 3.6%Females
- Unemployment rate for other race residents
- 6.6%Males
- 7.6%Females
- Unemployment rate for two or more race residents
- 5.8%Males
- 5.3%Females
- Unemployment rate for Hispanic or Latino residents
- 6.4%Males
- 5.8%Females
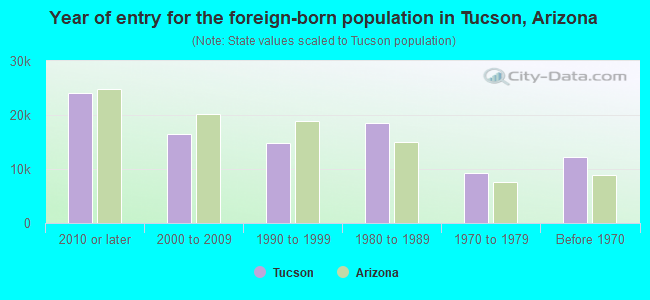
- Year of entry for the foreign-born population in Tucson, Arizona
- 24,0112010 or later
- 16,5362000 to 2009
- 14,8241990 to 1999
- 18,6101980 to 1989
- 9,2991970 to 1979
- 12,143Before 1970
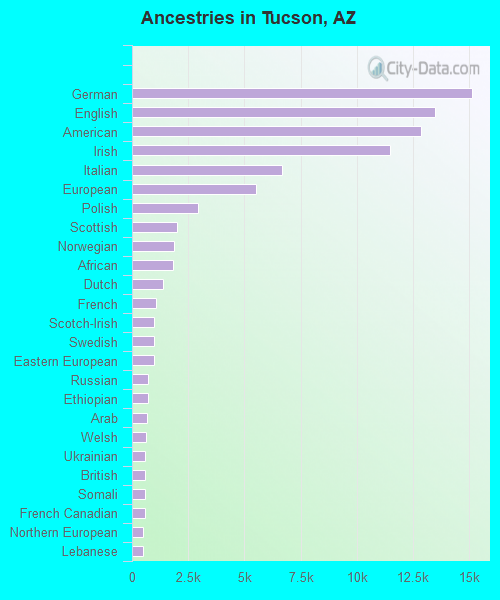
First ancestries reported:
- German: 15,129 (5.1%)
- English: 13,489 (4.6%)
- American: 12,872 (4.4%)
- Irish: 11,482 (3.9%)
- Italian: 6,680 (2.3%)
- European: 5,532 (1.9%)
- Polish: 2,929 (1.0%)
- Scottish: 1,983 (0.7%)
- Norwegian: 1,883 (0.6%)
- African: 1,832 (0.6%)
- Dutch: 1,362 (0.5%)
- French: 1,072 (0.4%)
- Scotch-Irish: 981 (0.3%)
- Swedish: 978 (0.3%)
- Eastern European: 966 (0.3%)
- Russian: 729 (0.2%)
- Ethiopian: 700 (0.2%)
- Arab: 651 (0.2%)
- Welsh: 604 (0.2%)
- Ukrainian: 596 (0.2%)
- British: 584 (0.2%)
- Somali: 568 (0.2%)
- French Canadian: 564 (0.2%)
- Northern European: 510 (0.2%)
- Lebanese: 508 (0.2%)
- Scandinavian: 505 (0.2%)
- Danish: 456 (0.2%)
- Kenyan: 417 (0.1%)
- Croatian: 403 (0.1%)
- Syrian: 400 (0.1%)
- Iraqi: 378 (0.1%)
- Iranian: 354 (0.1%)
- Czech: 336 (0.1%)
- Afghan: 322 (0.1%)
- Jamaican: 315 (0.1%)
- Egyptian: 313 (0.1%)
- Greek: 293 (0.10%)
- Nigerian: 281 (0.10%)
- Portuguese: 281 (0.10%)
- Hungarian: 267 (0.09%)
- Brazilian: 251 (0.08%)
- Finnish: 248 (0.08%)
- Yugoslavian: 227 (0.08%)
- Swiss: 218 (0.07%)
- Romanian: 206 (0.07%)
- Lithuanian: 204 (0.07%)
- Austrian: 189 (0.06%)
- Sudanese: 186 (0.06%)
- Slavic: 166 (0.06%)
- Canadian: 158 (0.05%)
- Armenian: 139 (0.05%)
- Australian: 136 (0.05%)
- Slovak: 131 (0.04%)
- Czechoslovakian: 126 (0.04%)
- Liberian: 122 (0.04%)
- Haitian: 109 (0.04%)
- Assyrian: 96 (0.03%)
- Icelander: 87 (0.03%)
- Zimbabwean: 86 (0.03%)
- Belgian: 73 (0.02%)
- Cajun: 71 (0.02%)
- Turkish: 68 (0.02%)
- West Indian: 67 (0.02%)
- Pennsylvania German: 65 (0.02%)
- Celtic: 61 (0.02%)
- Jordanian: 57 (0.02%)
- Palestinian: 56 (0.02%)
- Slovene: 38 (0.01%)
- Serbian: 33 (0.01%)
- Moroccan: 33 (0.01%)
- Latvian: 28 (0.01%)
- Barbadian: 28 (0.01%)
- Trinidadian and Tobagonian: 28 (0.01%)
- Basque: 24 (0.01%)
- Ugandan: 18 (0.01%)
- German Russian: 17 (0.01%)
- Bulgarian: 17 (0.01%)
- U.S. Virgin Islander: 17 (0.01%)
Most common places of birth for foreign-born residents (%):
| Tucson: | 60.5% (47,746) |
| Arizona: | 53.4% (500,086) |
| Tucson: | 2.8% (2,182) |
| Arizona: | 3.2% (30,378) |
| Tucson: | 2.7% (2,168) |
| Arizona: | 2.3% (21,275) |
| Tucson: | 2.0% (1,558) |
| Arizona: | 4.5% (41,719) |
| Tucson: | 2.0% (1,540) |
| Arizona: | 2.1% (19,199) |
Place of birth for U.S.-born residents:
- This state: 252,797
- Other state: 208,762
- Northeast: 33,194
- Midwest: 63,938
- South: 41,658
- West: 69,972
80.4% of Tucson residents lived in the same house 1 years ago.
Out of people who lived in different houses, 38.1% lived in this county.
Out of people who lived in different counties, 33.6% lived in Arizona.
| Tucson: | 80.4% |
| State average: | 86.0% |
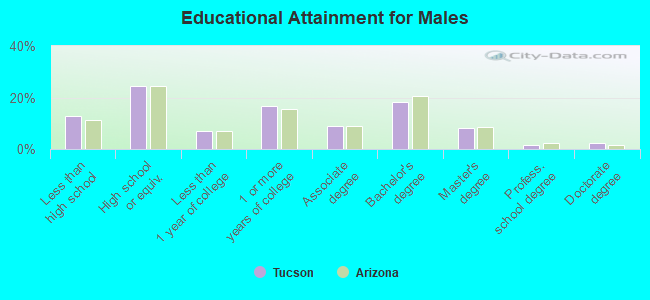
Education attainment for males 25 years and older:
- No schooling: 2,953
- Nursery to 4th grade: 387
- 5th and 6th grade: 1,727
- 7th and 8th grade: 3,114
- 9th grade: 2,552
- 10th grade: 2,614
- 11th grade: 4,268
- 12th grade, no diploma: 4,371
- High school graduate (or equivalency): 41,998
- Less than 1 year of college: 12,330
- Some college more than 1 year, no degree: 28,577
- Associate degree: 15,693
- Bachelor's degree: 31,417
- Master's degree: 14,261
- Professional school degree: 2,741
- Doctorate degree: 3,898
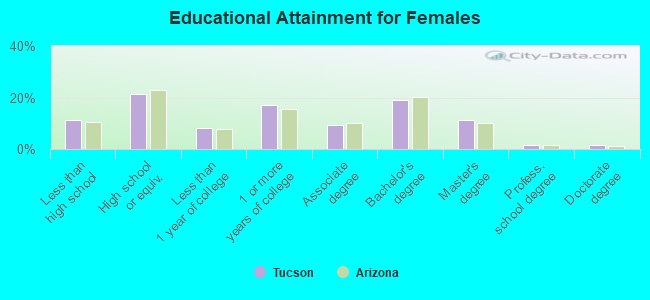
Education attainment for females 25 years and older:
- No schooling: 4,062
- Nursery to 4th grade: 1,253
- 5th and 6th grade: 1,857
- 7th and 8th grade: 2,896
- 9th grade: 2,184
- 10th grade: 1,627
- 11th grade: 2,281
- 12th grade, no diploma: 3,761
- High school graduate (or equivalency): 37,816
- Less than 1 year of college: 14,490
- Some college more than 1 year, no degree: 30,082
- Associate degree: 16,415
- Bachelor's degree: 33,663
- Master's degree: 19,649
- Professional school degree: 2,801
- Doctorate degree: 2,608
Housing units in structures:
- One, detached: 130,320
- One, attached: 21,696
- Two: 7,551
- 3 or 4: 10,666
- 5 to 9: 13,613
- 10 to 19: 15,766
- 20 to 49: 14,222
- 50 or more: 21,361
- Mobile homes: 13,842
- Boats, RVs, vans, etc.: 751
Median worth of mobile homes: $35,000
Housing units lacking complete kitchen facilities in 2022: 1.4%
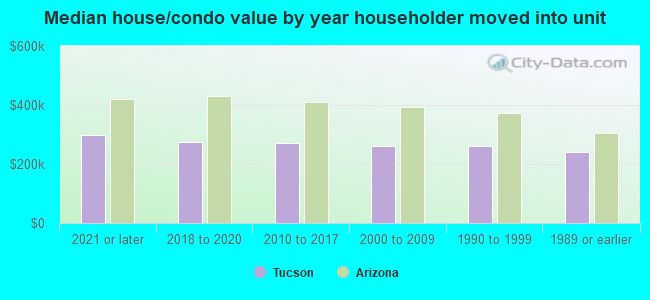
House/condo owner moved in on average 10 years ago
Renter moved in on average 2 years ago
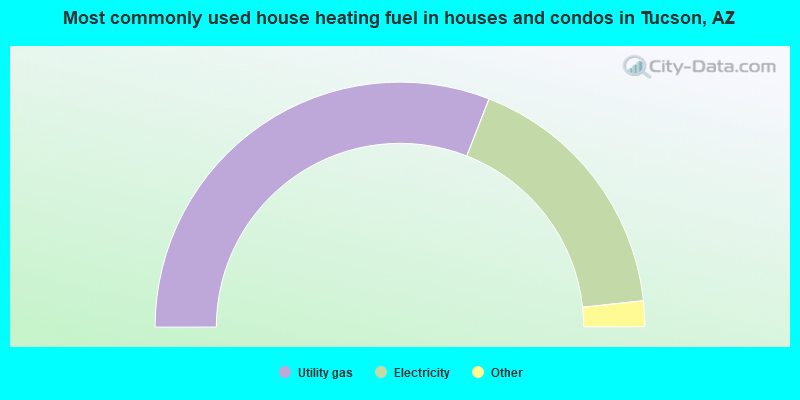
- 61.8%Utility gas
- 34.7%Electricity
- 1.4%Bottled, tank, or LP gas
- 1.2%Solar energy
- 0.5%No fuel used
- 0.2%Fuel oil, kerosene, etc.
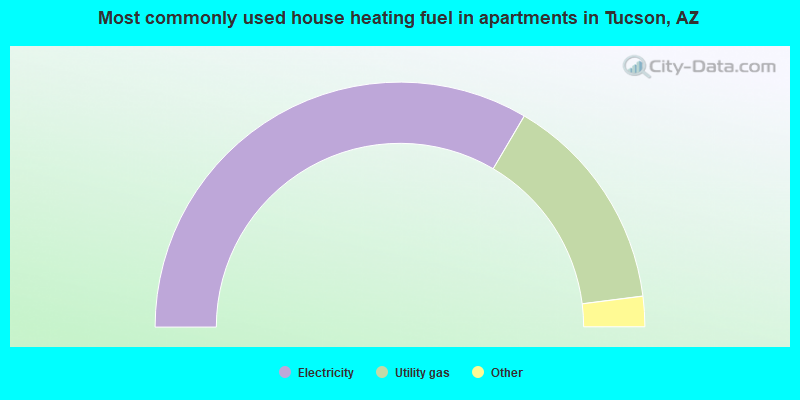
- 66.9%Electricity
- 29.0%Utility gas
- 2.3%Bottled, tank, or LP gas
- 1.5%No fuel used
- 0.2%Solar energy
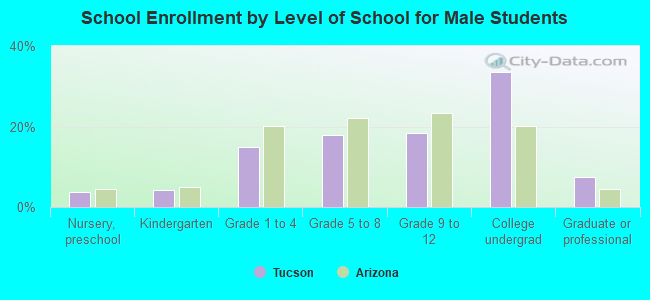
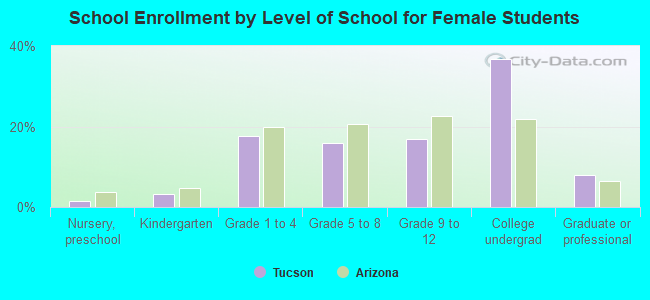
Private vs. public school enrollment:
| Here: | 9.7% |
| Arizona: | 10.4% |
| Here: | 8.3% |
| Arizona: | 8.8% |
| Here: | 5.6% |
| Arizona: | 13.1% |