Trumbull, CT (Connecticut) Houses and Residents
| Trumbull: | $562,525 |
| Connecticut: | $347,200 |
Mean price in 2022:
Detached houses: $517,801
Here: $517,801 State: $503,946 Townhouses or other attached units: $392,092
Here: $392,092 State: $304,959 In 2-unit structures: $309,991
Here: $309,991 State: $304,133 In 3-to-4-unit structures: $381,523
Here: $381,523 State: $272,970 In 5-or-more-unit structures: $387,311
Here: $387,311 State: $249,308
Total population: 36,018 (Urban population: 34,243, Rural population: 0)
Houses: 12,849 (12,400 occupied: 10,845 owner occupied, 1,705 renter occupied)
| % of renters here: | 14% |
| State: | 34% |
Housing density: 552 houses/condos per square mile
Median price asked for vacant for-sale houses and condos in 2022: $576,576.
Median contract rent in 2022: over $2,000 (lower quartile is $934, upper quartile is over $2,000)
Median rent asked for vacant for-rent units in 2022: $3,226
Median gross rent in Trumbull, CT in 2022: over $2,000
Housing units in Trumbull with a mortgage: 6,758 (133 second mortgage, 1,031 home equity loan, 82 both second mortgage and home equity loan)
Houses without a mortgage: 3,662
Median household income for houses/condos with a mortgage: $168,139
Median household income for apartments without a mortgage: $123,169
Median monthly housing costs: $2,543
Compare current foreclosures near Trumbull, CT:
| Photo | Address | Area | Beds / Baths | Price | Details |
|---|---|---|---|---|---|

|
#1
Horseshoe Dr
Trumbull, CT 06611
|
2,546 sq. feet
|
2 baths 4 beds |
show details | |

|
#2
Rocky Hill Rd
Trumbull, CT 06611
|
1,491 sq. feet
|
2 baths 3 beds |
show details | |

|
#3
Tudor Ln
Trumbull, CT 06611
|
3,082 sq. feet
|
2 baths 4 beds |
show details | |

|
#4
Nichols Ave
Trumbull, CT 06611
|
2,016 sq. feet
|
1 baths 3 beds |
show details | |

|
#5
Lull Water Rd
Trumbull, CT 06611
|
1,914 sq. feet
|
2 baths 4 beds |
show details | |

|
#6
Franklin St
Trumbull, CT 06611
|
837 sq. feet
|
1 baths 2 beds |
show details | |

|
#7
Beardsley Pkwy
Trumbull, CT 06611
|
1,894 sq. feet
|
2 baths 3 beds |
show details | |

|
#8
Daniels Farm Rd
Trumbull, CT 06611
|
2,580 sq. feet
|
3 baths 4 beds |
show details | |

|
#9
Columbine Dr
Trumbull, CT 06611
|
1,208 sq. feet
|
1 baths 3 beds |
show details | |

|
#10
Foxwood Rd
Trumbull, CT 06611
|
2,965 sq. feet
|
2 baths 4 beds |
show details |
| Photo | Address | Area | Beds / Baths | Price | Details |
|---|---|---|---|---|---|

|
#11
Main St
Trumbull, CT 06611
|
- sq. feet
|
- baths - beds |
show details | |

|
#12
Davis Dr
Milford, CT 06460
|
1,165 sq. feet
|
1 baths 4 beds |
$454,900
|
show details |

|
#13
Lynne Pl
Bridgeport, CT 06610
|
1,152 sq. feet
|
2 baths 3 beds |
$389,900
|
show details |

|
#14
Santangelo Terrace #30
Derby, CT 06418
|
652 sq. feet
|
1 baths 1 beds |
$189,000
|
show details |

|
#15
Abbott Ave
Danbury, CT 06810
|
1,401 sq. feet
|
1 baths 3 beds |
$499,900
|
show details |

|
#16
Amity Rd
Woodbridge, CT 06525
|
1,850 sq. feet
|
1 baths 3 beds |
$549,900
|
show details |

|
#17
Winchester Ave
Hamden, CT 06517
|
1,820 sq. feet
|
2 baths 5 beds |
$489,900
|
show details |

|
#18
Seymour Rd
New Haven, CT 06525
|
1,639 sq. feet
|
2 baths 3 beds |
$312,000
|
show details |

|
#19
Ellsworth St
West Haven, CT 06516
|
960 sq. feet
|
1 baths 3 beds |
$365,000
|
show details |

|
#20
Olcott Way # 122
Ridgefield, CT 06877
|
920 sq. feet
|
1 baths 1 beds |
$364,900
|
show details |
| Photo | Address | Area | Beds / Baths | Price | Details |
|---|---|---|---|---|---|

|
#21
Beecher Pl
East Haven, CT 06512
|
1,454 sq. feet
|
1 baths 3 beds |
$445,000
|
show details |

|
#22
Sentinel Hill Rd
Derby, CT 06418
|
1,740 sq. feet
|
1 baths 2 beds |
$322,400
|
show details |

|
#23
Beecher Ave
Shelton, CT 06484
|
1,911 sq. feet
|
2 baths 4 beds |
$589,900
|
show details |

|
#24
Alfred Ct
Stratford, CT 06615
|
1,406 sq. feet
|
2 baths 3 beds |
$449,900
|
show details |

|
#25
Fairview Ave # U-2
Hamden, CT 06514
|
1,284 sq. feet
|
1 baths 3 beds |
$174,000
|
show details |

|
#26
N Star Dr
Seymour, CT 06483
|
1,670 sq. feet
|
2 baths 3 beds |
$424,900
|
show details |

|
#27
Kennedy Dr
Bridgeport, CT 06606
|
1,063 sq. feet
|
1 baths 2 beds |
$224,900
|
show details |

|
#28
Sasco Hill Rd
Fairfield, CT 06824
|
- sq. feet
|
5 baths 5 beds |
$6,700,000
|
show details |

|
#29
82 Herkimer St
Bridgeport, CT 06604
|
- sq. feet
|
3 baths 5 beds |
show details | |

|
#30
Los Angeles Ave
Stratford, CT 06614
|
1,238 sq. feet
|
2 baths 3 beds |
show details |
| Photo | Address | Area | Beds / Baths | Price | Details |
|---|---|---|---|---|---|

|
#31
Dover St
Bridgeport, CT 06610
|
982 sq. feet
|
1 baths 2 beds |
show details | |

|
#32
George St
Hamden, CT 06514
|
2,125 sq. feet
|
3 baths 5 beds |
show details | |

|
#33
Bowen St
Hamden, CT 06514
|
1,190 sq. feet
|
1 baths 2 beds |
show details | |

|
#34
Rocton Ave
Bridgeport, CT 06606
|
1,546 sq. feet
|
1 baths 3 beds |
show details | |

|
#35
High View Dr
Stratford, CT 06614
|
2,574 sq. feet
|
2 baths 4 beds |
show details | |

|
#36
Daniel Ct
Westport, CT 06880
|
4,566 sq. feet
|
4 baths 4 beds |
show details | |

|
#37
Szost Dr
Fairfield, CT 06824
|
3,127 sq. feet
|
6 baths 5 beds |
show details | |

|
#38
Wooster St
Bethel, CT 06801
|
2,573 sq. feet
|
3 baths 5 beds |
show details | |

|
#39
Whiting St
Hamden, CT 06514
|
1,508 sq. feet
|
2 baths 4 beds |
show details | |

|
#40
Forest Hills Rd
West Haven, CT 06516
|
1,638 sq. feet
|
1 baths 3 beds |
show details |
| Photo | Address | Area | Beds / Baths | Price | Details |
|---|---|---|---|---|---|

|
#41
Green Hill Rd
Bethany, CT 06524
|
1,920 sq. feet
|
2 baths 3 beds |
show details | |

|
#42
Boylston St
West Haven, CT 06516
|
1,420 sq. feet
|
3 baths 2 beds |
show details | |

|
#43
Reitter St
Stratford, CT 06614
|
1,310 sq. feet
|
1 baths 3 beds |
show details | |

|
#44
Hospital Ave
Danbury, CT 06810
|
1,589 sq. feet
|
2 baths 3 beds |
show details | |

|
#45
Henry Ave
Stratford, CT 06614
|
1,547 sq. feet
|
1 baths 3 beds |
show details | |

|
#46
Hawthorne Ave
Derby, CT 06418
|
5,129 sq. feet
|
5 baths 7 beds |
show details | |

|
#47
Park Ave Unit 22
Bridgeport, CT 06604
|
2,296 sq. feet
|
2 baths 2 beds |
show details | |

|
#48
Rennell St
Bridgeport, CT 06604
|
1,419 sq. feet
|
1 baths 3 beds |
show details | |

|
#49
Governors Hill Rd
Oxford, CT 06478
|
2,106 sq. feet
|
2 baths 3 beds |
show details | |

|
Check over 1 million property listings on Foreclosure.com!
|
browse all offers | |||

Latest news about housing in Trumbull, CT collected exclusively by city-data.com from local newspapers, TV, and radio stations


Median year apartment built: 1991
Household type by relationship:
Households: 36,317- Male householders: 6,261 (776 living alone), Female householders: 6,043 (1,465 living alone)
8,421 spouses (8,399 opposite-sex spouses), 332 unmarried partners, (311 opposite-sex unmarried partners), 12,474 children (11,886 natural, 362 adopted, 225 stepchildren), 658 grandchildren, 290 brothers or sisters, 686 parents, 63 foster children, 478 other relatives, 344 non-relatives
- In group quarters: 262
Size of family households: 3,787 2-persons, 2,191 3-persons, 2,507 4-persons, 1,129 5-persons, 294 6-persons, 55 7-or-more-persons.
Size of nonfamily households: 2,377 1-person, 243 2-persons, 21 3-persons, 12 5-persons.
6,999 married couples with children.
1,031 single-parent households (604 men, 427 women).
80.4% of residents of Trumbull speak English at home.
4.3% of residents speak Spanish at home (76% speak English very well, 16% speak English well, 7% speak English not well, 1% don't speak English at all).
10.8% of residents speak other Indo-European language at home (75% speak English very well, 18% speak English well, 6% speak English not well, 1% don't speak English at all).
3.6% of residents speak Asian or Pacific Island language at home (64% speak English very well, 29% speak English well, 5% speak English not well, 3% don't speak English at all).
1.1% of residents speak other language at home (71% speak English very well, 20% speak English well, 9% speak English not well).
Foreign born population: 5,536 (15.2%)
(74.1% of them are naturalized citizens)
| Here: | 7.3 |
| State: | 6.5 |
| Here: | 4.3 |
| State: | 4.0 |

- Bedrooms in owner-occupied houses and condos in Trumbull, Connecticut
- 0no bedroom
- 561 bedroom
- 1,1002 bedrooms
- 5,0983 bedrooms
- 4,0224 bedrooms
- 5715+ bedrooms

- Bedrooms in renter-occupied apartments in Trumbull, Connecticut
- 72no bedroom
- 5331 bedroom
- 5242 bedrooms
- 3453 bedrooms
- 1734 bedrooms
- 585+ bedrooms

- Cars and other vehicles available in Trumbull in owner-occupied houses/condos
- 167no vehicle
- 1,5601 vehicle
- 5,5022 vehicles
- 2,3933 vehicles
- 9884 vehicles
- 2365+ vehicles

- Cars and other vehicles available in Trumbull in renter-occupied apartments
- 361no vehicle
- 5551 vehicle
- 5522 vehicles
- 1613 vehicles
- 664 vehicles
- 105+ vehicles

- Rooms in owner-occupied houses in Trumbull, Connecticut
- 01 room
- 02 rooms
- 213 rooms
- 3714 rooms
- 1,1715 rooms
- 2,0256 rooms
- 2,3357 rooms
- 2,4848 rooms
- 2,4399+ rooms

- Rooms in renter-occupied apartments in Trumbull, Connecticut
- 641 room
- 2902 rooms
- 1973 rooms
- 3964 rooms
- 1945 rooms
- 1406 rooms
- 1997 rooms
- 1738 rooms
- 539+ rooms


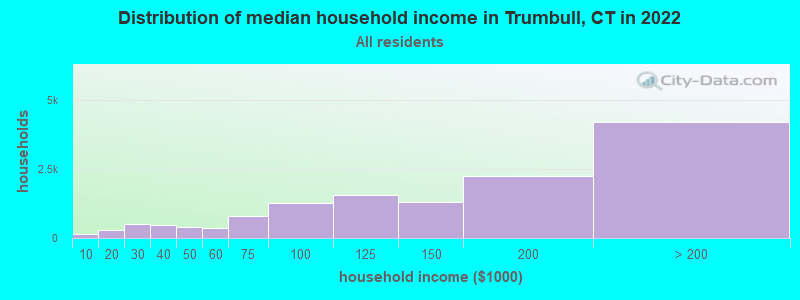
Trumbull, CT household income distribution

- 151Less than $10,000
- 307$10,000 to $19,999
- 498$20,000 to $29,999
- 470$30,000 to $39,999
- 415$40,000 to $49,999
- 362$50,000 to $59,999
- 785$60,000 to $74,999
- 1,287$75,000 to $99,999
- 1,548$100,000 to $124,999
- 1,297$125,000 to $149,999
- 2,234$150,000 to $199,999
- 4,213$200,000 or more
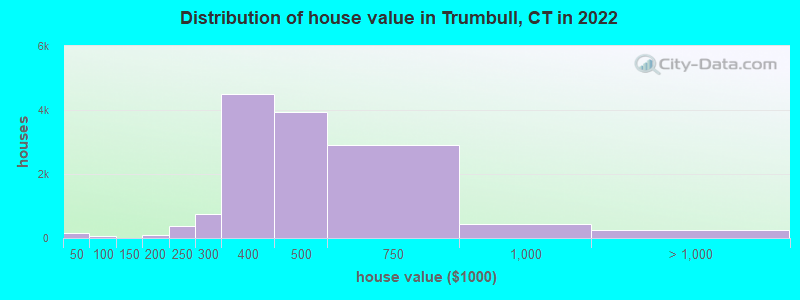
Home value of owner - occupied houses in 2022 in Trumbull, CT
-
- 54$20,000 to $24,999
- 29$30,000 to $34,999
- 57$40,000 to $49,999
- 4$80,000 to $89,999
- 5$100,000 to $124,999
- 4$125,000 to $149,999
- 49$150,000 to $174,999
- 54$175,000 to $199,999
- 382$200,000 to $249,999
- 751$250,000 to $299,999
- 4,510$300,000 to $399,999
- 3,949$400,000 to $499,999
- 2,917$500,000 to $749,999
- 423$750,000 to $999,999
- 125$1,000,000 to $1,499,999
- 26$1,500,000 to $1,999,999
- 111$2,000,000 or more
Rent paid by renters in 2022 in Trumbull, CT
-
- 8$150 to $199
- 24$200 to $249
- 24$250 to $299
- 39$300 to $349
- 28$350 to $399
- 6$400 to $449
- 14$450 to $499
- 15$500 to $549
- 8$550 to $599
- 15$800 to $899
- 21$900 to $999
- 190$1,000 to $1,249
- 254$1,250 to $1,499
- 397$1,500 to $1,999
- 930$2,000 to $2,499
- 171$2,500 to $2,999
- 13$3,000 to $3,499
- 94$3,500 or more
- 166No cash rent

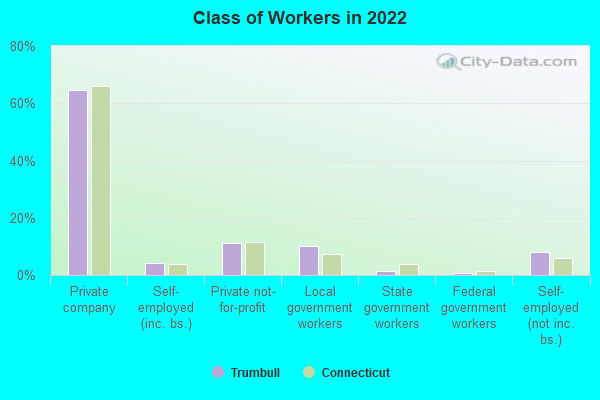
Percentage of workers working in this county: 76.7%
Number of people working at home: 2,809 (16.4% of all workers)
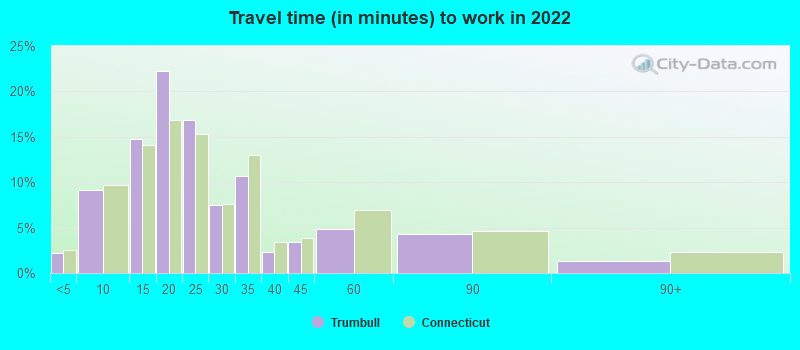
Travel time to work (commute)
- Less than 5 minutes: 143
- 5 to 9 minutes: 1,089
- 10 to 14 minutes: 2,029
- 15 to 19 minutes: 2,506
- 20 to 24 minutes: 1,703
- 25 to 29 minutes: 920
- 30 to 34 minutes: 1,380
- 35 to 39 minutes: 442
- 40 to 44 minutes: 547
- 45 to 59 minutes: 1,484
- 60 to 89 minutes: 1,404
- 90 or more minutes: 1,004
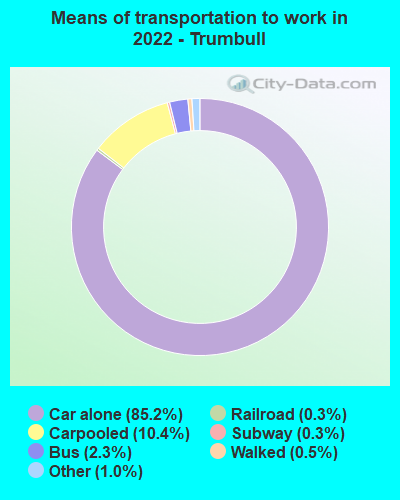
Means of transportation to work:
- Drove a car alone: 11,433 (72.7%)
- Carpooled: 1,361 (8.7%)
- Bus: 218 (1.4%)
- Long-distance train or commuter rail: 30 (0.2%)
- Light rail, streetcar or trolley: 91 (0.6%)
- Taxi: 173 (1.1%)
- Bicycle: 1 (0.0%)
- Walked: 82 (0.5%)
- Worked at home: 2,880 (18.3%)
- Unemployment by race in 2022
- Unemployment rate for White non-Hispanic residents
- 5.7%Males
- 4.8%Females
- Unemployment rate for Black residents
- 6.7%Males
- 3.2%Females
- Unemployment rate for Asian residents
- 5.9%Males
- 6.5%Females
- Unemployment rate for other race residents
- 2.2%Males
- Unemployment rate for two or more race residents
- 25.9%Males
- Unemployment rate for Hispanic or Latino residents
- 12.7%Males

- Year of entry for the foreign-born population in Trumbull, Connecticut
- 1,0822010 or later
- 1,5692000 to 2009
- 1,1341990 to 1999
- 6301980 to 1989
- 5601970 to 1979
- 1,391Before 1970

First ancestries reported:
- Italian: 3,772 (22.2%)
- Irish: 1,427 (8.4%)
- Polish: 676 (4.0%)
- American: 675 (4.0%)
- English: 626 (3.7%)
- Portuguese: 531 (3.1%)
- Brazilian: 506 (3.0%)
- German: 427 (2.5%)
- Greek: 308 (1.8%)
- Slovak: 286 (1.7%)
- European: 254 (1.5%)
- Hungarian: 245 (1.4%)
- Eastern European: 218 (1.3%)
- Syrian: 210 (1.2%)
- Ukrainian: 154 (0.9%)
- Albanian: 136 (0.8%)
- Russian: 135 (0.8%)
- Jamaican: 128 (0.8%)
- African: 112 (0.7%)
- Romanian: 104 (0.6%)
- South African: 100 (0.6%)
- Scottish: 99 (0.6%)
- Swedish: 89 (0.5%)
- British: 77 (0.5%)
- Haitian: 75 (0.4%)
- French Canadian: 69 (0.4%)
- Egyptian: 68 (0.4%)
- Austrian: 67 (0.4%)
- Turkish: 67 (0.4%)
- Lithuanian: 55 (0.3%)
- Canadian: 54 (0.3%)
- Iranian: 48 (0.3%)
- French: 48 (0.3%)
- Carpatho Rusyn: 39 (0.2%)
- Czechoslovakian: 39 (0.2%)
- Scotch-Irish: 32 (0.2%)
- Macedonian: 26 (0.2%)
- Dutch: 25 (0.1%)
- Scandinavian: 24 (0.1%)
- Yugoslavian: 22 (0.1%)
- Norwegian: 18 (0.1%)
- Northern European: 17 (0.1%)
- Welsh: 15 (0.09%)
- Slovene: 15 (0.09%)
- Croatian: 14 (0.08%)
- Czech: 14 (0.08%)
- Trinidadian and Tobagonian: 14 (0.08%)
- Armenian: 13 (0.08%)
- Danish: 13 (0.08%)
- Israeli: 11 (0.06%)
- Cape Verdean: 10 (0.06%)
- West Indian: 4 (0.02%)
Most common places of birth for foreign-born residents (%):
| Trumbull: | 18.7% (972) |
| Connecticut: | 100.0% (-1) |
| Trumbull: | 11.4% (593) |
| Connecticut: | 100.0% (-1) |
| Trumbull: | 5.3% (278) |
| Connecticut: | 100.0% (-1) |
| Trumbull: | 4.6% (240) |
| Connecticut: | 100.0% (-1) |
| Trumbull: | 3.6% (189) |
| Connecticut: | 100.0% (-1) |
| Trumbull: | 3.4% (177) |
| Connecticut: | 100.0% (-1) |
| Trumbull: | 3.3% (172) |
| Connecticut: | 100.0% (-1) |
| Trumbull: | 3.1% (159) |
| Connecticut: | 100.0% (-1) |
| Trumbull: | 2.4% (125) |
| Connecticut: | 100.0% (-1) |
| Trumbull: | 2.4% (124) |
| Connecticut: | 100.0% (-1) |
| Trumbull: | 2.3% (120) |
| Connecticut: | 100.0% (-1) |
| Trumbull: | 2.0% (102) |
| Connecticut: | 100.0% (-1) |
| Trumbull: | 1.9% (100) |
| Connecticut: | 100.0% (-1) |
| Trumbull: | 1.9% (100) |
| Connecticut: | 100.0% (-1) |
| Trumbull: | 1.9% (99) |
| Connecticut: | 100.0% (-1) |
| Trumbull: | 1.8% (92) |
| Connecticut: | 100.0% (-1) |
| Trumbull: | 1.7% (87) |
| Connecticut: | 100.0% (-1) |
| Trumbull: | 1.6% (85) |
| Connecticut: | 100.0% (-1) |
| Trumbull: | 1.5% (80) |
| Connecticut: | 100.0% (-1) |
| Trumbull: | 1.5% (80) |
| Connecticut: | 100.0% (-1) |
Place of birth for U.S.-born residents:
- This state: 20,803
- Other state: 9,193
- Northeast: 6,848
- Midwest: 1,013
- South: 834
- West: 519
91.3% of Trumbull residents lived in the same house 1 years ago.
Out of people who lived in different houses, 36.4% lived in this county.
Out of people who lived in different counties, 33.3% lived in Connecticut.
| Trumbull: | 91.3% |
| State average: | 88.4% |
Education attainment for males 25 years and older:
- No schooling: 99
- Nursery to 4th grade: 20
- 5th and 6th grade: 54
- 7th and 8th grade: 64
- 9th grade: 11
- 10th grade: 94
- 11th grade: 71
- 12th grade, no diploma: 170
- High school graduate (or equivalency): 1,869
- Less than 1 year of college: 560
- Some college more than 1 year, no degree: 1,118
- Associate degree: 856
- Bachelor's degree: 3,825
- Master's degree: 2,303
- Professional school degree: 570
- Doctorate degree: 414

Education attainment for females 25 years and older:
- No schooling: 117
- Nursery to 4th grade: 11
- 5th and 6th grade: 30
- 7th and 8th grade: 20
- 9th grade: 27
- 10th grade: 103
- 11th grade: 67
- 12th grade, no diploma: 92
- High school graduate (or equivalency): 2,478
- Less than 1 year of college: 511
- Some college more than 1 year, no degree: 1,081
- Associate degree: 865
- Bachelor's degree: 4,411
- Master's degree: 2,655
- Professional school degree: 391
- Doctorate degree: 96


Housing units in structures:
- One, detached: 11,074
- One, attached: 488
- Two: 216
- 3 or 4: 177
- 5 to 9: 71
- 10 to 19: 21
- 20 to 49: 365
- 50 or more: 435
Median worth of mobile homes: $340,088
Housing units lacking complete kitchen facilities in 2022: 1.7%
House/condo owner moved in on average 16 years ago
Renter moved in on average 3 years ago

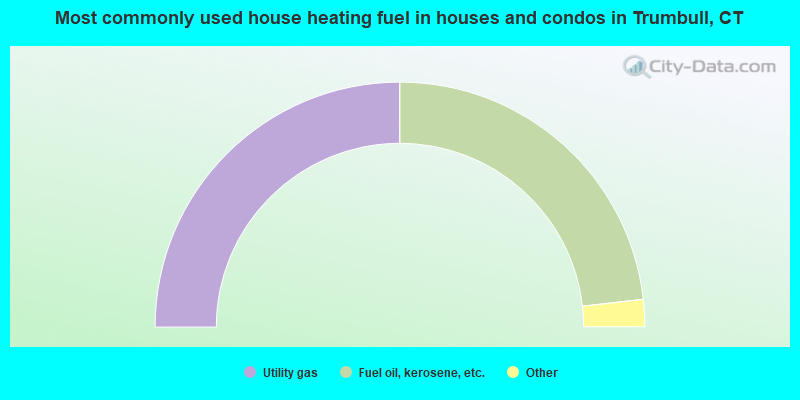
- 50.0%Utility gas
- 46.4%Fuel oil, kerosene, etc.
- 1.6%Bottled, tank, or LP gas
- 0.8%Electricity
- 0.7%Wood
- 0.3%Other fuel
- 0.1%Coal or coke
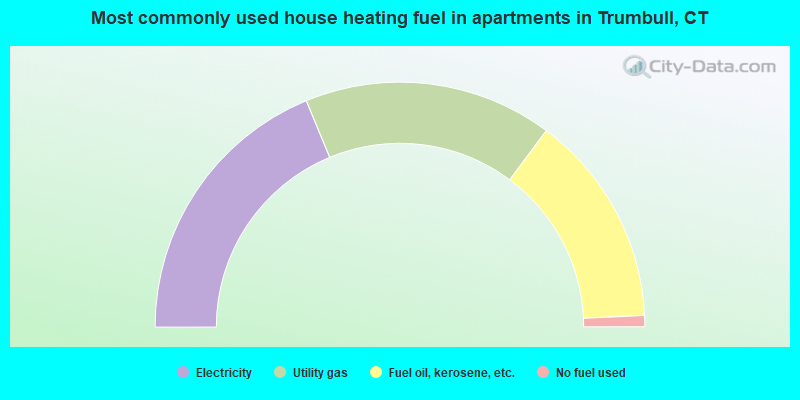
- 37.5%Electricity
- 32.9%Utility gas
- 28.1%Fuel oil, kerosene, etc.
- 1.5%No fuel used
Private vs. public school enrollment:
| Here: | 5.3% |
| Connecticut: | 9.5% |
| Here: | 12.2% |
| Connecticut: | 12.9% |
| Here: | 35.9% |
| Connecticut: | 35.5% |


