Trumbauersville, PA (Pennsylvania) Houses and Residents
| Trumbauersville: | $320,139 |
| Pennsylvania: | $245,500 |
Total population: 962 (All urban)
Houses: 447 (419 occupied: 313 owner occupied, 109 renter occupied)
| % of renters here: | 26% |
| State: | 31% |
Housing density: 1,045 houses/condos per square mile
Median price asked for vacant for-sale houses and condos in 2022 in this county: $426,803.
Median contract rent in 2022: $1,115 (lower quartile is $904, upper quartile is $1,285)
Median rent asked for vacant for-rent units in 2022: $1,468
Median gross rent in Trumbauersville, PA in 2022: $1,264
Housing units in Trumbauersville with a mortgage: 213 (53 second mortgage, 11 home equity loan, 29 both second mortgage and home equity loan)
Houses without a mortgage: 20
Median household income for houses/condos with a mortgage: $126,846
Median monthly housing costs: $1,487
Compare current foreclosures near Trumbauersville, PA:
| Photo | Address | Area | Beds / Baths | Price | Details |
|---|---|---|---|---|---|

|
#1
N Reading Ave
Boyertown, PA 19512
|
1,312 sq. feet
|
1 baths 3 beds |
show details | |

|
#2
Richlandtown Pike
Quakertown, PA 18951
|
2,513 sq. feet
|
3 baths 5 beds |
show details | |

|
#3
Big Rd
Gilbertsville, PA 19525
|
5,206 sq. feet
|
4 baths 4 beds |
show details | |

|
#4
Aubrey Dr
Quakertown, PA 18951
|
2,050 sq. feet
|
2 baths 3 beds |
show details | |

|
#5
Cherokee St
Bethlehem, PA 18015
|
1,742 sq. feet
|
1 baths 4 beds |
show details | |

|
#6
Benfield Rd
Macungie, PA 18062
|
1,400 sq. feet
|
1 baths 3 beds |
show details | |

|
#7
Montgomery Ave
New Berlinville, PA 19545
|
1,768 sq. feet
|
2 baths 3 beds |
show details | |

|
#8
Wrangler Ct
Quakertown, PA 18951
|
1,198 sq. feet
|
2 baths 2 beds |
show details | |

|
#9
N 26th St
Allentown, PA 18104
|
1,841 sq. feet
|
3 baths 3 beds |
show details | |

|
#10
Hilltop Rd
Pottstown, PA 19464
|
1,155 sq. feet
|
2 baths 2 beds |
show details |
| Photo | Address | Area | Beds / Baths | Price | Details |
|---|---|---|---|---|---|

|
#11
Whitewood Rd
Bethlehem, PA 18017
|
1,738 sq. feet
|
2 baths 4 beds |
show details | |

|
#12
Willow Brook Ln
Pottstown, PA 19464
|
1,566 sq. feet
|
2 baths 3 beds |
show details | |

|
#13
Hampshire Dr
Whitehall, PA 18052
|
1,249 sq. feet
|
1 baths 3 beds |
show details | |

|
#14
Horseshoe Dr
Quakertown, PA 18951
|
1,326 sq. feet
|
2 baths 3 beds |
show details | |

|
#15
Vera Cir
Bethlehem, PA 18017
|
1,452 sq. feet
|
1 baths 3 beds |
show details | |

|
#16
Depot Ln
Quakertown, PA 18951
|
1,144 sq. feet
|
1 baths 3 beds |
show details | |

|
#17
Richlandtown Pike
Quakertown, PA 18951
|
- sq. feet
|
3 baths 5 beds |
show details | |

|
#18
Blair Rd
Bethlehem, PA 18017
|
2,647 sq. feet
|
2 baths 4 beds |
show details | |

|
#19
Cedar Rd
Schwenksville, PA 19473
|
1,078 sq. feet
|
1 baths 2 beds |
show details | |

|
#20
Needham Cir
Hatfield, PA 19440
|
- sq. feet
|
1 baths 3 beds |
show details |
| Photo | Address | Area | Beds / Baths | Price | Details |
|---|---|---|---|---|---|

|
#21
Township Line Rd
North Wales, PA 19454
|
1,392 sq. feet
|
1 baths 2 beds |
show details | |

|
#22
S 4th St
Perkasie, PA 18944
|
1,530 sq. feet
|
1 baths 3 beds |
show details | |

|
#23
State St
Lansdale, PA 19446
|
1,260 sq. feet
|
1 baths 3 beds |
show details | |

|
#24
Nancy Ward Cir
Doylestown, PA 18902
|
1,080 sq. feet
|
1 baths 2 beds |
show details | |

|
#25
S Main St
Richlandtown, PA 18955
|
1,384 sq. feet
|
1 baths 3 beds |
show details | |

|
#26
W Broad St
Telford, PA 18969
|
1,248 sq. feet
|
1 baths 4 beds |
show details | |

|
#27
Green St
Perkasie, PA 18944
|
3,437 sq. feet
|
2 baths 4 beds |
show details | |

|
#28
Wagner Ave
Hellertown, PA 18055
|
1,091 sq. feet
|
1 baths 3 beds |
show details | |

|
#29
Main St
Bethlehem, PA 18018
|
1,248 sq. feet
|
1 baths 2 beds |
show details | |

|
#30
Abbe Ct
Bethlehem, PA 18017
|
1,360 sq. feet
|
2 baths 3 beds |
show details |
| Photo | Address | Area | Beds / Baths | Price | Details |
|---|---|---|---|---|---|

|
#31
Lafayette Ave
Bethlehem, PA 18017
|
864 sq. feet
|
1 baths 3 beds |
show details | |

|
#32
N Jordan St
Allentown, PA 18102
|
1,414 sq. feet
|
1 baths 5 beds |
show details | |

|
#33
Anthony Dr
Pottstown, PA 19464
|
2,760 sq. feet
|
1 baths 4 beds |
show details | |

|
#34
Schaeffer St
Boyertown, PA 19512
|
1,320 sq. feet
|
1 baths 3 beds |
show details | |

|
#35
Hillside Cir
Gilbertsville, PA 19525
|
2,362 sq. feet
|
2 baths 4 beds |
show details | |

|
#36
Dorney Park Rd
Allentown, PA 18104
|
1,596 sq. feet
|
1 baths 2 beds |
show details | |

|
#37
Schaeffer St
Boyertown, PA 19512
|
1,320 sq. feet
|
1 baths 3 beds |
show details | |

|
#38
Canyon Creek Rd
Gilbertsville, PA 19525
|
2,380 sq. feet
|
2 baths 4 beds |
show details | |

|
#39
W Chew St
Allentown, PA 18102
|
2,316 sq. feet
|
1 baths 1 beds |
show details | |

|
#40
W Union St
Allentown, PA 18104
|
963 sq. feet
|
1 baths 2 beds |
show details |
| Photo | Address | Area | Beds / Baths | Price | Details |
|---|---|---|---|---|---|

|
#41
Statesman Rd
Chalfont, PA 18914
|
3,150 sq. feet
|
2 baths 4 beds |
show details | |

|
#42
Graterford Rd
Schwenksville, PA 19473
|
1,073 sq. feet
|
1 baths 3 beds |
show details | |

|
#43
Stewart Rd
Collegeville, PA 19426
|
1,705 sq. feet
|
1 baths 3 beds |
show details | |

|
#44
E Court St
Allentown, PA 18109
|
1,000 sq. feet
|
1 baths 3 beds |
show details | |

|
#45
W Lehigh St
Bethlehem, PA 18018
|
1,440 sq. feet
|
1 baths 3 beds |
show details | |

|
#46
Hanover Ave
Allentown, PA 18109
|
1,342 sq. feet
|
1 baths 3 beds |
show details | |

|
#47
Cottage Ave
Bethlehem, PA 18018
|
1,120 sq. feet
|
1 baths 2 beds |
show details | |

|
#48
Mohr Cir
Macungie, PA 18062
|
1,903 sq. feet
|
2 baths 3 beds |
show details | |

|
#49
Chew St
Allentown, PA 18102
|
2,316 sq. feet
|
1 baths 1 beds |
show details | |

|
Check over 1 million property listings on Foreclosure.com!
|
browse all offers | |||

Latest news about housing in Trumbauersville, PA collected exclusively by city-data.com from local newspapers, TV, and radio stations

 | Quakertown: Academy Place, Brayton Gardens II, or Hunters Crossing? (2 replies) |
| Help??? To much confusing info.. (7 replies) |

Median year apartment built: 1938
Household type by relationship:
Households: 923- Male householders: 211 (52 living alone), Female householders: 204 (67 living alone)
219 spouses (219 opposite-sex spouses), 16 unmarried partners, (16 opposite-sex unmarried partners), 212 children (166 natural, 6 adopted, 38 stepchildren), 0 grandchildren, 0 brothers or sisters, 31 parents, 0 foster children, 0 other relatives, 15 non-relatives
- In group quarters: 8
Size of family households: 173 2-persons, 41 3-persons, 58 4-persons, 4 5-persons, 1 7-or-more-persons.
Size of nonfamily households: 121 1-person, 30 2-persons.
130 married couples with children.
0 single-parent households (0 men, 0 women).
97.0% of residents of Trumbauersville speak English at home.
1.7% of residents speak Spanish at home (67% speak English very well, 33% speak English well).
0.4% of residents speak other Indo-European language at home (100% speak English very well).
0.3% of residents speak Asian or Pacific Island language at home (100% speak English very well).
Foreign born population: 19 (2.1%)
(47.4% of them are naturalized citizens)
| Here: | 6.9 |
| State: | 6.8 |
| Here: | 4.7 |
| State: | 4.3 |

- Bedrooms in owner-occupied houses and condos in Trumbauersville, Pennsylvania
- 0no bedroom
- 61 bedroom
- 202 bedrooms
- 2313 bedrooms
- 554 bedrooms
- 25+ bedrooms

- Bedrooms in renter-occupied apartments in Trumbauersville, Pennsylvania
- 0no bedroom
- 361 bedroom
- 512 bedrooms
- 223 bedrooms
- 14 bedrooms
- 05+ bedrooms

- Cars and other vehicles available in Trumbauersville in owner-occupied houses/condos
- 26no vehicle
- 571 vehicle
- 1322 vehicles
- 673 vehicles
- 264 vehicles
- 55+ vehicles

- Cars and other vehicles available in Trumbauersville in renter-occupied apartments
- 3no vehicle
- 511 vehicle
- 452 vehicles
- 63 vehicles
- 54 vehicles
- 05+ vehicles

- Rooms in owner-occupied houses in Trumbauersville, Pennsylvania
- 01 room
- 02 rooms
- 03 rooms
- 134 rooms
- 255 rooms
- 786 rooms
- 917 rooms
- 578 rooms
- 499+ rooms

- Rooms in renter-occupied apartments in Trumbauersville, Pennsylvania
- 01 room
- 02 rooms
- 413 rooms
- 104 rooms
- 345 rooms
- 86 rooms
- 147 rooms
- 08 rooms
- 39+ rooms


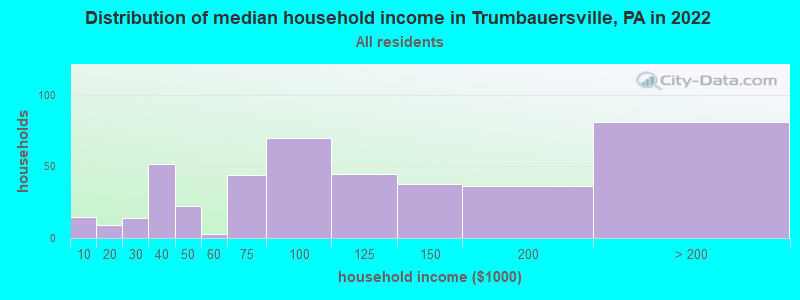
Trumbauersville, PA household income distribution

- 15Less than $10,000
- 9$10,000 to $19,999
- 14$20,000 to $29,999
- 52$30,000 to $39,999
- 22$40,000 to $49,999
- 3$50,000 to $59,999
- 44$60,000 to $74,999
- 70$75,000 to $99,999
- 45$100,000 to $124,999
- 38$125,000 to $149,999
- 36$150,000 to $199,999
- 81$200,000 or more
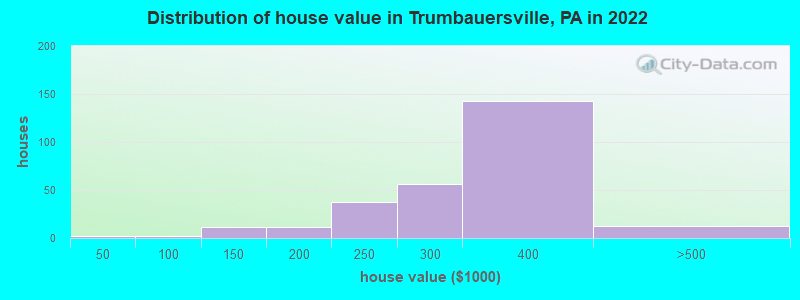
Home value of owner - occupied houses in 2022 in Trumbauersville, PA
-
- 2$35,000 to $39,999
- 1$90,000 to $99,999
- 11$125,000 to $149,999
- 4$150,000 to $174,999
- 7$175,000 to $199,999
- 38$200,000 to $249,999
- 56$250,000 to $299,999
- 143$300,000 to $399,999
- 10$400,000 to $499,999
- 2$500,000 to $749,999
Rent paid by renters in 2022 in Trumbauersville, PA
-
- 2$700 to $749
- 11$750 to $799
- 16$800 to $899
- 8$900 to $999
- 31$1,000 to $1,249
- 20$1,250 to $1,499
- 9$1,500 to $1,999


Percentage of workers working in this county: 58.6%
Number of people working at home: 80 (13.9% of all workers)
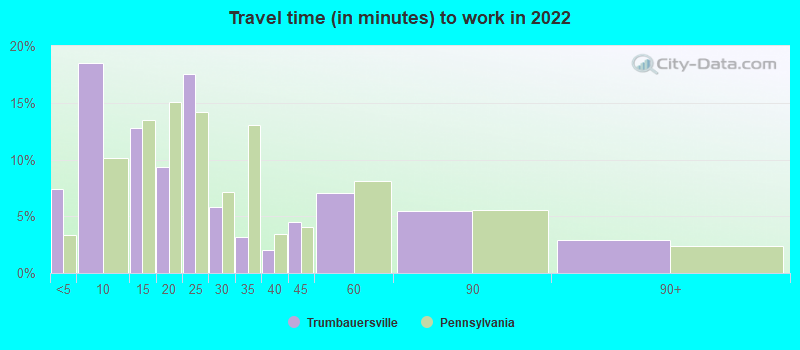
Travel time to work (commute)
- Less than 5 minutes: 0
- 5 to 9 minutes: 44
- 10 to 14 minutes: 89
- 15 to 19 minutes: 96
- 20 to 24 minutes: 46
- 25 to 29 minutes: 11
- 30 to 34 minutes: 49
- 35 to 39 minutes: 19
- 40 to 44 minutes: 31
- 45 to 59 minutes: 31
- 60 to 89 minutes: 22
- 90 or more minutes: 47
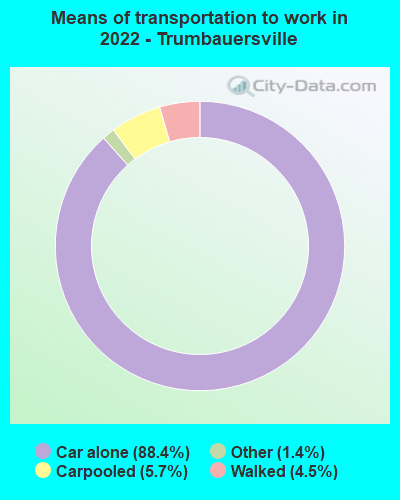
Means of transportation to work:
- Drove a car alone: 693 (77.8%)
- Carpooled: 41 (4.6%)
- Taxi: 15 (1.7%)
- Walked: 30 (3.4%)
- Worked at home: 80 (9.0%)

- Unemployment by race in 2022
- Unemployment rate for White non-Hispanic residents
- 0.3%Males
- Unemployment rate for two or more race residents
- 62.7%Males

- Year of entry for the foreign-born population in Trumbauersville, Pennsylvania
- 32010 or later
- 132000 to 2009
- 01990 to 1999
- 61980 to 1989
- 81970 to 1979
- 4Before 1970

First ancestries reported:
- German: 130 (39.0%)
- Irish: 41 (12.3%)
- English: 22 (6.6%)
- Polish: 22 (6.6%)
- American: 21 (6.3%)
- Italian: 19 (5.7%)
- Ukrainian: 6 (1.8%)
- European: 5 (1.5%)
- Scotch-Irish: 5 (1.5%)
- Pennsylvania German: 3 (0.9%)
- Scottish: 3 (0.9%)
- Armenian: 2 (0.6%)
- Dutch: 2 (0.6%)
- French: 1 (0.3%)
Most common places of birth for foreign-born residents (%):
| Trumbauersville: | 21.1% (4) |
| Pennsylvania: | 5.8% (54,190) |
| Trumbauersville: | 15.8% (3) |
| Pennsylvania: | 2.9% (27,433) |
| Trumbauersville: | 15.8% (3) |
| Pennsylvania: | 1.5% (13,823) |
| Trumbauersville: | 10.5% (2) |
| Pennsylvania: | 0.2% (2,004) |
| Trumbauersville: | 10.5% (2) |
| Pennsylvania: | 0.5% (4,424) |
| Trumbauersville: | 10.5% (2) |
| Pennsylvania: | 0.2% (1,902) |
Place of birth for U.S.-born residents:
- This state: 762
- Other state: 133
- Northeast: 82
- Midwest: 14
- South: 34
- West: 1
94.2% of Trumbauersville residents lived in the same house 1 years ago.
Out of people who lived in different houses, 19.4% lived in this county.
Out of people who lived in different counties, 100.0% lived in Pennsylvania.
| Trumbauersville: | 94.2% |
| State average: | 89.3% |
Education attainment for males 25 years and older:
- No schooling: 3
- Nursery to 4th grade: 0
- 5th and 6th grade: 0
- 7th and 8th grade: 0
- 9th grade: 4
- 10th grade: 1
- 11th grade: 13
- 12th grade, no diploma: 5
- High school graduate (or equivalency): 113
- Less than 1 year of college: 13
- Some college more than 1 year, no degree: 67
- Associate degree: 79
- Bachelor's degree: 58
- Master's degree: 28
- Professional school degree: 0
- Doctorate degree: 0

Education attainment for females 25 years and older:
- No schooling: 0
- Nursery to 4th grade: 0
- 5th and 6th grade: 3
- 7th and 8th grade: 0
- 9th grade: 0
- 10th grade: 0
- 11th grade: 13
- 12th grade, no diploma: 1
- High school graduate (or equivalency): 107
- Less than 1 year of college: 4
- Some college more than 1 year, no degree: 76
- Associate degree: 32
- Bachelor's degree: 70
- Master's degree: 22
- Professional school degree: 2
- Doctorate degree: 11


Housing units in structures:
- One, detached: 283
- One, attached: 54
- Two: 55
- 3 or 4: 21
- 5 to 9: 33
Housing units lacking complete kitchen facilities in 2022: 2.9%
House/condo owner moved in on average 16 years ago
Renter moved in on average 5 years ago

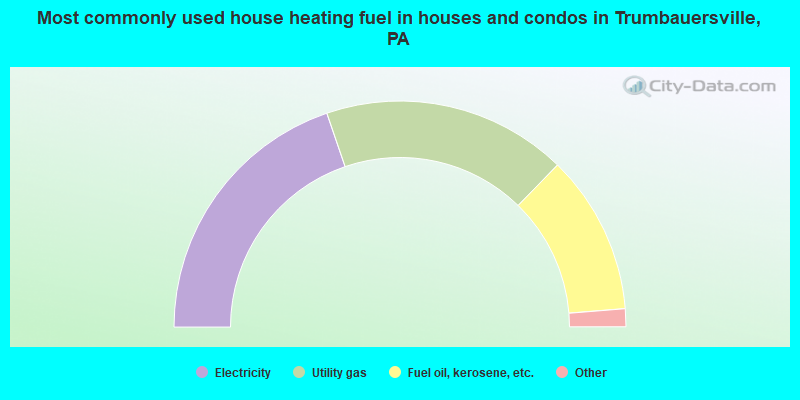
- 39.8%Electricity
- 35.3%Utility gas
- 23.0%Fuel oil, kerosene, etc.
- 1.6%Bottled, tank, or LP gas
- 0.3%Other fuel
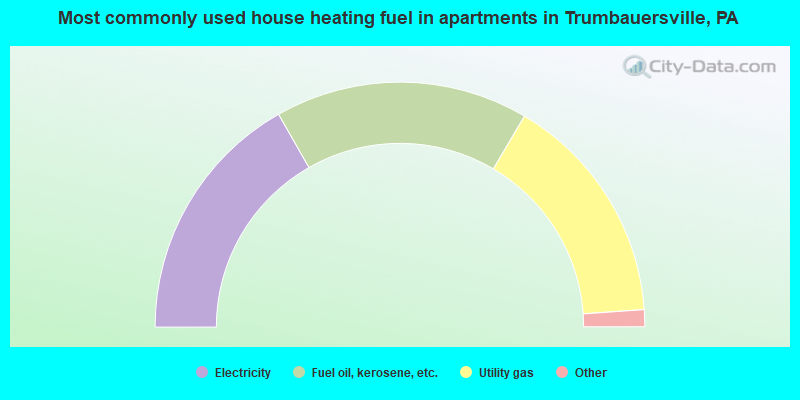
- 34.3%Electricity
- 34.3%Fuel oil, kerosene, etc.
- 31.5%Utility gas
Private vs. public school enrollment:
| Here: | 9.6% |
| Pennsylvania: | 15.7% |
| Here: | 0.0% |
| Pennsylvania: | 13.4% |
| Here: | 22.7% |
| Pennsylvania: | 39.8% |


