Trinity, FL (Florida) Houses and Residents
| Trinity: | $510,002 |
| Florida: | $354,100 |
Mean price in 2022:
Detached houses: $387,422
Here: $387,422 State: $500,941 Townhouses or other attached units: $232,515
Here: $232,515 State: $370,869
Total population: 10,907 (Urban population: 4,484, Rural population: 0)
Houses: 7,538 (7,194 occupied: 6,363 owner occupied, 1,021 renter occupied)
| % of renters here: | 14% |
| State: | 33% |
Housing density: 1,597 houses/condos per square mile
Median price asked for vacant for-sale houses and condos in 2022: $569,900.
Median contract rent in 2022: over $2,000 (lower quartile is $1,838, upper quartile is over $2,000)
Median rent asked for vacant for-rent units in 2022: $1,784
Median gross rent in Trinity, FL in 2022: over $2,000
Housing units in Trinity with a mortgage: 4,523 (247 second mortgage, 0 home equity loan, 206 both second mortgage and home equity loan)
Houses without a mortgage: 149
Median household income for houses/condos with a mortgage: $122,853
Median household income for apartments without a mortgage: $85,606
Median monthly housing costs: $1,984
Compare current foreclosures near Trinity, FL:
| Photo | Address | Area | Beds / Baths | Price | Details |
|---|---|---|---|---|---|

|
#1
Oakridge Dr
Palm Harbor, FL 34685
|
2,344 sq. feet
|
3 baths 4 beds |
$710,000
|
show details |

|
#2
Blazing Trail Way
Land O Lakes, FL 34639
|
2,486 sq. feet
|
3 baths 4 beds |
$409,900
|
show details |

|
#3
Kibler Ln
Holiday, FL 34691
|
1,457 sq. feet
|
1 baths 2 beds |
$160,000
|
show details |

|
#4
Us Highway 19 N Apt 19-C
Clearwater, FL 33764
|
- sq. feet
|
2 baths 2 beds |
$208,000
|
show details |

|
#5
Sirius Ln
Hudson, FL 34667
|
1,245 sq. feet
|
2 baths 3 beds |
show details | |

|
#6
Beechcraft St
New Port Richey, FL 34654
|
2,476 sq. feet
|
3 baths 5 beds |
show details | |

|
#7
Park Dr
New Port Richey, FL 34652
|
1,774 sq. feet
|
2 baths 3 beds |
show details | |

|
#8
Winners Cir
Odessa, FL 33556
|
3,662 sq. feet
|
3 baths 5 beds |
show details | |

|
#9
Lancer Dr
Tampa, FL 33618
|
1,452 sq. feet
|
2 baths 3 beds |
show details | |

|
#10
Corvette Dr
Tampa, FL 33624
|
1,404 sq. feet
|
1 baths 2 beds |
show details |
| Photo | Address | Area | Beds / Baths | Price | Details |
|---|---|---|---|---|---|

|
#11
Tughill Dr
Tampa, FL 33624
|
2,124 sq. feet
|
2 baths 4 beds |
show details | |

|
#12
Crosswinds Dr
Palm Harbor, FL 34683
|
1,814 sq. feet
|
2 baths 3 beds |
show details | |

|
#13
Galewood Cir
Tampa, FL 33615
|
1,445 sq. feet
|
1 baths 2 beds |
show details | |

|
#14
Grasmere Dr
Land O Lakes, FL 34637
|
2,568 sq. feet
|
3 baths 4 beds |
show details | |

|
#15
Hickory Gate Dr W
Dunedin, FL 34698
|
3,348 sq. feet
|
4 baths 4 beds |
show details | |

|
#16
Swenson Ter
Lutz, FL 33549
|
1,816 sq. feet
|
2 baths 3 beds |
show details | |

|
#17
Timberlane West Dr
Tampa, FL 33615
|
1,441 sq. feet
|
2 baths 3 beds |
show details | |

|
#18
Rider Dr
New Port Richey, FL 34653
|
1,523 sq. feet
|
2 baths 3 beds |
show details | |

|
#19
Harbor Hill Dr
Safety Harbor, FL 34695
|
1,227 sq. feet
|
1 baths 2 beds |
show details | |

|
#20
S Saturn Ave
Clearwater, FL 33755
|
1,126 sq. feet
|
1 baths 2 beds |
show details |
| Photo | Address | Area | Beds / Baths | Price | Details |
|---|---|---|---|---|---|

|
#21
Luce Dr N
Clearwater, FL 33761
|
2,413 sq. feet
|
4 baths 4 beds |
show details | |

|
#22
Windsurfer Way
Tampa, FL 33615
|
1,356 sq. feet
|
2 baths 3 beds |
show details | |

|
#23
Oasis Palm Dr
Tampa, FL 33615
|
1,733 sq. feet
|
2 baths 3 beds |
show details | |

|
#24
Westbay Ave
New Port Richey, FL 34654
|
1,100 sq. feet
|
1 baths 2 beds |
show details | |

|
#25
Shady Tree Ct
Tampa, FL 33634
|
1,230 sq. feet
|
1 baths 2 beds |
show details | |

|
#26
Camino Villa Blvd
Tampa, FL 33635
|
1,164 sq. feet
|
2 baths 3 beds |
show details | |

|
#27
Crystal Clear Ln
Lutz, FL 33548
|
2,966 sq. feet
|
3 baths 4 beds |
show details | |

|
#28
Mayfield Dr
Port Richey, FL 34668
|
864 sq. feet
|
1 baths 2 beds |
show details | |

|
#29
Glen Forest Ct
Tampa, FL 33615
|
868 sq. feet
|
1 baths 2 beds |
show details | |

|
#30
Cedar Dune Dr
Tampa, FL 33624
|
1,264 sq. feet
|
2 baths 3 beds |
show details |
| Photo | Address | Area | Beds / Baths | Price | Details |
|---|---|---|---|---|---|

|
#31
Krazy Ln
Lutz, FL 33548
|
2,039 sq. feet
|
2 baths 4 beds |
show details | |

|
#32
Sommers Ave
Hudson, FL 34667
|
1,288 sq. feet
|
2 baths 3 beds |
show details | |

|
#33
Oslin St
Tampa, FL 33615
|
1,876 sq. feet
|
2 baths 4 beds |
show details | |

|
#34
Cherry Creek Dr
Tampa, FL 33618
|
1,730 sq. feet
|
2 baths 3 beds |
show details | |

|
#35
Bramblebrush St
Tampa, FL 33624
|
1,425 sq. feet
|
2 baths 3 beds |
show details | |

|
#36
Amber Ct
Tampa, FL 33634
|
2,152 sq. feet
|
2 baths 4 beds |
show details | |

|
#37
Sunshine Blvd
New Port Richey, FL 34654
|
1,108 sq. feet
|
1 baths 2 beds |
show details | |

|
#38
Hamilton Park Blvd
Tampa, FL 33615
|
2,534 sq. feet
|
3 baths 4 beds |
show details | |

|
#39
Pecan Tree Dr
Hudson, FL 34669
|
1,782 sq. feet
|
2 baths 3 beds |
show details | |

|
#40
Hammock Woods Dr
Odessa, FL 33556
|
3,495 sq. feet
|
2 baths 4 beds |
show details |
| Photo | Address | Area | Beds / Baths | Price | Details |
|---|---|---|---|---|---|

|
#41
Keel Ct
Hudson, FL 34667
|
1,348 sq. feet
|
2 baths 3 beds |
show details | |

|
#42
San Vincente Way
Port Richey, FL 34668
|
1,744 sq. feet
|
2 baths 3 beds |
show details | |

|
#43
Regency Park Blvd
Port Richey, FL 34668
|
986 sq. feet
|
1 baths 2 beds |
show details | |

|
#44
Lamont Ave
New Port Richey, FL 34654
|
1,075 sq. feet
|
2 baths 1 beds |
show details | |

|
#45
Silvermill Dr
Tampa, FL 33635
|
1,748 sq. feet
|
2 baths 3 beds |
show details | |

|
#46
Carrollwood Key Dr
Tampa, FL 33624
|
1,152 sq. feet
|
1 baths 2 beds |
show details | |

|
#47
1st Ave
Lutz, FL 33548
|
1,664 sq. feet
|
2 baths 3 beds |
show details | |

|
#48
Commodore Way
Tampa, FL 33615
|
1,724 sq. feet
|
2 baths 4 beds |
show details | |

|
#49
Clubhouse Dr # 306
Tampa, FL 33618
|
1,016 sq. feet
|
2 baths 2 beds |
show details | |

|
Check over 1 million property listings on Foreclosure.com!
|
browse all offers | |||

Latest news about housing in Trinity, FL collected exclusively by city-data.com from local newspapers, TV, and radio stations

 | Considering buying a townhouse or condo (11 replies) |
| New plans for Trinity area...mall, thousands of homes, etc. (17 replies) |
| Soaring Home Prices in Trinity, Wesley chapel and Land O Lakes (81 replies) |
| Home buying - North of Trinity area (9 replies) |
| Any non HOA communities when buying homes near Trinity area? (9 replies) |
| Wiregrass Mall phase II with luxury apartments (47 replies) |

Median year apartment built: 2014
Household type by relationship:
Households: 19,970- Male householders: 4,452 (447 living alone), Female householders: 2,875 (746 living alone)
4,768 spouses (4,754 opposite-sex spouses), 163 unmarried partners, (157 opposite-sex unmarried partners), 6,101 children (5,822 natural, 93 adopted, 186 stepchildren), 167 grandchildren, 22 brothers or sisters, 535 parents, 0 foster children, 188 other relatives, 694 non-relatives
Size of family households: 2,543 2-persons, 1,221 3-persons, 1,126 4-persons, 640 5-persons, 59 6-persons, 76 7-or-more-persons.
Size of nonfamily households: 1,181 1-person, 213 2-persons, 245 3-persons.
3,701 married couples with children.
913 single-parent households (85 men, 828 women).
85.5% of residents of Trinity speak English at home.
4.2% of residents speak Spanish at home (71% speak English very well, 26% speak English well, 3% speak English not well).
4.5% of residents speak other Indo-European language at home (90% speak English very well, 9% speak English well, 2% speak English not well).
1.2% of residents speak Asian or Pacific Island language at home (62% speak English very well, 2% speak English well, 36% speak English not well).
4.8% of residents speak other language at home (80% speak English very well, 16% speak English well, 4% speak English not well).
Foreign born population: 3,049 (15.3%)
(85.8% of them are naturalized citizens)
| Here: | 6.6 |
| State: | 5.9 |
| Here: | 5.4 |
| State: | 4.2 |

- Bedrooms in owner-occupied houses and condos in Trinity, Florida
- 0no bedroom
- 01 bedroom
- 8382 bedrooms
- 2,8603 bedrooms
- 2,2734 bedrooms
- 3935+ bedrooms

- Bedrooms in renter-occupied apartments in Trinity, Florida
- 0no bedroom
- 1531 bedroom
- 3332 bedrooms
- 3063 bedrooms
- 1694 bedrooms
- 605+ bedrooms

- Cars and other vehicles available in Trinity in owner-occupied houses/condos
- 50no vehicle
- 1,7041 vehicle
- 2,5712 vehicles
- 1,6223 vehicles
- 3904 vehicles
- 275+ vehicles

- Cars and other vehicles available in Trinity in renter-occupied apartments
- 25no vehicle
- 4161 vehicle
- 4562 vehicles
- 1253 vehicles
- 04 vehicles
- 05+ vehicles

- Rooms in owner-occupied houses in Trinity, Florida
- 01 room
- 02 rooms
- 1393 rooms
- 6124 rooms
- 1,0685 rooms
- 1,3136 rooms
- 8577 rooms
- 8228 rooms
- 1,5529+ rooms

- Rooms in renter-occupied apartments in Trinity, Florida
- 01 room
- 292 rooms
- 2293 rooms
- 1104 rooms
- 2085 rooms
- 2076 rooms
- 1017 rooms
- 238 rooms
- 1159+ rooms


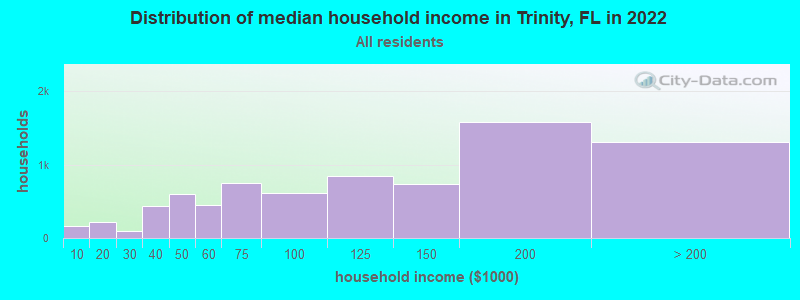
Trinity, FL household income distribution

- 157Less than $10,000
- 211$10,000 to $19,999
- 101$20,000 to $29,999
- 429$30,000 to $39,999
- 596$40,000 to $49,999
- 443$50,000 to $59,999
- 753$60,000 to $74,999
- 611$75,000 to $99,999
- 846$100,000 to $124,999
- 732$125,000 to $149,999
- 1,579$150,000 to $199,999
- 1,310$200,000 or more
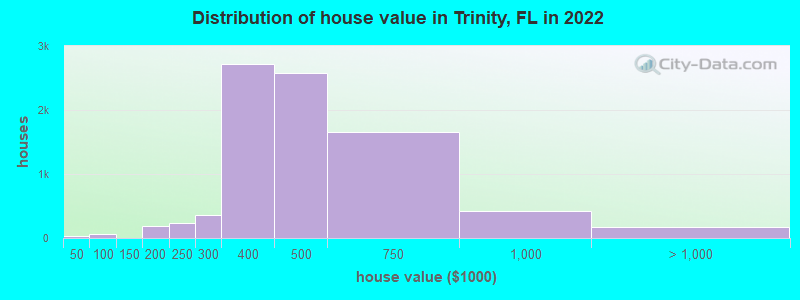
Home value of owner - occupied houses in 2022 in Trinity, FL
-
- 10Less than $10,000
- 9$20,000 to $24,999
- 18$30,000 to $34,999
- 67$60,000 to $69,999
- 58$150,000 to $174,999
- 131$175,000 to $199,999
- 229$200,000 to $249,999
- 366$250,000 to $299,999
- 2,726$300,000 to $399,999
- 2,571$400,000 to $499,999
- 1,649$500,000 to $749,999
- 416$750,000 to $999,999
- 169$1,000,000 to $1,499,999
Rent paid by renters in 2022 in Trinity, FL
-
- 7$1,000 to $1,249
- 70$1,250 to $1,499
- 395$1,500 to $1,999
- 686$2,000 to $2,499
- 219$2,500 to $2,999
- 13$3,000 to $3,499
- 14No cash rent


Percentage of workers working in this county: 63.5%
Number of people working at home: 3,070 (33.8% of all workers)
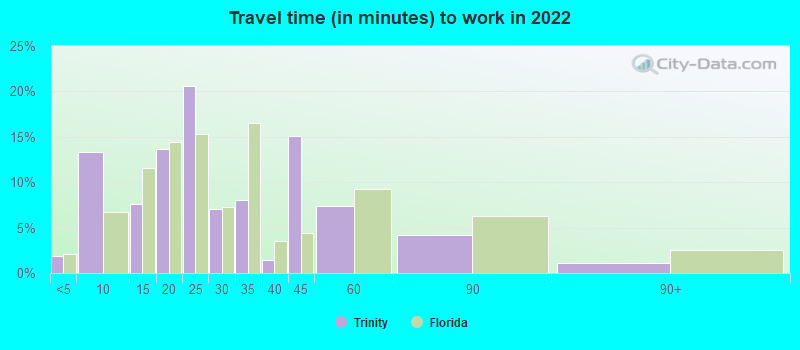
Travel time to work (commute)
- Less than 5 minutes: 200
- 5 to 9 minutes: 634
- 10 to 14 minutes: 525
- 15 to 19 minutes: 591
- 20 to 24 minutes: 683
- 25 to 29 minutes: 466
- 30 to 34 minutes: 878
- 35 to 39 minutes: 402
- 40 to 44 minutes: 389
- 45 to 59 minutes: 1,087
- 60 to 89 minutes: 488
- 90 or more minutes: 87
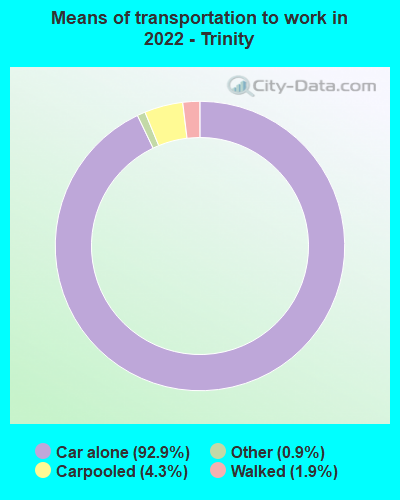
Means of transportation to work:
- Drove a car alone: 2,832 (50.4%)
- Carpooled: 116 (2.1%)
- Taxi: 26 (0.5%)
- Walked: 58 (1.0%)
- Worked at home: 3,070 (54.6%)

- Unemployment by race in 2022
- Unemployment rate for White non-Hispanic residents
- 3.3%Males
- 3.8%Females
- Unemployment rate for Asian residents
- 2.8%Males
- Unemployment rate for two or more race residents
- 4.9%Males
- 2.8%Females

- Year of entry for the foreign-born population in Trinity, Florida
- 1,2372010 or later
- 3232000 to 2009
- 6571990 to 1999
- 311980 to 1989
- 421970 to 1979
- 207Before 1970

First ancestries reported:
- American: 2,584 (27.5%)
- Irish: 956 (10.2%)
- Italian: 855 (9.1%)
- English: 699 (7.4%)
- Egyptian: 658 (7.0%)
- German: 621 (6.6%)
- Polish: 197 (2.1%)
- Greek: 194 (2.1%)
- European: 187 (2.0%)
- Lebanese: 122 (1.3%)
- Brazilian: 114 (1.2%)
- Russian: 100 (1.1%)
- Hungarian: 87 (0.9%)
- Dutch: 80 (0.9%)
- Scottish: 71 (0.8%)
- French: 60 (0.6%)
- Scotch-Irish: 44 (0.5%)
- Austrian: 42 (0.4%)
- Canadian: 30 (0.3%)
- French Canadian: 29 (0.3%)
- British: 28 (0.3%)
- Ukrainian: 28 (0.3%)
- Eastern European: 27 (0.3%)
- Welsh: 19 (0.2%)
- Israeli: 17 (0.2%)
- Danish: 15 (0.2%)
- Portuguese: 15 (0.2%)
- Slovak: 13 (0.1%)
- Belgian: 11 (0.1%)
- Slovene: 8 (0.09%)
- Northern European: 7 (0.07%)
- Swedish: 6 (0.06%)
- Norwegian: 4 (0.04%)
Most common places of birth for foreign-born residents (%):
| Trinity: | 48.0% (1,283) |
| Florida: | 0.3% (13,998) |
| Trinity: | 5.4% (145) |
| Florida: | 0.3% (14,535) |
| Trinity: | 5.4% (144) |
| Florida: | 2.1% (94,349) |
| Trinity: | 4.9% (131) |
| Florida: | 2.4% (109,132) |
| Trinity: | 4.6% (124) |
| Florida: | 22.0% (1,006,576) |
| Trinity: | 4.3% (115) |
| Florida: | 2.7% (122,906) |
| Trinity: | 4.2% (112) |
| Florida: | 6.5% (298,669) |
| Trinity: | 2.5% (67) |
| Florida: | 5.7% (262,042) |
| Trinity: | 2.5% (67) |
| Florida: | 0.4% (16,570) |
| Trinity: | 2.3% (62) |
| Florida: | 0.3% (13,569) |
| Trinity: | 2.2% (59) |
| Florida: | 0.0% (595) |
| Trinity: | 2.1% (55) |
| Florida: | 0.7% (31,076) |
| Trinity: | 2.1% (55) |
| Florida: | 1.2% (54,272) |
| Trinity: | 2.1% (55) |
| Florida: | 1.8% (84,403) |
| Trinity: | 1.9% (50) |
| Florida: | 0.7% (30,755) |
Place of birth for U.S.-born residents:
- This state: 6,889
- Other state: 9,734
- Northeast: 4,385
- Midwest: 2,825
- South: 2,032
- West: 475
85.7% of Trinity residents lived in the same house 1 years ago.
Out of people who lived in different houses, 22.6% lived in this county.
Out of people who lived in different counties, 57.0% lived in Florida.
| Trinity: | 85.7% |
| State average: | 86.3% |
Education attainment for males 25 years and older:
- No schooling: 0
- Nursery to 4th grade: 0
- 5th and 6th grade: 9
- 7th and 8th grade: 0
- 9th grade: 23
- 10th grade: 10
- 11th grade: 0
- 12th grade, no diploma: 49
- High school graduate (or equivalency): 1,053
- Less than 1 year of college: 478
- Some college more than 1 year, no degree: 1,184
- Associate degree: 743
- Bachelor's degree: 2,046
- Master's degree: 804
- Professional school degree: 364
- Doctorate degree: 260

Education attainment for females 25 years and older:
- No schooling: 74
- Nursery to 4th grade: 19
- 5th and 6th grade: 8
- 7th and 8th grade: 20
- 9th grade: 0
- 10th grade: 32
- 11th grade: 15
- 12th grade, no diploma: 135
- High school graduate (or equivalency): 1,242
- Less than 1 year of college: 439
- Some college more than 1 year, no degree: 832
- Associate degree: 696
- Bachelor's degree: 2,616
- Master's degree: 841
- Professional school degree: 155
- Doctorate degree: 126


Housing units in structures:
- One, detached: 6,553
- One, attached: 390
- 3 or 4: 17
- 5 to 9: 30
- 10 to 19: 115
- 20 to 49: 138
- 50 or more: 276
- Mobile homes: 15
House/condo owner moved in on average 7 years ago
Renter moved in on average 2 years ago

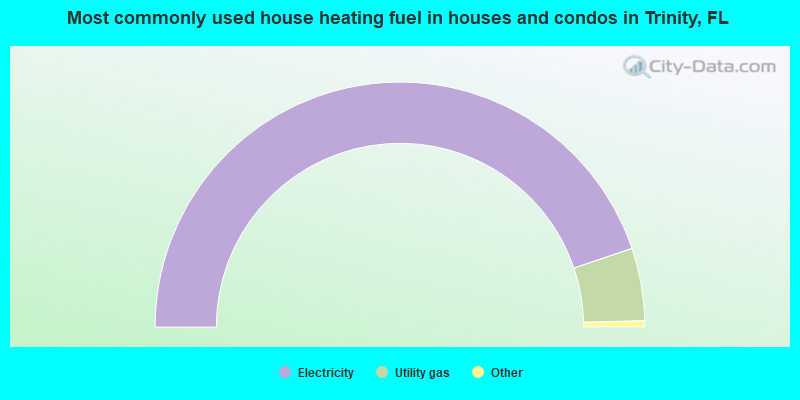
- 89.7%Electricity
- 9.6%Utility gas
- 0.4%Solar energy
- 0.2%Fuel oil, kerosene, etc.
- 0.1%Bottled, tank, or LP gas
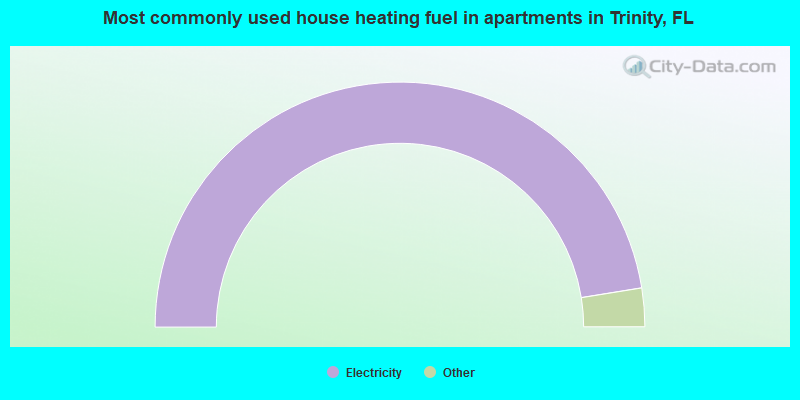
- 94.9%Electricity
- 3.3%Utility gas
- 1.8%No fuel used
Private vs. public school enrollment:
| Here: | 8.9% |
| Florida: | 15.8% |
| Here: | 16.1% |
| Florida: | 12.9% |
| Here: | 28.0% |
| Florida: | 23.6% |


