Trenton, NJ (New Jersey) Houses and Residents
| Trenton: | $169,500 |
| New Jersey: | $428,900 |
Mean price in 2022:
Detached houses: $325,819
Here: $325,819 State: $537,591 Townhouses or other attached units: $142,142
Here: $142,142 State: $381,113 In 2-unit structures: $249,345
Here: $249,345 State: $444,476 In 5-or-more-unit structures: $146,560
Here: $146,560 State: $368,745
Total population: 84,034 (All urban)
Houses: 32,561 (30,789 occupied: 14,047 owner occupied, 16,742 renter occupied)
| % of renters here: | 54% |
| State: | 35% |
Housing density: 4,252 houses/condos per square mile
Median price asked for vacant for-sale houses and condos in 2022: $218,909.
Median contract rent in 2022: $965 (lower quartile is $514, upper quartile is $1,265)
Median rent asked for vacant for-rent units in 2022: $1,206
Median gross rent in Trenton, NJ in 2022: $1,204
Housing units in Trenton with a mortgage: 9,011 (1,045 second mortgage, 0 home equity loan, 893 both second mortgage and home equity loan)
Houses without a mortgage: 331
Median household income for houses/condos with a mortgage: $101,055
Median household income for apartments without a mortgage: $80,781
Median monthly housing costs: $1,299
Compare current foreclosures in Trenton, NJ:
| Photo | Address | Area | Beds / Baths | Price | Details |
|---|---|---|---|---|---|

|
#1
Brunswick Ave
Trenton, NJ 08618
|
1,088 sq. feet
|
1 baths 2 beds |
$68,500
|
show details |

|
#2
Bunker Hill Ave
Trenton, NJ 08648
|
840 sq. feet
|
1 baths 2 beds |
$275,000
|
show details |

|
#3
Marshall Ave
Trenton, NJ 08610
|
672 sq. feet
|
1 baths 3 beds |
show details | |

|
#4
Oliver Ave
Trenton, NJ 08618
|
1,270 sq. feet
|
1 baths 3 beds |
show details | |

|
#5
Foy Dr
Trenton, NJ 08690
|
2,416 sq. feet
|
3 baths 4 beds |
show details | |

|
#6
Franklin St
Trenton, NJ 08611
|
1,232 sq. feet
|
1 baths 3 beds |
show details | |

|
#7
Valley View Rd
Trenton, NJ 08620
|
1,646 sq. feet
|
2 baths 3 beds |
show details | |

|
#8
Emory Ave
Trenton, NJ 08611
|
1,232 sq. feet
|
2 baths 4 beds |
show details | |

|
#9
Falmouth Rd
Trenton, NJ 08620
|
1,008 sq. feet
|
2 baths 3 beds |
show details | |

|
#10
Lower Ferry Rd Apt 1n
Trenton, NJ 08628
|
1,421 sq. feet
|
2 baths 2 beds |
show details |
| Photo | Address | Area | Beds / Baths | Price | Details |
|---|---|---|---|---|---|

|
#11
Arena Dr
Trenton, NJ 08610
|
864 sq. feet
|
1 baths 3 beds |
show details | |

|
#12
Smith Ave
Trenton, NJ 08611
|
1,330 sq. feet
|
1 baths 3 beds |
show details | |

|
#13
Handeland Dr
Trenton, NJ 08690
|
2,334 sq. feet
|
3 baths 4 beds |
show details | |

|
#14
Grover Ave
Trenton, NJ 08610
|
1,036 sq. feet
|
2 baths 3 beds |
show details | |

|
#15
-125 Annabelle Avenue
Trenton, NJ 08610
|
1,188 sq. feet
|
- baths - beds |
show details | |

|
#16
Jeremiah Ave
Trenton, NJ 08610
|
- sq. feet
|
1 baths 4 beds |
show details | |

|
#17
Centre St
Trenton, NJ 08611
|
- sq. feet
|
1 baths 3 beds |
show details | |

|
#18
Edward Ave
Trenton, NJ 08610
|
- sq. feet
|
1 baths 3 beds |
show details | |

|
#19
Norway Ave
Trenton, NJ 08629
|
1,036 sq. feet
|
- baths - beds |
show details | |

|
#20
Dixmont Ave
Trenton, NJ 08618
|
1,602 sq. feet
|
- baths - beds |
show details |
| Photo | Address | Area | Beds / Baths | Price | Details |
|---|---|---|---|---|---|

|
#21
Atlantic Ave
Trenton, NJ 08609
|
1,248 sq. feet
|
- baths - beds |
show details | |

|
#22
Windsor Rd
Trenton, NJ 08691
|
3,524 sq. feet
|
- baths - beds |
show details | |

|
#23
Dawes Ave
Trenton, NJ 08638
|
1,633 sq. feet
|
- baths - beds |
show details | |

|
#24
Steel Street
Trenton, NJ 08611
|
1,932 sq. feet
|
- baths - beds |
show details | |

|
#25
Irwin Pl
Trenton, NJ 08648
|
2,461 sq. feet
|
- baths - beds |
show details | |

|
#26
Bayard St
Trenton, NJ 08611
|
1,364 sq. feet
|
- baths - beds |
show details | |

|
#27
Bunting Ave
Trenton, NJ 08611
|
1,613 sq. feet
|
- baths - beds |
show details | |

|
#28
Walden Cir
Trenton, NJ 08691
|
708 sq. feet
|
- baths - beds |
show details | |

|
#29
Division St
Trenton, NJ 08611
|
- sq. feet
|
- baths - beds |
show details | |

|
#30
Sunnybrae Blvd
Trenton, NJ 08620
|
1,916 sq. feet
|
- baths - beds |
show details |
| Photo | Address | Area | Beds / Baths | Price | Details |
|---|---|---|---|---|---|

|
#31
Hillcrest Ave
Trenton, NJ 08618
|
1,506 sq. feet
|
- baths - beds |
show details | |

|
#32
Wheldon Shivers Dr
Trenton, NJ 08628
|
- sq. feet
|
- baths - beds |
show details | |

|
#33
Martin Luther King Jr Blvd
Trenton, NJ 08618
|
- sq. feet
|
- baths - beds |
show details | |

|
#34
N Montgomery St
Trenton, NJ 08618
|
- sq. feet
|
- baths - beds |
show details | |

|
#35
Dayton St
Trenton, NJ 08610
|
- sq. feet
|
- baths - beds |
show details | |

|
#36
Euclid Ave
Trenton, NJ 08609
|
1,913 sq. feet
|
- baths - beds |
show details | |

|
#37
S Broad St
Trenton, NJ 08610
|
- sq. feet
|
- baths - beds |
show details | |

|
#38
Melody Ct
Trenton, NJ 08691
|
1,176 sq. feet
|
- baths - beds |
show details | |

|
#39
Audrey Pl
Trenton, NJ 08619
|
- sq. feet
|
- baths - beds |
show details | |

|
#40
Lasalle Ave
Trenton, NJ 08618
|
- sq. feet
|
- baths - beds |
show details |
| Photo | Address | Area | Beds / Baths | Price | Details |
|---|---|---|---|---|---|

|
#41
Rosemont Ave
Trenton, NJ 08618
|
- sq. feet
|
- baths - beds |
show details | |

|
#42
Rose St
Trenton, NJ 08648
|
- sq. feet
|
- baths - beds |
show details | |

|
#43
Cliff St
Trenton, NJ 08611
|
- sq. feet
|
- baths - beds |
show details | |

|
#44
Rose St-Middle
Trenton, NJ 08618
|
- sq. feet
|
- baths - beds |
show details | |

|
#45
Ashmore Ave
Trenton, NJ 08611
|
- sq. feet
|
- baths - beds |
show details | |

|
#46
Eaton Ave
Trenton, NJ 08619
|
912 sq. feet
|
- baths - beds |
show details | |

|
#47
Murray St
Trenton, NJ 08618
|
920 sq. feet
|
- baths - beds |
show details | |

|
#48
Steel S B
Trenton, NJ 08611
|
- sq. feet
|
- baths - beds |
show details | |

|
#49
N Willow St
Trenton, NJ 08618
|
6,026 sq. feet
|
- baths - beds |
show details | |

|
Check over 1 million property listings on Foreclosure.com!
|
browse all offers | |||

Latest news about housing in Trenton, NJ collected exclusively by city-data.com from local newspapers, TV, and radio stations


Median year apartment built: 1956
Household type by relationship:
Households: 89,658- Male householders: 13,750 (3,926 living alone), Female householders: 17,039 (5,374 living alone)
7,938 spouses (7,836 opposite-sex spouses), 4,383 unmarried partners, (4,247 opposite-sex unmarried partners), 28,522 children (27,138 natural, 375 adopted, 1,009 stepchildren), 4,098 grandchildren, 1,873 brothers or sisters, 1,159 parents, 143 foster children, 4,212 other relatives, 4,864 non-relatives
- In group quarters: 1,677
Size of family households: 6,034 2-persons, 5,171 3-persons, 4,052 4-persons, 1,556 5-persons, 702 6-persons, 1,540 7-or-more-persons.
Size of nonfamily households: 9,300 1-person, 2,025 2-persons, 71 3-persons, 338 5-persons.
6,650 married couples with children.
12,713 single-parent households (4,100 men, 8,613 women).
56.5% of residents of Trenton speak English at home.
37.6% of residents speak Spanish at home (50% speak English very well, 16% speak English well, 23% speak English not well, 11% don't speak English at all).
3.1% of residents speak other Indo-European language at home (51% speak English very well, 26% speak English well, 22% speak English not well, 2% don't speak English at all).
0.5% of residents speak Asian or Pacific Island language at home (18% speak English very well, 22% speak English well, 51% speak English not well, 9% don't speak English at all).
1.9% of residents speak other language at home (76% speak English very well, 13% speak English well, 11% speak English not well).
Foreign born population: 30,436 (33.9%)
(29.4% of them are naturalized citizens)
| Here: | 7.0 |
| State: | 6.8 |
| Here: | 4.5 |
| State: | 3.9 |

- Bedrooms in owner-occupied houses and condos in Trenton, New Jersey
- 0no bedroom
- 3621 bedroom
- 2,5572 bedrooms
- 7,4003 bedrooms
- 2,6984 bedrooms
- 1,0305+ bedrooms

- Bedrooms in renter-occupied apartments in Trenton, New Jersey
- 1,162no bedroom
- 5,6711 bedroom
- 4,2882 bedrooms
- 3,7293 bedrooms
- 1,6564 bedrooms
- 2365+ bedrooms

- Cars and other vehicles available in Trenton in owner-occupied houses/condos
- 1,444no vehicle
- 4,7721 vehicle
- 3,4382 vehicles
- 2,9853 vehicles
- 5384 vehicles
- 8705+ vehicles

- Cars and other vehicles available in Trenton in renter-occupied apartments
- 7,284no vehicle
- 6,5191 vehicle
- 2,0572 vehicles
- 1273 vehicles
- 2614 vehicles
- 4945+ vehicles

- Rooms in owner-occupied houses in Trenton, New Jersey
- 01 room
- 02 rooms
- 7243 rooms
- 1,2944 rooms
- 1,3255 rooms
- 2,3526 rooms
- 2,4347 rooms
- 4,4088 rooms
- 1,5109+ rooms

- Rooms in renter-occupied apartments in Trenton, New Jersey
- 1,1621 room
- 9342 rooms
- 2,5043 rooms
- 3,9294 rooms
- 4,0195 rooms
- 2,2686 rooms
- 5387 rooms
- 1,0898 rooms
- 2999+ rooms


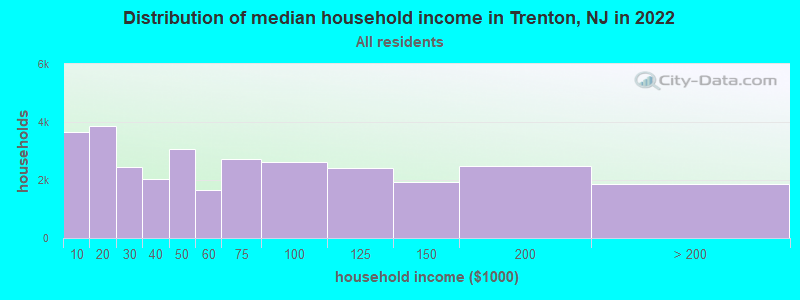
Trenton, NJ household income distribution

- 3,642Less than $10,000
- 3,857$10,000 to $19,999
- 2,444$20,000 to $29,999
- 2,031$30,000 to $39,999
- 3,082$40,000 to $49,999
- 1,664$50,000 to $59,999
- 2,737$60,000 to $74,999
- 2,628$75,000 to $99,999
- 2,418$100,000 to $124,999
- 1,922$125,000 to $149,999
- 2,497$150,000 to $199,999
- 1,867$200,000 or more
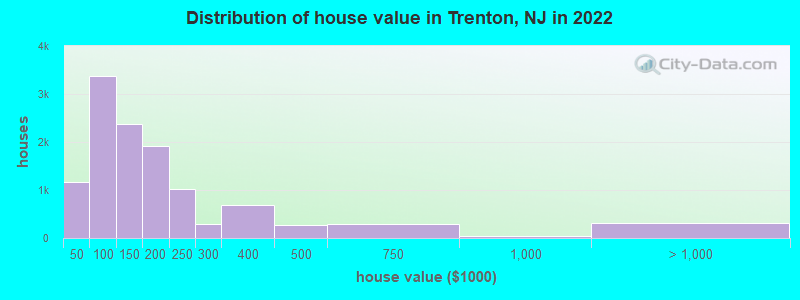
Home value of owner - occupied houses in 2022 in Trenton, NJ
-
- 192Less than $10,000
- 47$10,000 to $14,999
- 53$15,000 to $19,999
- 144$20,000 to $24,999
- 37$25,000 to $29,999
- 34$30,000 to $34,999
- 52$35,000 to $39,999
- 595$40,000 to $49,999
- 517$50,000 to $59,999
- 494$60,000 to $69,999
- 664$70,000 to $79,999
- 561$80,000 to $89,999
- 545$90,000 to $99,999
- 1,824$100,000 to $124,999
- 559$125,000 to $149,999
- 980$150,000 to $174,999
- 928$175,000 to $199,999
- 1,028$200,000 to $249,999
- 288$250,000 to $299,999
- 678$300,000 to $399,999
- 267$400,000 to $499,999
- 287$500,000 to $749,999
- 47$750,000 to $999,999
- 70$1,000,000 to $1,499,999
- 164$1,500,000 to $1,999,999
- 66$2,000,000 or more
Rent paid by renters in 2022 in Trenton, NJ
-
- 271Less than $100
- 137$100 to $149
- 138$150 to $199
- 2,061$200 to $249
- 892$250 to $299
- 326$300 to $349
- 299$350 to $399
- 297$400 to $449
- 42$450 to $499
- 251$500 to $549
- 134$550 to $599
- 231$600 to $649
- 305$650 to $699
- 292$700 to $749
- 486$750 to $799
- 1,587$800 to $899
- 2,624$900 to $999
- 5,474$1,000 to $1,249
- 2,132$1,250 to $1,499
- 1,908$1,500 to $1,999
- 138$2,000 to $2,499
- 287No cash rent


Percentage of workers working in this county: 70.8%
Number of people working at home: 2,353 (6.6% of all workers)
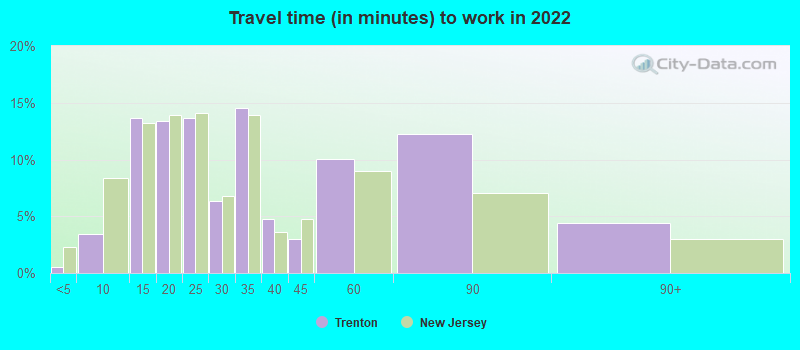
Travel time to work (commute)
- Less than 5 minutes: 440
- 5 to 9 minutes: 1,052
- 10 to 14 minutes: 5,873
- 15 to 19 minutes: 8,786
- 20 to 24 minutes: 5,036
- 25 to 29 minutes: 1,918
- 30 to 34 minutes: 4,920
- 35 to 39 minutes: 1,166
- 40 to 44 minutes: 742
- 45 to 59 minutes: 2,377
- 60 to 89 minutes: 2,392
- 90 or more minutes: 606
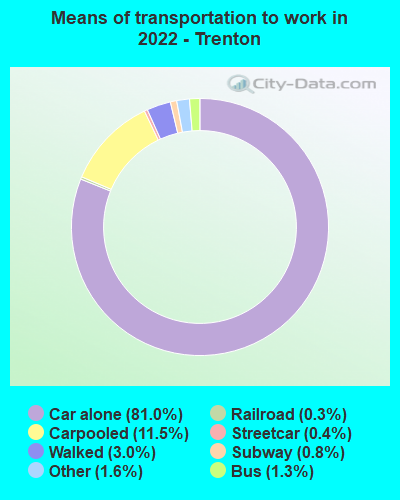
Means of transportation to work:
- Drove a car alone: 34,673 (73.9%)
- Carpooled: 5,069 (10.8%)
- Bus: 485 (1.0%)
- Subway or elevated rail: 175 (0.4%)
- Long-distance train or commuter rail: 446 (1.0%)
- Light rail, streetcar or trolley: 143 (0.3%)
- Ferryboat: 10 (0.0%)
- Taxi: 868 (1.8%)
- Bicycle: 32 (0.1%)
- Walked: 1,607 (3.4%)
- Worked at home: 2,353 (5.0%)

- Unemployment by race in 2022
- Unemployment rate for White non-Hispanic residents
- 8.8%Males
- 8.6%Females
- Unemployment rate for Black residents
- 13.5%Males
- 14.7%Females
- Unemployment rate for American Indian and Alaska Native residents
- 2.7%Males
- Unemployment rate for Asian residents
- 19.3%Males
- 11.2%Females
- Unemployment rate for other race residents
- 2.9%Males
- 3.9%Females
- Unemployment rate for two or more race residents
- 7.1%Males
- 7.1%Females
- Unemployment rate for Hispanic or Latino residents
- 4.6%Males
- 6.0%Females

- Year of entry for the foreign-born population in Trenton, New Jersey
- 12,8692010 or later
- 6,2602000 to 2009
- 3,8381990 to 1999
- 3,0111980 to 1989
- 1,1511970 to 1979
- 1,013Before 1970
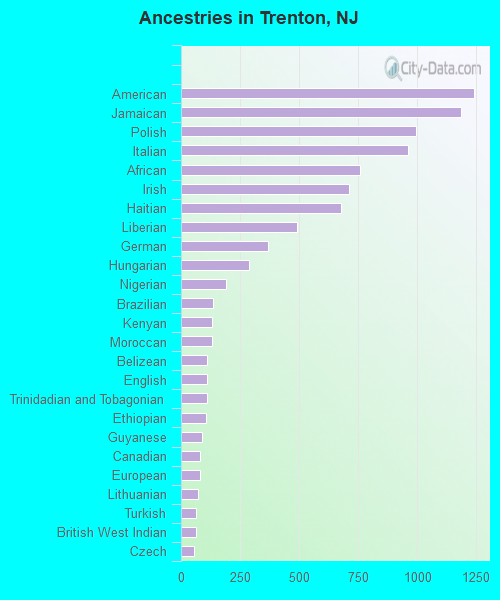
First ancestries reported:
- American: 1,242 (2.1%)
- Jamaican: 1,184 (2.0%)
- Polish: 997 (1.7%)
- Italian: 962 (1.6%)
- African: 760 (1.3%)
- Irish: 711 (1.2%)
- Haitian: 677 (1.1%)
- Liberian: 492 (0.8%)
- German: 369 (0.6%)
- Hungarian: 290 (0.5%)
- Nigerian: 190 (0.3%)
- Brazilian: 136 (0.2%)
- Kenyan: 131 (0.2%)
- Moroccan: 130 (0.2%)
- Belizean: 111 (0.2%)
- English: 109 (0.2%)
- Trinidadian and Tobagonian: 109 (0.2%)
- Ethiopian: 107 (0.2%)
- Guyanese: 91 (0.2%)
- Canadian: 79 (0.1%)
- European: 79 (0.1%)
- Lithuanian: 71 (0.1%)
- Turkish: 65 (0.1%)
- British West Indian: 63 (0.1%)
- Czech: 53 (0.09%)
- Ghanaian: 49 (0.08%)
- Sudanese: 46 (0.08%)
- Russian: 42 (0.07%)
- Ukrainian: 42 (0.07%)
- U.S. Virgin Islander: 39 (0.07%)
- Dutch: 31 (0.05%)
- Scotch-Irish: 27 (0.05%)
- Portuguese: 22 (0.04%)
- West Indian: 20 (0.03%)
- British: 15 (0.03%)
- Slavic: 15 (0.03%)
- French: 10 (0.02%)
- Arab: 7 (0.01%)
- Slovak: 7 (0.01%)
- Bulgarian: 7 (0.01%)
- Norwegian: 3 (0.01%)
Most common places of birth for foreign-born residents (%):
| Trenton: | 25.0% (5,991) |
| New Jersey: | 2.2% (46,813) |
| Trenton: | 16.6% (3,985) |
| New Jersey: | 9.7% (209,055) |
| Trenton: | 7.1% (1,706) |
| New Jersey: | 1.7% (37,335) |
| Trenton: | 6.6% (1,577) |
| New Jersey: | 0.4% (8,533) |
| Trenton: | 5.7% (1,372) |
| New Jersey: | 2.2% (47,365) |
| Trenton: | 4.3% (1,035) |
| New Jersey: | 4.4% (95,275) |
| Trenton: | 4.2% (1,012) |
| New Jersey: | 0.7% (14,848) |
| Trenton: | 3.7% (893) |
| New Jersey: | 4.2% (90,817) |
| Trenton: | 3.3% (803) |
| New Jersey: | 4.8% (102,527) |
| Trenton: | 2.3% (553) |
| New Jersey: | 2.3% (49,491) |
| Trenton: | 1.6% (395) |
| New Jersey: | 2.3% (48,885) |
| Trenton: | 1.6% (387) |
| New Jersey: | 2.3% (48,811) |
Place of birth for U.S.-born residents:
- This state: 42,502
- Other state: 10,346
- Northeast: 5,720
- Midwest: 1,125
- South: 3,490
- West: 11
87.1% of Trenton residents lived in the same house 1 years ago.
Out of people who lived in different houses, 39.9% lived in this county.
Out of people who lived in different counties, 59.6% lived in New Jersey.
| Trenton: | 87.1% |
| State average: | 90.4% |
Education attainment for males 25 years and older:
- No schooling: 2,881
- Nursery to 4th grade: 778
- 5th and 6th grade: 1,190
- 7th and 8th grade: 199
- 9th grade: 108
- 10th grade: 380
- 11th grade: 342
- 12th grade, no diploma: 702
- High school graduate (or equivalency): 11,504
- Less than 1 year of college: 1,710
- Some college more than 1 year, no degree: 3,003
- Associate degree: 1,000
- Bachelor's degree: 3,592
- Master's degree: 1,049
- Professional school degree: 210
- Doctorate degree: 116

Education attainment for females 25 years and older:
- No schooling: 1,469
- Nursery to 4th grade: 1,068
- 5th and 6th grade: 378
- 7th and 8th grade: 245
- 9th grade: 237
- 10th grade: 699
- 11th grade: 446
- 12th grade, no diploma: 1,170
- High school graduate (or equivalency): 10,875
- Less than 1 year of college: 2,029
- Some college more than 1 year, no degree: 2,868
- Associate degree: 1,715
- Bachelor's degree: 2,446
- Master's degree: 1,503
- Professional school degree: 135
- Doctorate degree: 76


Housing units in structures:
- One, detached: 7,967
- One, attached: 12,245
- Two: 3,563
- 3 or 4: 2,011
- 5 to 9: 1,036
- 10 to 19: 1,519
- 20 to 49: 391
- 50 or more: 3,757
- Mobile homes: 72
Housing units lacking complete kitchen facilities in 2022: 3.6%
House/condo owner moved in on average 15 years ago
Renter moved in on average 3 years ago

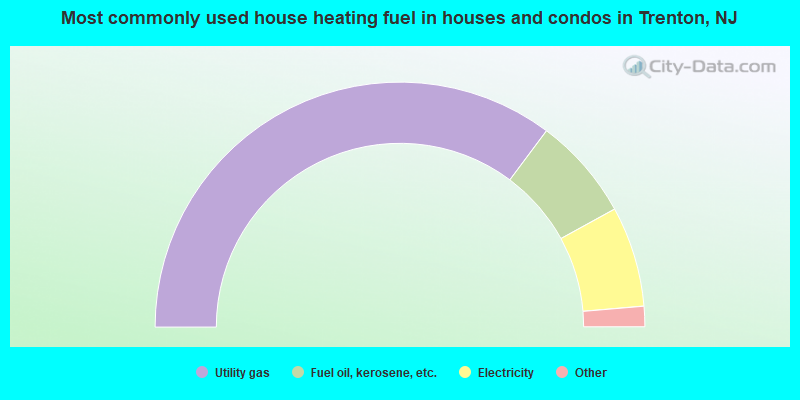
- 70.5%Utility gas
- 13.6%Fuel oil, kerosene, etc.
- 13.3%Electricity
- 2.4%Bottled, tank, or LP gas
- 0.2%No fuel used
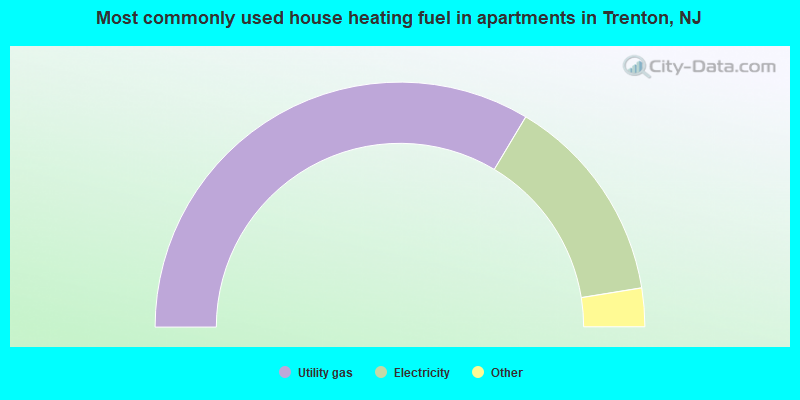
- 67.1%Utility gas
- 27.7%Electricity
- 2.0%Fuel oil, kerosene, etc.
- 1.6%Bottled, tank, or LP gas
- 0.9%No fuel used
- 0.5%Other fuel
Private vs. public school enrollment:
| Here: | 9.3% |
| New Jersey: | 12.3% |
| Here: | 4.7% |
| New Jersey: | 13.1% |
| Here: | 14.9% |
| New Jersey: | 33.2% |


