Torrance, CA (California) Houses and Residents
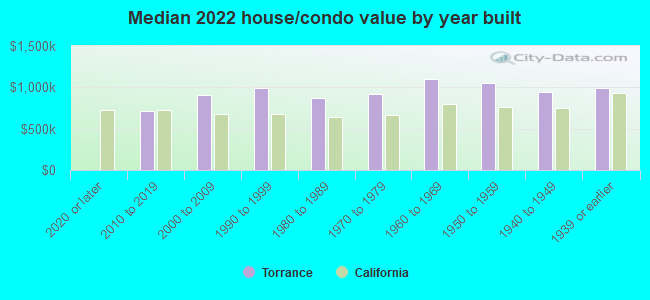
| Torrance: | $1,028,200 |
| California: | $715,900 |
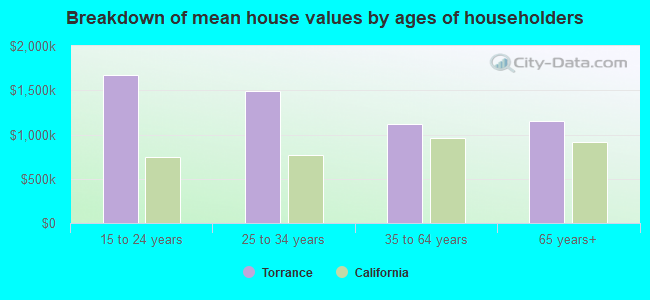
Mean price in 2022:
Detached houses: $1,213,600
Here: $1,213,600 State: $988,808 Townhouses or other attached units: $795,087
Here: $795,087 State: $838,546 In 2-unit structures: $794,853
Here: $794,853 State: $1,138,100 In 3-to-4-unit structures: $588,289
Here: $588,289 State: $824,253 In 5-or-more-unit structures: $587,126
Here: $587,126 State: $730,996 Mobile homes: $260,217
Here: $260,217 State: $184,506 Occupied boats, RVs, vans, etc.: $4,502,130
Here: $4,502,130 State: $204,957
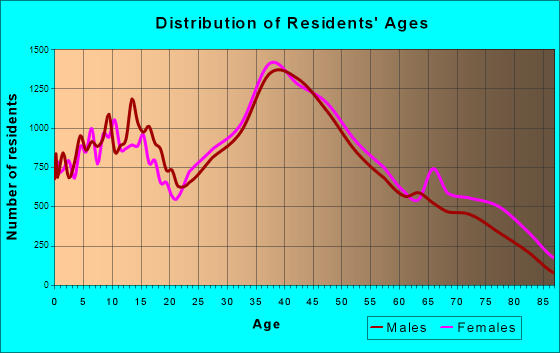
Total population: 148,495 (Urban population: 137,933, Rural population: 0)
Houses: 58,192 (55,215 occupied: 29,825 owner occupied, 25,390 renter occupied)
| % of renters here: | 46% |
| State: | 44% |
Housing density: 2,833 houses/condos per square mile
Median price asked for vacant for-sale houses and condos in 2022: $1,295,839.
Median contract rent in 2022: $1,986 (lower quartile is $1,514, upper quartile is over $2,000)
Median rent asked for vacant for-rent units in 2022: $2,519
Median gross rent in Torrance, CA in 2022: over $2,000
Housing units in Torrance with a mortgage: 18,409 (2,026 second mortgage, 0 home equity loan, 1,676 both second mortgage and home equity loan)
Houses without a mortgage: 303
Median household income for houses/condos with a mortgage: $172,456
Median household income for apartments without a mortgage: $88,067
Median monthly housing costs: $2,155
Compare current foreclosures in Torrance, CA:
| Photo | Address | Area | Beds / Baths | Price | Details |
|---|---|---|---|---|---|

|
#1
Van Ness Ave
Torrance, CA 90504
|
1,093 sq. feet
|
2 baths 2 beds |
show details | |

|
#2
Eastwood Ave
Torrance, CA 90504
|
1,217 sq. feet
|
2 baths 2 beds |
show details | |

|
#3
Eastwood Ave
Torrance, CA 90504
|
1,217 sq. feet
|
2 baths 2 beds |
show details | |

|
#4
Plaza Del Amo Unit 219
Torrance, CA 90503
|
1,058 sq. feet
|
2 baths 2 beds |
show details | |

|
#5
W 177th St
Torrance, CA 90504
|
1,298 sq. feet
|
2 baths 4 beds |
show details | |

|
#6
W 235th St
Torrance, CA 90501
|
1,131 sq. feet
|
1 baths 3 beds |
show details | |

|
#7
W 223rd St
Torrance, CA 90501
|
1,008 sq. feet
|
1 baths 2 beds |
show details | |

|
#8
Regina Ave
Torrance, CA 90504
|
1,783 sq. feet
|
3 baths 5 beds |
show details | |

|
#9
Regina Ave
Torrance, CA 90504
|
1,783 sq. feet
|
3 baths 5 beds |
show details | |

|
#10
Calle Mayor
Torrance, CA 90505
|
1,383 sq. feet
|
2 baths 3 beds |
show details |
| Photo | Address | Area | Beds / Baths | Price | Details |
|---|---|---|---|---|---|

|
#11
W 214th St
Torrance, CA 90502
|
1,386 sq. feet
|
2 baths 3 beds |
show details | |

|
#12
S Vermont Ave Unit 3
Torrance, CA 90502
|
1,549 sq. feet
|
3 baths 3 beds |
show details | |

|
#13
Bulova St
Torrance, CA 90503
|
1,722 sq. feet
|
2 baths 4 beds |
show details | |

|
#14
S Vermont Ave Unit 3
Torrance, CA 90502
|
1,549 sq. feet
|
3 baths 3 beds |
show details | |

|
#15
Crenshaw Blvd
Torrance, CA 90501
|
1,778 sq. feet
|
2 baths 4 beds |
show details | |

|
#16
Denker Ave
Torrance, CA 90501
|
1,480 sq. feet
|
2 baths 4 beds |
show details | |

|
#17
Linda Dr
Torrance, CA 90505
|
1,074 sq. feet
|
1 baths 2 beds |
show details | |

|
#18
W 228th St
Torrance, CA 90502
|
3,428 sq. feet
|
5 baths 7 beds |
show details | |

|
#19
Winlock Rd
Torrance, CA 90505
|
1,207 sq. feet
|
2 baths 3 beds |
show details | |

|
#20
S Van Deene Ave
Torrance, CA 90502
|
1,586 sq. feet
|
2 baths 4 beds |
show details |
| Photo | Address | Area | Beds / Baths | Price | Details |
|---|---|---|---|---|---|

|
#21
Flower Ave
Torrance, CA 90503
|
2,347 sq. feet
|
3 baths 3 beds |
show details | |

|
#22
Denker Ave
Torrance, CA 90501
|
1,196 sq. feet
|
2 baths 2 beds |
show details | |

|
#23
Oakwater St
Torrance, CA 90502
|
2,293 sq. feet
|
3 baths 3 beds |
show details | |

|
#24
W 181st St
Torrance, CA 90504
|
1,711 sq. feet
|
2 baths 4 beds |
show details | |

|
#25
Beckworth Ave
Torrance, CA 90503
|
1,110 sq. feet
|
1 baths 3 beds |
show details | |

|
#26
Torrance Blvd
Torrance, CA 90503
|
3,322 sq. feet
|
4 baths 4 beds |
show details | |

|
#27
Romano Pl
Torrance, CA 90505
|
1,694 sq. feet
|
2 baths 3 beds |
show details | |

|
#28
W 230th St
Torrance, CA 90505
|
1,281 sq. feet
|
2 baths 3 beds |
show details | |

|
#29
Cota Ave
Torrance, CA 90501
|
1,835 sq. feet
|
2 baths 3 beds |
show details | |

|
#30
Newton St
Torrance, CA 90505
|
1,681 sq. feet
|
4 baths 6 beds |
show details |
| Photo | Address | Area | Beds / Baths | Price | Details |
|---|---|---|---|---|---|

|
#31
Normallin St
Torrance, CA 90505
|
876 sq. feet
|
1 baths 2 beds |
show details | |

|
#32
Greenhedge St
Torrance, CA 90502
|
1,059 sq. feet
|
1 baths 3 beds |
show details | |

|
#33
W 222nd St
Torrance, CA 90501
|
1,008 sq. feet
|
1 baths 3 beds |
show details | |

|
#34
Del Amo Blvd
Torrance, CA 90501
|
1,537 sq. feet
|
2 baths 4 beds |
show details | |

|
#35
Sepulveda Blvd Apt 206
Torrance, CA 90505
|
1,212 sq. feet
|
3 baths 2 beds |
show details | |

|
#36
Lincoln Ave # 5
Torrance, CA 90501
|
- sq. feet
|
- baths - beds |
show details | |

|
#37
Amie Ave Apt 35
Torrance, CA 90503
|
- sq. feet
|
- baths - beds |
show details | |

|
#38
W 207th St Apt B
Torrance, CA 90501
|
- sq. feet
|
- baths - beds |
show details | |

|
#39
1222 12 & 1224 Cota Avenue
Torrance, CA 90501
|
- sq. feet
|
- baths - beds |
show details | |

|
#40
W 235th St Apt 1
Torrance, CA 90505
|
- sq. feet
|
- baths - beds |
show details |
| Photo | Address | Area | Beds / Baths | Price | Details |
|---|---|---|---|---|---|

|
#41
W 224th St
Torrance, CA 90501
|
- sq. feet
|
- baths - beds |
show details | |

|
#42
Merrill Dr Apt 5
Torrance, CA 90503
|
- sq. feet
|
- baths - beds |
show details | |

|
#43
S Vermont Av 3
Torrance, CA 90502
|
- sq. feet
|
- baths - beds |
show details | |

|
#44
Redondo Beach Blvd
Torrance, CA 90504
|
- sq. feet
|
- baths - beds |
show details | |

|
#45
Ocean Ave Apt 16
Torrance, CA 90505
|
- sq. feet
|
- baths - beds |
show details | |

|
#46
W Carson St Apt 1
Torrance, CA 90501
|
- sq. feet
|
- baths - beds |
show details | |

|
#47
Neece Ave
Torrance, CA 90505
|
- sq. feet
|
- baths - beds |
show details | |

|
#48
S Western Ave Ste 208
Torrance, CA 90501
|
- sq. feet
|
- baths - beds |
show details | |

|
#49
W 226th St Apt 30
Torrance, CA 90505
|
- sq. feet
|
- baths - beds |
show details | |

|
Check over 1 million property listings on Foreclosure.com!
|
browse all offers | |||

Latest news about housing in Torrance, CA collected exclusively by city-data.com from local newspapers, TV, and radio stations


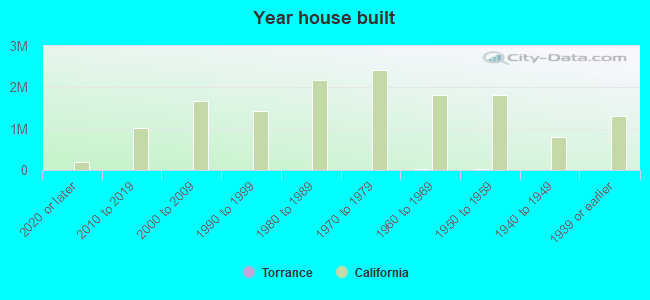
Median year apartment built: 1966
Household type by relationship:
Households: 141,127- Male householders: 30,153 (7,252 living alone), Female householders: 25,062 (7,791 living alone)
27,718 spouses (27,558 opposite-sex spouses), 3,895 unmarried partners, (3,668 opposite-sex unmarried partners), 41,060 children (39,374 natural, 1,103 adopted, 583 stepchildren), 1,134 grandchildren, 2,172 brothers or sisters, 2,616 parents, 0 foster children, 2,533 other relatives, 2,993 non-relatives
- In group quarters: 1,791
Size of family households: 14,475 2-persons, 9,820 3-persons, 7,258 4-persons, 3,070 5-persons, 709 6-persons, 563 7-or-more-persons.
Size of nonfamily households: 15,043 1-person, 3,951 2-persons, 326 3-persons.
22,335 married couples with children.
4,268 single-parent households (994 men, 3,274 women).
58.6% of residents of Torrance speak English at home.
10.6% of residents speak Spanish at home (67% speak English very well, 19% speak English well, 13% speak English not well, 1% don't speak English at all).
5.6% of residents speak other Indo-European language at home (69% speak English very well, 20% speak English well, 9% speak English not well, 2% don't speak English at all).
24.0% of residents speak Asian or Pacific Island language at home (47% speak English very well, 33% speak English well, 16% speak English not well, 4% don't speak English at all).
1.2% of residents speak other language at home (84% speak English very well, 16% speak English well).
Foreign born population: 44,308 (31.4%)
(61.6% of them are naturalized citizens)
| Here: | 5.8 |
| State: | 6.0 |
| Here: | 3.6 |
| State: | 3.9 |
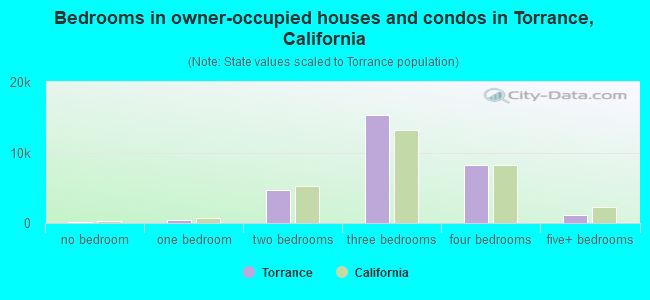
- Bedrooms in owner-occupied houses and condos in Torrance, California
- 174no bedroom
- 3771 bedroom
- 4,6112 bedrooms
- 15,3133 bedrooms
- 8,1714 bedrooms
- 1,1795+ bedrooms
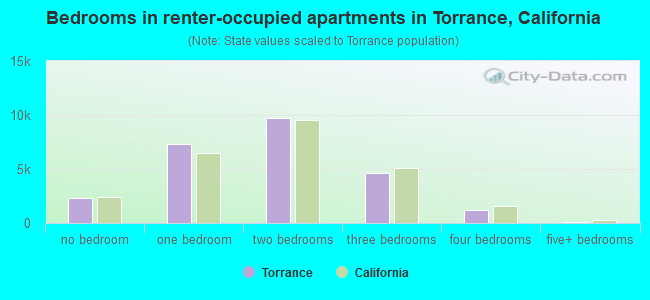
- Bedrooms in renter-occupied apartments in Torrance, California
- 2,337no bedroom
- 7,3321 bedroom
- 9,7462 bedrooms
- 4,6353 bedrooms
- 1,2094 bedrooms
- 1315+ bedrooms
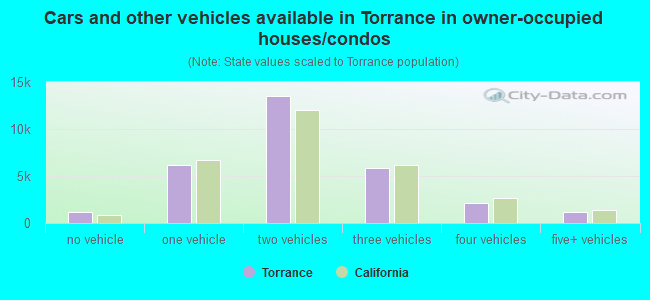
- Cars and other vehicles available in Torrance in owner-occupied houses/condos
- 1,129no vehicle
- 6,1611 vehicle
- 13,4922 vehicles
- 5,8193 vehicles
- 2,0914 vehicles
- 1,1335+ vehicles
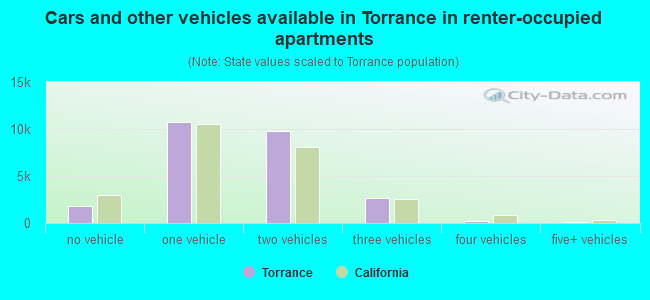
- Cars and other vehicles available in Torrance in renter-occupied apartments
- 1,842no vehicle
- 10,7361 vehicle
- 9,8222 vehicles
- 2,6563 vehicles
- 1854 vehicles
- 1495+ vehicles
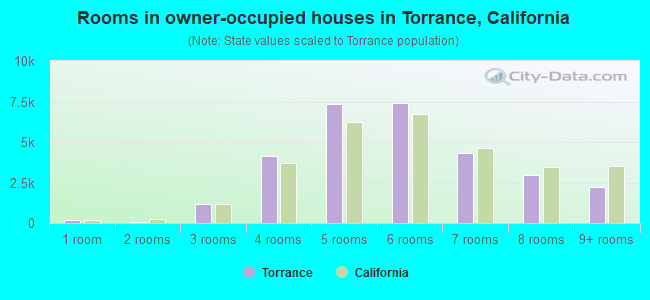
- Rooms in owner-occupied houses in Torrance, California
- 1741 room
- 502 rooms
- 1,1773 rooms
- 4,1554 rooms
- 7,3345 rooms
- 7,4036 rooms
- 4,3367 rooms
- 2,9668 rooms
- 2,2309+ rooms
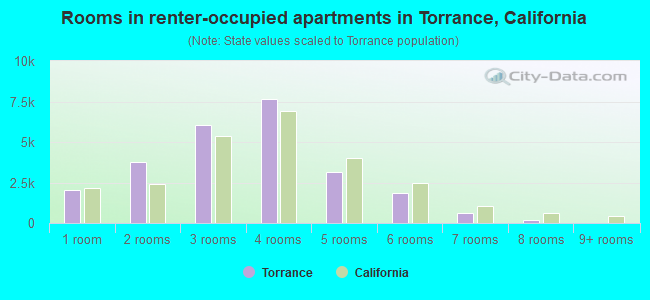
- Rooms in renter-occupied apartments in Torrance, California
- 2,0601 room
- 3,7462 rooms
- 6,0593 rooms
- 7,6644 rooms
- 3,1755 rooms
- 1,8786 rooms
- 6377 rooms
- 1718 rooms
- 09+ rooms
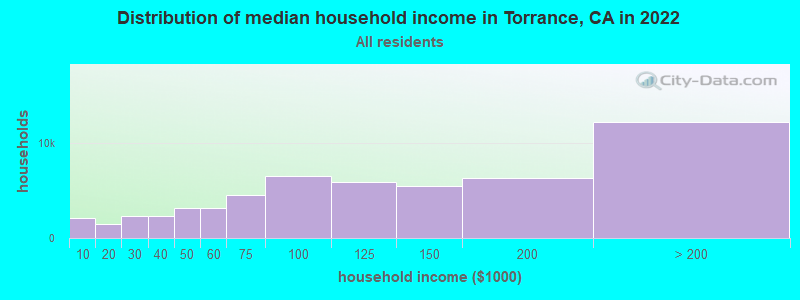
Torrance, CA household income distribution

- 2,118Less than $10,000
- 1,492$10,000 to $19,999
- 2,291$20,000 to $29,999
- 2,275$30,000 to $39,999
- 3,130$40,000 to $49,999
- 3,146$50,000 to $59,999
- 4,512$60,000 to $74,999
- 6,463$75,000 to $99,999
- 5,872$100,000 to $124,999
- 5,498$125,000 to $149,999
- 6,267$150,000 to $199,999
- 12,151$200,000 or more
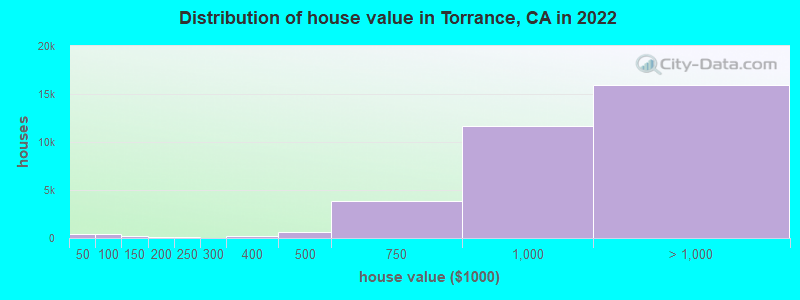
Home value of owner - occupied houses in 2022 in Torrance, CA
-
- 257Less than $10,000
- 53$10,000 to $14,999
- 12$15,000 to $19,999
- 16$20,000 to $24,999
- 17$25,000 to $29,999
- 3$35,000 to $39,999
- 56$40,000 to $49,999
- 88$50,000 to $59,999
- 50$60,000 to $69,999
- 85$70,000 to $79,999
- 80$80,000 to $89,999
- 101$90,000 to $99,999
- 203$100,000 to $124,999
- 43$125,000 to $149,999
- 50$150,000 to $174,999
- 19$175,000 to $199,999
- 74$200,000 to $249,999
- 12$250,000 to $299,999
- 199$300,000 to $399,999
- 592$400,000 to $499,999
- 3,812$500,000 to $749,999
- 11,693$750,000 to $999,999
- 12,077$1,000,000 to $1,499,999
- 2,481$1,500,000 to $1,999,999
- 1,350$2,000,000 or more
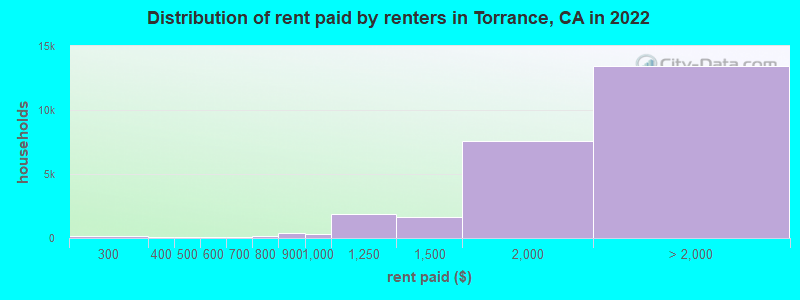
Rent paid by renters in 2022 in Torrance, CA
-
- 83Less than $100
- 55$200 to $249
- 134$250 to $299
- 12$300 to $349
- 74$350 to $399
- 18$400 to $449
- 31$450 to $499
- 32$500 to $549
- 21$550 to $599
- 48$650 to $699
- 37$700 to $749
- 101$750 to $799
- 398$800 to $899
- 296$900 to $999
- 1,870$1,000 to $1,249
- 1,673$1,250 to $1,499
- 7,611$1,500 to $1,999
- 5,486$2,000 to $2,499
- 3,007$2,500 to $2,999
- 1,795$3,000 to $3,499
- 2,114$3,500 or more
- 1,069No cash rent
Percentage of workers working in this county: 96.3%
Number of people working at home: 12,776 (18.2% of all workers)
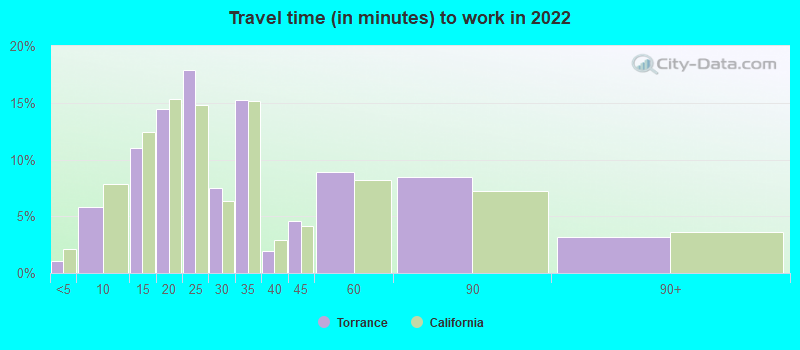
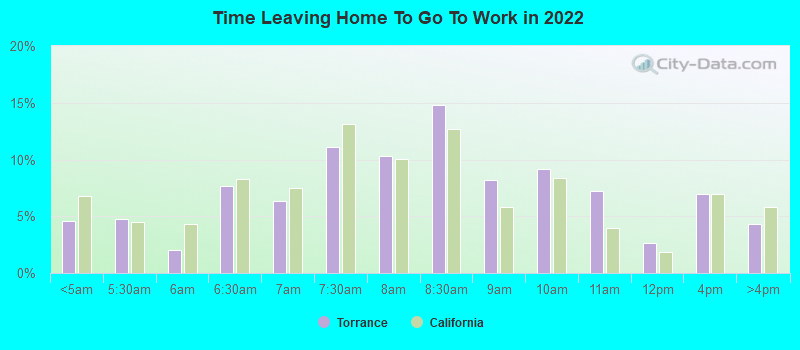
Travel time to work (commute)
- Less than 5 minutes: 758
- 5 to 9 minutes: 3,754
- 10 to 14 minutes: 8,274
- 15 to 19 minutes: 10,434
- 20 to 24 minutes: 8,945
- 25 to 29 minutes: 5,099
- 30 to 34 minutes: 7,349
- 35 to 39 minutes: 1,140
- 40 to 44 minutes: 1,588
- 45 to 59 minutes: 5,470
- 60 to 89 minutes: 3,194
- 90 or more minutes: 1,335
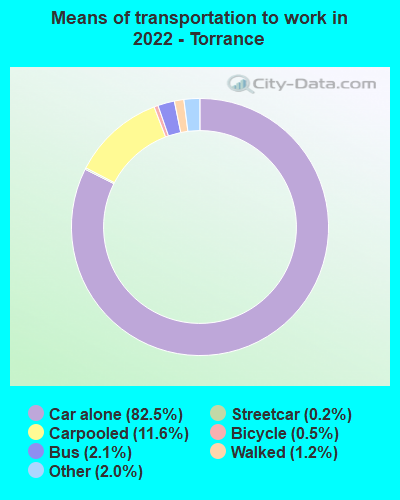
Means of transportation to work:
- Drove a car alone: 71,322 (71.9%)
- Carpooled: 10,002 (10.1%)
- Bus: 1,841 (1.9%)
- Subway or elevated rail: 150 (0.2%)
- Long-distance train or commuter rail: 31 (0.0%)
- Taxi: 1,698 (1.7%)
- Bicycle: 406 (0.4%)
- Walked: 996 (1.0%)
- Worked at home: 12,776 (12.9%)
- Unemployment by race in 2022
- Unemployment rate for White non-Hispanic residents
- 2.8%Males
- 3.4%Females
- Unemployment rate for Black residents
- 9.2%Males
- 6.6%Females
- Unemployment rate for American Indian and Alaska Native residents
- 2.7%Females
- Unemployment rate for Asian residents
- 3.3%Males
- 2.8%Females
- Unemployment rate for other race residents
- 4.7%Males
- 6.5%Females
- Unemployment rate for two or more race residents
- 2.6%Males
- 6.0%Females
- Unemployment rate for Hispanic or Latino residents
- 5.3%Males
- 5.8%Females
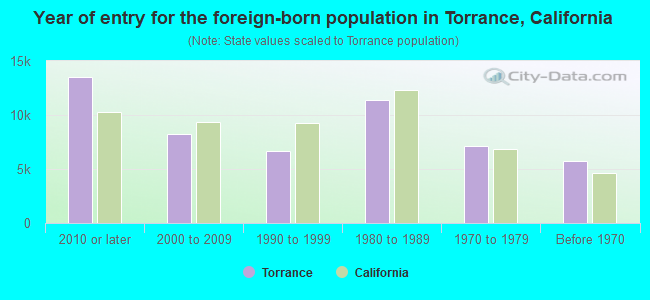
- Year of entry for the foreign-born population in Torrance, California
- 13,5192010 or later
- 8,2512000 to 2009
- 6,6311990 to 1999
- 11,4271980 to 1989
- 7,1401970 to 1979
- 5,777Before 1970
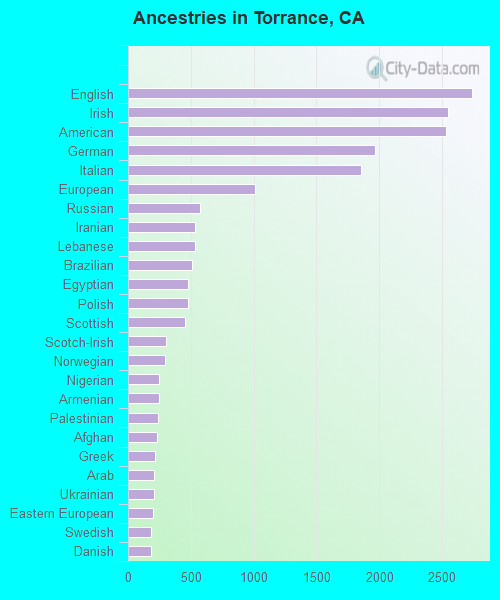
First ancestries reported:
- English: 2,739 (3.2%)
- Irish: 2,547 (3.0%)
- American: 2,531 (3.0%)
- German: 1,965 (2.3%)
- Italian: 1,858 (2.2%)
- European: 1,009 (1.2%)
- Russian: 571 (0.7%)
- Iranian: 537 (0.6%)
- Lebanese: 535 (0.6%)
- Brazilian: 508 (0.6%)
- Egyptian: 477 (0.6%)
- Polish: 476 (0.6%)
- Scottish: 451 (0.5%)
- Scotch-Irish: 299 (0.4%)
- Norwegian: 297 (0.3%)
- Nigerian: 249 (0.3%)
- Armenian: 248 (0.3%)
- Palestinian: 238 (0.3%)
- Afghan: 228 (0.3%)
- Greek: 216 (0.3%)
- Arab: 211 (0.2%)
- Ukrainian: 205 (0.2%)
- Eastern European: 198 (0.2%)
- Swedish: 187 (0.2%)
- Danish: 186 (0.2%)
- Jordanian: 178 (0.2%)
- French: 177 (0.2%)
- British: 177 (0.2%)
- Dutch: 177 (0.2%)
- Portuguese: 141 (0.2%)
- Belizean: 138 (0.2%)
- Lithuanian: 128 (0.2%)
- Croatian: 121 (0.1%)
- Jamaican: 120 (0.1%)
- Hungarian: 106 (0.1%)
- Scandinavian: 105 (0.1%)
- Northern European: 97 (0.1%)
- Canadian: 79 (0.09%)
- Slovak: 78 (0.09%)
- French Canadian: 72 (0.08%)
- Finnish: 66 (0.08%)
- Czech: 64 (0.08%)
- Ghanaian: 64 (0.08%)
- Syrian: 53 (0.06%)
- Welsh: 52 (0.06%)
- Romanian: 48 (0.06%)
- Serbian: 47 (0.06%)
- Bulgarian: 43 (0.05%)
- Swiss: 40 (0.05%)
- African: 32 (0.04%)
- Israeli: 26 (0.03%)
- Assyrian: 22 (0.03%)
- Pennsylvania German: 20 (0.02%)
- Turkish: 20 (0.02%)
- Slavic: 19 (0.02%)
- Trinidadian and Tobagonian: 16 (0.02%)
- Slovene: 15 (0.02%)
- Australian: 13 (0.02%)
- Belgian: 8 (0.01%)
- Estonian: 7 (0.01%)
- Czechoslovakian: 6 (0.01%)
- Latvian: 6 (0.01%)
Most common places of birth for foreign-born residents (%):
| Torrance: | 17.1% (7,350) |
| California: | 3.0% (315,248) |
| Torrance: | 14.5% (6,246) |
| California: | 1.0% (103,575) |
| Torrance: | 8.6% (3,700) |
| California: | 5.2% (539,184) |
| Torrance: | 7.4% (3,180) |
| California: | 37.2% (3,881,193) |
| Torrance: | 7.3% (3,148) |
| California: | 7.8% (818,297) |
| Torrance: | 5.3% (2,286) |
| California: | 4.9% (512,335) |
| Torrance: | 5.2% (2,238) |
| California: | 6.6% (684,672) |
| Torrance: | 3.0% (1,300) |
| California: | 1.7% (176,274) |
| Torrance: | 1.8% (793) |
| California: | 0.5% (53,222) |
| Torrance: | 1.5% (666) |
| California: | 4.2% (440,287) |
| Torrance: | 1.5% (646) |
| California: | 0.7% (74,025) |
Place of birth for U.S.-born residents:
- This state: 72,591
- Other state: 20,999
- Northeast: 6,595
- Midwest: 5,307
- South: 4,977
- West: 4,120
89.9% of Torrance residents lived in the same house 1 years ago.
Out of people who lived in different houses, 40.3% lived in this county.
Out of people who lived in different counties, 51.6% lived in California.
| Torrance: | 89.9% |
| State average: | 88.9% |
Education attainment for males 25 years and older:
- No schooling: 543
- Nursery to 4th grade: 52
- 5th and 6th grade: 302
- 7th and 8th grade: 51
- 9th grade: 163
- 10th grade: 367
- 11th grade: 138
- 12th grade, no diploma: 707
- High school graduate (or equivalency): 8,693
- Less than 1 year of college: 2,621
- Some college more than 1 year, no degree: 6,575
- Associate degree: 4,178
- Bachelor's degree: 16,996
- Master's degree: 7,150
- Professional school degree: 1,432
- Doctorate degree: 928

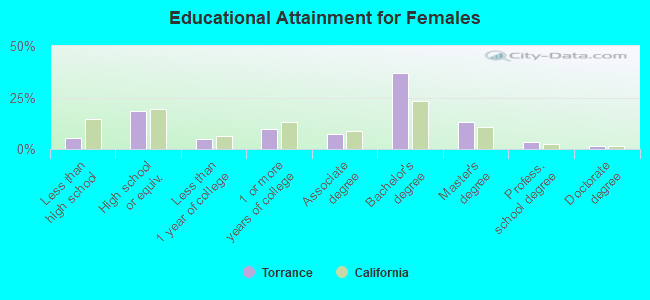
Education attainment for females 25 years and older:
- No schooling: 1,149
- Nursery to 4th grade: 293
- 5th and 6th grade: 348
- 7th and 8th grade: 196
- 9th grade: 121
- 10th grade: 89
- 11th grade: 124
- 12th grade, no diploma: 418
- High school graduate (or equivalency): 9,766
- Less than 1 year of college: 2,445
- Some college more than 1 year, no degree: 5,026
- Associate degree: 3,957
- Bachelor's degree: 19,349
- Master's degree: 6,770
- Professional school degree: 1,773
- Doctorate degree: 764
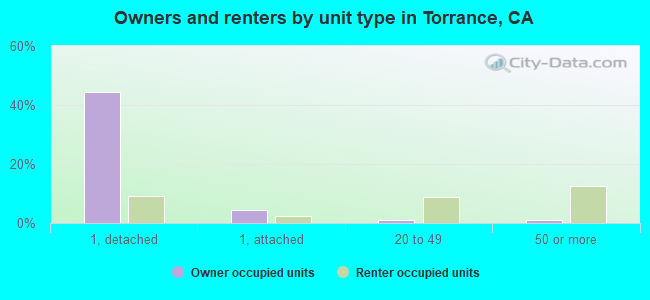
Housing units in structures:
- One, detached: 31,138
- One, attached: 3,124
- Two: 1,182
- 3 or 4: 3,054
- 5 to 9: 2,780
- 10 to 19: 2,037
- 20 to 49: 4,862
- 50 or more: 8,763
- Mobile homes: 1,252
Median worth of mobile homes: $110,300
Housing units lacking complete kitchen facilities in 2022: 3.5%
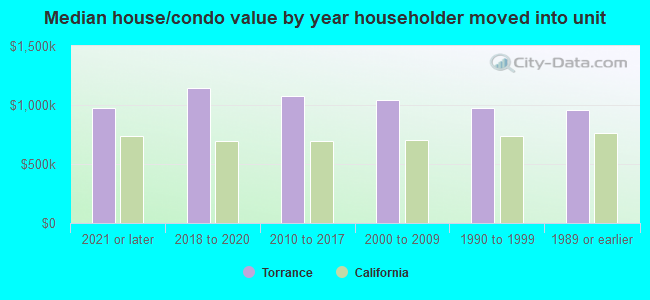
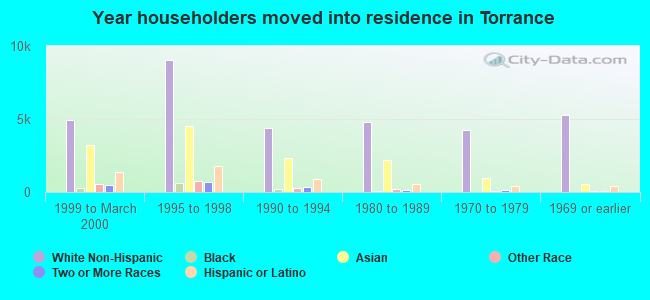
House/condo owner moved in on average 17 years ago
Renter moved in on average 3 years ago
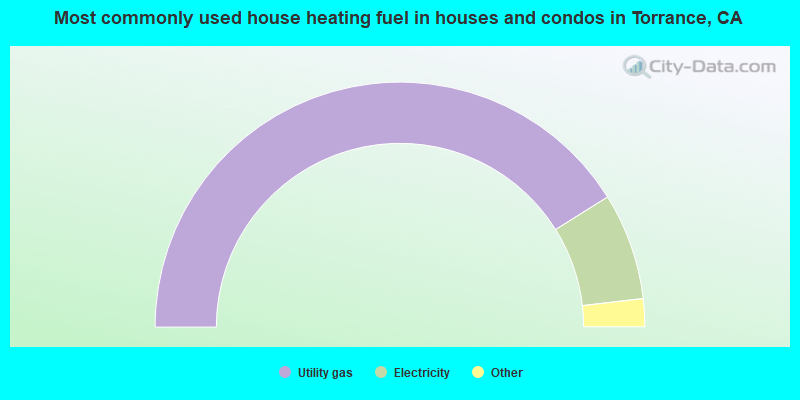
- 82.2%Utility gas
- 14.1%Electricity
- 1.4%No fuel used
- 1.4%Bottled, tank, or LP gas
- 0.6%Solar energy
- 0.3%Wood
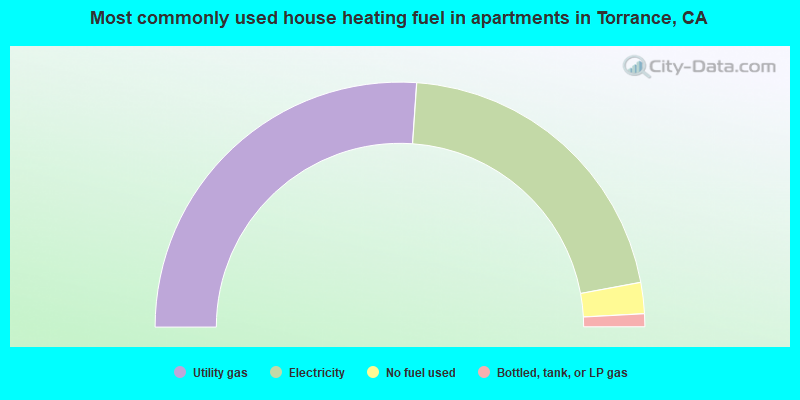
- 52.1%Utility gas
- 41.9%Electricity
- 4.1%No fuel used
- 1.7%Bottled, tank, or LP gas
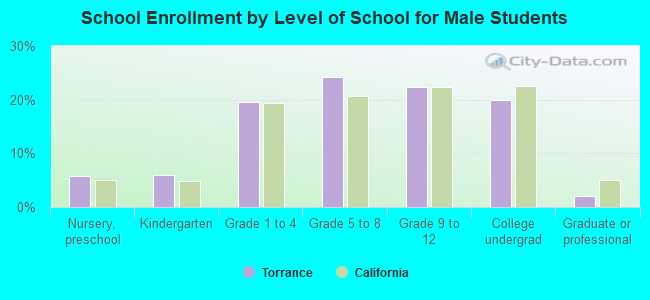
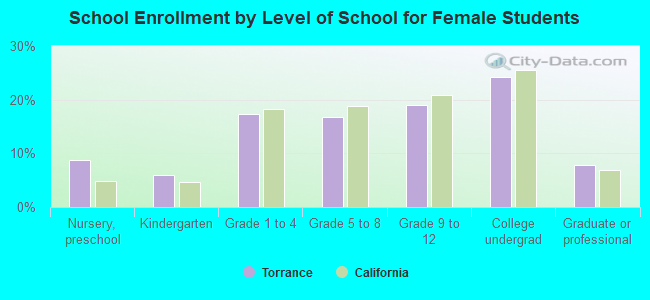
Private vs. public school enrollment:
| Here: | 10.8% |
| California: | 10.5% |
| Here: | 10.8% |
| California: | 8.5% |
| Here: | 18.1% |
| California: | 15.9% |