Jump to a detailed profile or search site with Google Custom Search

Tisbury, MA (Massachusetts) Houses and Residents

Estimated median house or condo value in 2022: $1,007,799 (it was $288,300 in 2000)
Tisbury:

$1,007,799
Massachusetts:

$534,700
Lower value quartile - upper value quartile: $717,456 - $1,370,208

Total population: 3,949 (Urban population: 3,167 (all inside urban clusters), Rural population: 588 (all nonfarm))

Houses: 2,720 (1,646 occupied: 1,065 owner occupied, 581 renter occupied)

% of renters here:

35%
State:

38%

Housing density: 415 houses/condos per square mile

Median price asked for vacant for-sale houses and condos in 2022 in this county: $1,398,746.

Median contract rent in 2022: $1,305 (lower quartile is $949, upper quartile is $1,843)


Median rent asked for vacant for-rent units in 2022: $1,424


Median gross rent in Tisbury, MA in 2022: $1,558

Housing units in Tisbury with a mortgage: 539 (28 second mortgage, 17 home equity loan, 0 both second mortgage and home equity loan)
Houses without a mortgage: 394

Compare current foreclosures near Tisbury, MA:

Check out more offers near Tisbury, MA.
Powered by Foreclosure.com


Tisbury, Massachusetts Age and Sex of Residents

Household type by relationship:

Households: 16,392
  • In family households: 12,344 (2,346 male householders, 1,875 female householders)
    3,251 spouses, 3,822 children (3,629 natural, 110 adopted, 83 stepchildren), 147 grandchildren, 104 brothers or sisters, 120 parents, foster children, 127 other relatives, 496 non-relatives
  • In nonfamily households: 4,048 (1,454 male householders (1,085 living alone)), 1,693 female householders (1,379 living alone)), 901 nonrelatives
  • In group quarters: 143 (87 institutionalized population)

2,365 married couples with children.
828 single-parent households (206 men, 622 women).

91.6% of residents of Tisbury speak English at home.
1.6% of residents speak Spanish at home (100% speak English very well).
6.8% of residents speak other Indo-European language at home (62% speak English very well, 21% speak English well, 5% speak English not well, 12% don't speak English at all).

Foreign born population: 409 (9.9%)
(38.1% of them are naturalized citizens)

Median number of rooms in houses and condos:
Here:

6.6
State:

6.5

Median number of rooms in apartments
Here:

4.2
State:

4.0

Owner-occupied Renter-occupied
Bedrooms in owner-occupied houses and condos in Tisbury, Massachusetts
  • Bedrooms in owner-occupied houses and condos in Tisbury, Massachusetts
  • 0no bedroom
  • 631 bedroom
  • 2222 bedrooms
  • 4403 bedrooms
  • 2624 bedrooms
  • 785+ bedrooms
Bedrooms in renter-occupied apartments in Tisbury, Massachusetts
  • Bedrooms in renter-occupied apartments in Tisbury, Massachusetts
  • 9no bedroom
  • 1721 bedroom
  • 1712 bedrooms
  • 1583 bedrooms
  • 444 bedrooms
  • 275+ bedrooms
Owner-occupied Renter-occupied
Cars and other vehicles available in Tisbury in owner-occupied houses/condos
  • Cars and other vehicles available in Tisbury in owner-occupied houses/condos
  • 17no vehicle
  • 4071 vehicle
  • 4182 vehicles
  • 1183 vehicles
  • 964 vehicles
  • 95+ vehicles
Cars and other vehicles available in Tisbury in renter-occupied apartments
  • Cars and other vehicles available in Tisbury in renter-occupied apartments
  • 61no vehicle
  • 3061 vehicle
  • 1602 vehicles
  • 473 vehicles
  • 04 vehicles
  • 75+ vehicles
Owner-occupied Renter-occupied
Rooms in owner-occupied houses in Tisbury, Massachusetts
  • Rooms in owner-occupied houses in Tisbury, Massachusetts
  • 01 room
  • 282 rooms
  • 403 rooms
  • 914 rooms
  • 1975 rooms
  • 2876 rooms
  • 1647 rooms
  • 1328 rooms
  • 1269+ rooms
Rooms in renter-occupied apartments in Tisbury, Massachusetts
  • Rooms in renter-occupied apartments in Tisbury, Massachusetts
  • 91 room
  • 692 rooms
  • 1293 rooms
  • 1114 rooms
  • 925 rooms
  • 736 rooms
  • 547 rooms
  • 198 rooms
  • 259+ rooms
Year house built
Breakdown of mean house values by ages of householders
  • Tisbury, MA household income distribution

  • Distribution of median household income in Tisbury, MA in 2022
  • 80,338Less than $10,000
  • 98,762$10,000 to $19,999
  • 84,364$20,000 to $29,999
  • 83,740$30,000 to $39,999
  • 81,269$40,000 to $49,999
  • 75,432$50,000 to $59,999
  • 112,961$60,000 to $74,999
  • 168,028$75,000 to $99,999
  • 142,416$100,000 to $124,999
  • 118,376$125,000 to $149,999
  • 161,070$150,000 to $199,999
  • 279,357$200,000 or more

Percentage of workers working in this county: 102.7%
Number of people working at home: 402 (18.4% of all workers)

Travel time to work (commute)

  • Less than 5 minutes: 197
  • 5 to 9 minutes: 458
  • 10 to 14 minutes: 364
  • 15 to 19 minutes: 313
  • 20 to 24 minutes: 142
  • 25 to 29 minutes: 36
  • 30 to 34 minutes: 30
  • 35 to 39 minutes: 24
  • 40 to 44 minutes: 0
  • 45 to 59 minutes: 41
  • 60 to 89 minutes: 24
  • 90 or more minutes: 28

Means of transportation to work:

  • Drove a car alone: 1,290 (68.7%)
  • Carpooled: 107 (5.7%)
  • Bus or trolley bus: 22 (1.2%)
  • Ferryboat: 17 (0.9%)
  • Taxi: 13 (0.7%)
  • Motorcycle: 9 (0.5%)
  • Bicycle: 32 (1.7%)
  • Walked: 103 (5.5%)
  • Other means: 64 (3.4%)
  • Worked at home: 220 (11.7%)
Class of Workers in 2000
Year of entry for the foreign-born population in Tisbury, Massachusetts
  • Year of entry for the foreign-born population in Tisbury, Massachusetts
  • 811995 to March 2000
  • 441990 to 1994
  • 481985 to 1989
  • 301980 to 1984
  • 81975 to 1979
  • 01970 to 1974
  • 171965 to 1969
  • 26Before 1965
Ancestries in Tisbury, MA

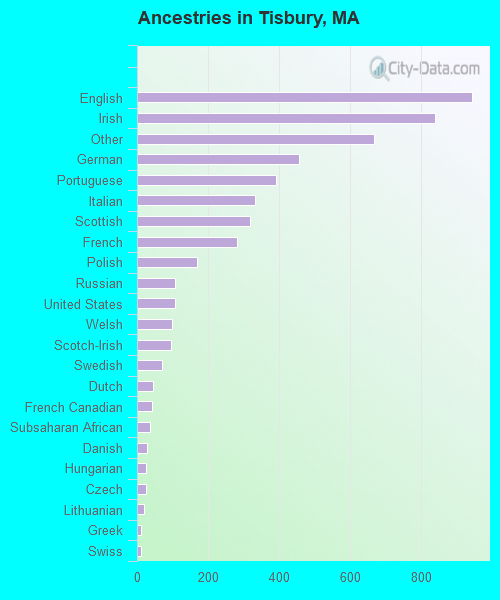
First ancestries reported:

  • English: 943 (18.4%)
  • Irish: 839 (16.4%)
  • Other: 666 (13.0%)
  • German: 456 (8.9%)
  • Portuguese: 390 (7.6%)
  • Italian: 331 (6.5%)
  • Scottish: 317 (6.2%)
  • French: 280 (5.5%)
  • Polish: 170 (3.3%)
  • Russian: 108 (2.1%)
  • United States: 107 (2.1%)
  • Welsh: 99 (1.9%)
  • Scotch-Irish: 95 (1.9%)
  • Swedish: 69 (1.3%)
  • Dutch: 44 (0.9%)
  • French Canadian: 43 (0.8%)
  • Subsaharan African: 36 (0.7%)
  • Danish: 28 (0.5%)
  • Hungarian: 25 (0.5%)
  • Czech: 24 (0.5%)
  • Lithuanian: 19 (0.4%)
  • Greek: 12 (0.2%)
  • Swiss: 12 (0.2%)

Most common places of birth for foreign-born residents (%):

Brazil
Tisbury:

37.0% (94)
Massachusetts:

4.7% (36,669)

Australia
Tisbury:

9.4% (24)
Massachusetts:

0.2% (1,855)

France
Tisbury:

7.9% (20)
Massachusetts:

0.8% (5,895)

Other Western Africa
Tisbury:

6.7% (17)
Massachusetts:

2.6% (20,299)

Portugal
Tisbury:

5.5% (14)
Massachusetts:

8.6% (66,627)

Mexico
Tisbury:

5.5% (14)
Massachusetts:

1.0% (7,867)

Ireland
Tisbury:

5.1% (13)
Massachusetts:

2.3% (17,987)

United Kingdom
Tisbury:

4.7% (12)
Massachusetts:

3.3% (25,403)

Nigeria
Tisbury:

3.5% (9)
Massachusetts:

0.4% (3,374)

Other Western Europe
Tisbury:

3.1% (8)
Massachusetts:

0.3% (2,642)

Israel
Tisbury:

3.1% (8)
Massachusetts:

0.4% (3,319)

Yugoslavia
Tisbury:

2.8% (7)
Massachusetts:

0.2% (1,273)

China, excluding Hong Kong and Taiwan
Tisbury:

2.4% (6)
Massachusetts:

5.1% (39,255)

Korea
Tisbury:

1.6% (4)
Massachusetts:

1.7% (13,456)

Canada
Tisbury:

1.6% (4)
Massachusetts:

5.2% (40,247)

Place of birth for U.S.-born residents:

  • This state: 1,868
  • Other state: 1,600
  • Northeast: 1,001
  • Midwest: 200
  • South: 222
  • West: 177

64% of Tisbury residents lived in the same house 5 years ago.
   Out of people who lived in different houses, 56% lived in this county.
   Out of people who lived in different counties, 28% lived in Massachusetts.

Education attainment for males 25 years and older:

  • No schooling: 8
  • Nursery to 4th grade: 0
  • 5th and 6th grade: 6
  • 7th and 8th grade: 25
  • 9th grade: 7
  • 10th grade: 13
  • 11th grade: 50
  • 12th grade, no diploma: 42
  • High school graduate (or equivalency): 330
  • Less than 1 year of college: 9
  • Some college more than 1 year, no degree: 284
  • Associate degree: 81
  • Bachelor's degree: 244
  • Master's degree: 73
  • Professional school degree: 12
  • Doctorate degree: 6
Educational Attainment for Males

Education attainment for females 25 years and older:

  • No schooling: 17
  • Nursery to 4th grade: 12
  • 5th and 6th grade: 0
  • 7th and 8th grade: 29
  • 9th grade: 17
  • 10th grade: 28
  • 11th grade: 8
  • 12th grade, no diploma: 38
  • High school graduate (or equivalency): 383
  • Less than 1 year of college: 66
  • Some college more than 1 year, no degree: 258
  • Associate degree: 107
  • Bachelor's degree: 347
  • Master's degree: 147
  • Professional school degree: 41
  • Doctorate degree: 35
Educational Attainment for Females
Tisbury marital status for males
Tisbury marital status for females

Housing units in structures:

  • One, detached: 2,261
  • One, attached: 69
  • Two: 119
  • 3 or 4: 156
  • 5 to 9: 100
  • 10 to 19: 7
  • Mobile homes: 8

Median worth of mobile homes: $1,393,727

Housing units lacking complete plumbing facilities: 0.3%

Housing units lacking complete kitchen facilities: 0.5%
Year householders moved into residence in Tisbury
Houses and condos Apartments
Most commonly used house heating fuel in houses and condos in Tisbury, MA
  • 54.3%Fuel oil, kerosene, etc.
  • 26.6%Bottled, tank, or LP gas
  • 12.5%Electricity
  • 6.1%Wood
  • 0.6%Solar energy
Most commonly used house heating fuel in apartments in Tisbury, MA
  • 44.9%Fuel oil, kerosene, etc.
  • 27.9%Bottled, tank, or LP gas
  • 22.9%Electricity
  • 3.4%Wood
  • 0.9%Utility gas

Private vs. public school enrollment:

Students in private schools in grades 1 to 8 (elementary and middle school): 23
Here:

6.9%
Massachusetts:

10.8%

Students in private schools in grades 9 to 12 (high school): 13
Here:

5.1%
Massachusetts:

12.2%

Students in private undergraduate colleges: 14
Here:

25.5%
Massachusetts:

48.2%
School Enrollment by Level of School for Male Students
School Enrollment by Level of School for Female Students
Age and Sex of Sensory-Disabled Noninstitutionalized Residents
Age and Sex of Physically-Disabled Noninstitutionalized Residents
Age and Sex of Mentally-Disabled Noninstitutionalized Residents
Age and Sex of Self-Care Disabled Noninstitutionalized Residents
Age and Sex of Go-Outside-Home Disabled Noninstitutionalized Residents
Age and Sex of Noninstitutionalized Residents with Employment Disability