Tiptonville, TN (Tennessee) Houses and Residents
| Tiptonville: | $133,872 |
| Tennessee: | $284,800 |
Mean price in 2022:
Detached houses: $165,566
Here: $165,566 State: $374,382 Mobile homes: $113,764
Here: $113,764 State: $101,421
Total population: 4,385 (Urban population: 0, Rural population: 2,441 (all nonfarm))
Houses: 1,165 (964 occupied: 386 owner occupied, 595 renter occupied)
| % of renters here: | 61% |
| State: | 33% |
Housing density: 814 houses/condos per square mile
Median price asked for vacant for-sale houses and condos in 2022 in this county: $84,056.
Median contract rent in 2022: $236 (lower quartile is $169, upper quartile is $454)
Median rent asked for vacant for-rent units in 2022: $351
Median gross rent in Tiptonville, TN in 2022: $406
Housing units in Tiptonville with a mortgage: 122 (0 second mortgage, 0 home equity loan, 0 both second mortgage and home equity loan)
Houses without a mortgage: 0
Median household income for houses/condos with a mortgage: $78,195
Median household income for apartments without a mortgage: $38,648
Median monthly housing costs: $452
Compare current foreclosures near Tiptonville, TN:
| Photo | Address | Area | Beds / Baths | Price | Details |
|---|---|---|---|---|---|

|
#1
Pigeon Roost Rd
Tiptonville, TN 38079
|
990 sq. feet
|
1 baths - beds |
show details | |

|
#2
Foster St
Tiptonville, TN 38079
|
1,216 sq. feet
|
1 baths - beds |
show details | |

|
#3
Mcbride St
Tiptonville, TN 38079
|
840 sq. feet
|
1 baths - beds |
show details | |

|
#4
Magnolia Harbor Ln
Tiptonville, TN 38079
|
1,008 sq. feet
|
1 baths - beds |
show details | |

|
#5
Faubus St
Tiptonville, TN 38079
|
1,026 sq. feet
|
1 baths - beds |
show details | |

|
#6
Poplar St
Tiptonville, TN 38079
|
1,624 sq. feet
|
1 baths - beds |
show details | |

|
#7
Tipton St
Tiptonville, TN 38079
|
864 sq. feet
|
1 baths - beds |
show details | |

|
#8
State Route 78 N
Tiptonville, TN 38079
|
- sq. feet
|
- baths - beds |
show details | |

|
#9
Lovell Rd
Tiptonville, TN 38079
|
- sq. feet
|
- baths - beds |
show details | |

|
#10
State Route 21 E
Tiptonville, TN 38079
|
- sq. feet
|
- baths - beds |
show details |
| Photo | Address | Area | Beds / Baths | Price | Details |
|---|---|---|---|---|---|

|
#11
Foster St
Tiptonville, TN 38079
|
- sq. feet
|
- baths - beds |
show details | |

|
#12
Lake St
Tiptonville, TN 38079
|
- sq. feet
|
- baths - beds |
show details | |

|
#13
Cates Landing Cir
Tiptonville, TN 38079
|
- sq. feet
|
- baths - beds |
show details | |

|
#14
Foster St
Tiptonville, TN 38079
|
- sq. feet
|
- baths - beds |
show details | |

|
#15
Cates St
Tiptonville, TN 38079
|
- sq. feet
|
- baths - beds |
show details | |

|
#16
State Route 212
Tiptonville, TN 38079
|
- sq. feet
|
- baths - beds |
show details | |

|
#17
E 9th St
Caruthersville, MO 63830
|
- sq. feet
|
2 baths 3 beds |
$14,900
|
show details |

|
#18
Riley Road Ext
Ridgely, TN 38080
|
1,598 sq. feet
|
2 baths 3 beds |
show details | |

|
#19
S Main St
Ridgely, TN 38080
|
838 sq. feet
|
1 baths 2 beds |
show details | |

|
#20
Glendale Rd
Newbern, TN 38059
|
- sq. feet
|
1 baths 2 beds |
show details |
| Photo | Address | Area | Beds / Baths | Price | Details |
|---|---|---|---|---|---|

|
#21
Yellow Hammer Rd
Troy, TN 38260
|
1,400 sq. feet
|
1 baths - beds |
show details | |

|
#22
Cloverdale Rd
Obion, TN 38240
|
2,204 sq. feet
|
2 baths - beds |
show details | |

|
#23
W Highway 21
Hornbeak, TN 38232
|
1,000 sq. feet
|
1 baths - beds |
show details | |

|
#24
Cash Dollar Rd
Obion, TN 38240
|
2,452 sq. feet
|
2 baths - beds |
show details | |

|
#25
Beaver Arm Rd
Ridgely, TN 38080
|
912 sq. feet
|
1 baths - beds |
show details | |

|
#26
Short St
Hornbeak, TN 38232
|
1,344 sq. feet
|
1 baths - beds |
show details | |

|
#27
Marvin Vaught Rd
Troy, TN 38260
|
1,366 sq. feet
|
1 baths - beds |
show details | |

|
#28
W Main St
Hornbeak, TN 38232
|
1,463 sq. feet
|
1 baths - beds |
show details | |

|
#29
Jackson Hill Rd
Hornbeak, TN 38232
|
2,400 sq. feet
|
2 baths - beds |
show details | |

|
#30
Ebenezer Rd
Troy, TN 38260
|
1,326 sq. feet
|
1 baths - beds |
show details |
| Photo | Address | Area | Beds / Baths | Price | Details |
|---|---|---|---|---|---|

|
#31
Kendall Rd
Hornbeak, TN 38232
|
1,180 sq. feet
|
1 baths - beds |
show details | |

|
#32
S Reelfoot Ave
Hornbeak, TN 38232
|
957 sq. feet
|
1 baths - beds |
show details | |

|
#33
1st St
Lilbourn, MO 63862
|
- sq. feet
|
- baths - beds |
show details | |

|
#34
Sequoyah Ave
New Madrid, MO 63869
|
- sq. feet
|
- baths - beds |
show details | |

|
#35
King Ave
Portageville, MO 63873
|
- sq. feet
|
- baths - beds |
show details | |

|
#36
Campground Rd
Troy, TN 38260
|
- sq. feet
|
- baths - beds |
show details | |

|
#37
Carleton Ave
Caruthersville, MO 63830
|
- sq. feet
|
- baths - beds |
show details | |

|
#38
Rear Missouri St
New Madrid, MO 63869
|
- sq. feet
|
- baths - beds |
show details | |

|
#39
Mott St
New Madrid, MO 63869
|
- sq. feet
|
- baths - beds |
show details | |

|
#40
S 2nd St
Lilbourn, MO 63862
|
- sq. feet
|
- baths - beds |
show details |
| Photo | Address | Area | Beds / Baths | Price | Details |
|---|---|---|---|---|---|

|
#41
Ira Barker Rd
Obion, TN 38240
|
- sq. feet
|
- baths - beds |
show details | |

|
#42
Luther Davis Rd
Hornbeak, TN 38232
|
- sq. feet
|
- baths - beds |
show details | |

|
#43
Cat Corner Rd
Obion, TN 38240
|
- sq. feet
|
- baths - beds |
show details | |

|
#44
Glass Rd
Obion, TN 38240
|
1,512 sq. feet
|
- baths - beds |
show details | |

|
#45
Marvin Vaught Rd
Troy, TN 38260
|
- sq. feet
|
- baths - beds |
show details | |

|
#46
Willow Rd
Portageville, MO 63873
|
- sq. feet
|
- baths - beds |
show details | |

|
#47
Treece Rd
Hornbeak, TN 38232
|
924 sq. feet
|
- baths - beds |
show details | |

|
#48
Webb Store Rd
Hornbeak, TN 38232
|
- sq. feet
|
- baths - beds |
show details | |

|
#49
Bedford Forrest Ln # A
Ridgely, TN 38080
|
- sq. feet
|
- baths - beds |
show details | |

|
Check over 1 million property listings on Foreclosure.com!
|
browse all offers | |||

Latest news about housing in Tiptonville, TN collected exclusively by city-data.com from local newspapers, TV, and radio stations

 | Tennessee's 2020 Census results (74 replies) |
| Want to start fresh in a small town...Suggestions? (29 replies) |
| what part of tenn. for a new jersey family? (19 replies) |
| Day trip must see/do in West TN? (3 replies) |
| Obion, TN (12 replies) |
| Getting Too Crowded In Your Town? (26 replies) |

Median year apartment built: 1981
Household type by relationship:
Households: 3,902- Male householders: 329 (212 living alone), Female householders: 623 (279 living alone)
241 spouses (241 opposite-sex spouses), 62 unmarried partners, (62 opposite-sex unmarried partners), 279 children (279 natural, 0 adopted, 0 stepchildren), 26 grandchildren, 16 brothers or sisters, 8 parents, 0 foster children, 23 other relatives, 51 non-relatives
- In group quarters: 2,240
Size of family households: 229 2-persons, 117 3-persons, 28 4-persons.
Size of nonfamily households: 500 1-person, 81 2-persons, 21 3-persons.
85 married couples with children.
106 single-parent households (26 men, 80 women).
96.2% of residents of Tiptonville speak English at home.
3.3% of residents speak Spanish at home (48% speak English very well, 15% speak English well, 30% speak English not well, 7% don't speak English at all).
0.3% of residents speak Asian or Pacific Island language at home (100% speak English very well).
Foreign born population: 90 (2.3%)
(25.6% of them are naturalized citizens)
| Here: | 6.1 |
| State: | 6.5 |
| Here: | 4.0 |
| State: | 4.4 |

- Bedrooms in owner-occupied houses and condos in Tiptonville, Tennessee
- 0no bedroom
- 01 bedroom
- 1252 bedrooms
- 1733 bedrooms
- 884 bedrooms
- 05+ bedrooms

- Bedrooms in renter-occupied apartments in Tiptonville, Tennessee
- 8no bedroom
- 2281 bedroom
- 1592 bedrooms
- 1783 bedrooms
- 224 bedrooms
- 05+ bedrooms

- Cars and other vehicles available in Tiptonville in owner-occupied houses/condos
- 9no vehicle
- 1401 vehicle
- 1582 vehicles
- 493 vehicles
- 294 vehicles
- 05+ vehicles

- Cars and other vehicles available in Tiptonville in renter-occupied apartments
- 183no vehicle
- 3181 vehicle
- 732 vehicles
- 03 vehicles
- 04 vehicles
- 225+ vehicles

- Rooms in owner-occupied houses in Tiptonville, Tennessee
- 01 room
- 02 rooms
- 223 rooms
- 864 rooms
- 425 rooms
- 686 rooms
- 1087 rooms
- 88 rooms
- 519+ rooms

- Rooms in renter-occupied apartments in Tiptonville, Tennessee
- 81 room
- 192 rooms
- 1543 rooms
- 1814 rooms
- 1105 rooms
- 776 rooms
- 157 rooms
- 18 rooms
- 309+ rooms


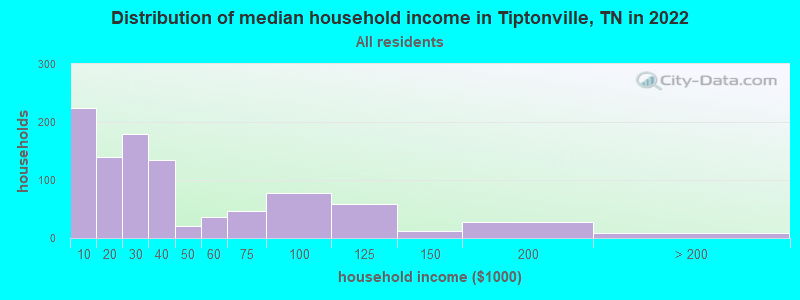
Tiptonville, TN household income distribution

- 225Less than $10,000
- 139$10,000 to $19,999
- 180$20,000 to $29,999
- 135$30,000 to $39,999
- 21$40,000 to $49,999
- 36$50,000 to $59,999
- 47$60,000 to $74,999
- 77$75,000 to $99,999
- 58$100,000 to $124,999
- 12$125,000 to $149,999
- 28$150,000 to $199,999
- 9$200,000 or more
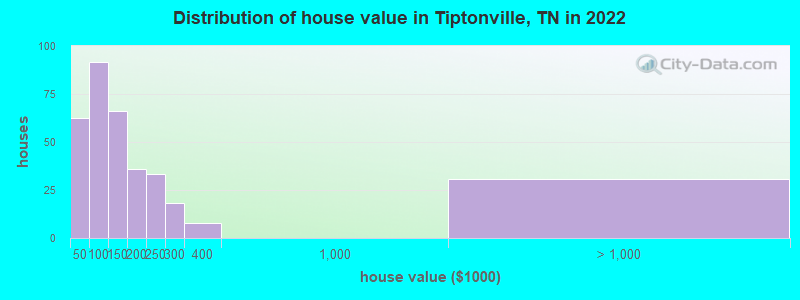
Home value of owner - occupied houses in 2022 in Tiptonville, TN
-
- 13$10,000 to $14,999
- 23$35,000 to $39,999
- 25$40,000 to $49,999
- 1$50,000 to $59,999
- 2$60,000 to $69,999
- 6$70,000 to $79,999
- 45$80,000 to $89,999
- 9$90,000 to $99,999
- 55$100,000 to $124,999
- 10$125,000 to $149,999
- 20$150,000 to $174,999
- 15$175,000 to $199,999
- 33$200,000 to $249,999
- 18$250,000 to $299,999
- 7$300,000 to $399,999
- 30$1,000,000 to $1,499,999
Rent paid by renters in 2022 in Tiptonville, TN
-
- 53Less than $100
- 31$100 to $149
- 141$150 to $199
- 59$200 to $249
- 17$250 to $299
- 44$300 to $349
- 7$350 to $399
- 74$400 to $449
- 24$450 to $499
- 4$500 to $549
- 13$550 to $599
- 7$600 to $649
- 10$1,250 to $1,499
- 27$1,500 to $1,999
- 62No cash rent

Percentage of workers working in this county: 50.0%
Number of people working at home: 12 (1.9% of all workers)
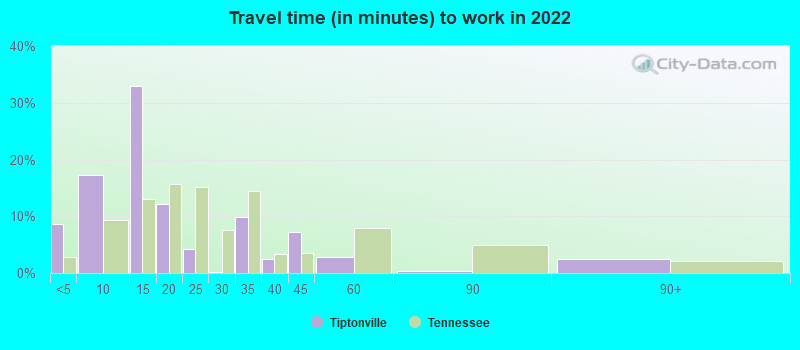
Travel time to work (commute)
- Less than 5 minutes: 62
- 5 to 9 minutes: 136
- 10 to 14 minutes: 89
- 15 to 19 minutes: 0
- 20 to 24 minutes: 0
- 25 to 29 minutes: 0
- 30 to 34 minutes: 114
- 35 to 39 minutes: 59
- 40 to 44 minutes: 18
- 45 to 59 minutes: 126
- 60 to 89 minutes: 8
- 90 or more minutes: 0
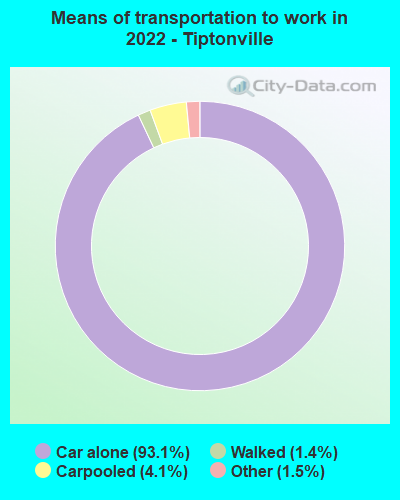
Means of transportation to work:
- Drove a car alone: 755 (87.7%)
- Carpooled: 34 (3.9%)
- Taxi: 14 (1.6%)
- Walked: 11 (1.3%)
- Worked at home: 12 (1.4%)
- Unemployment by race in 2022
- Unemployment rate for White non-Hispanic residents
- 16.8%Females
- Unemployment rate for Black residents
- 11.2%Males
- 11.1%Females

- Year of entry for the foreign-born population in Tiptonville, Tennessee
- 252010 or later
- 132000 to 2009
- 431990 to 1999
- 01980 to 1989
- 01970 to 1979
- 0Before 1970
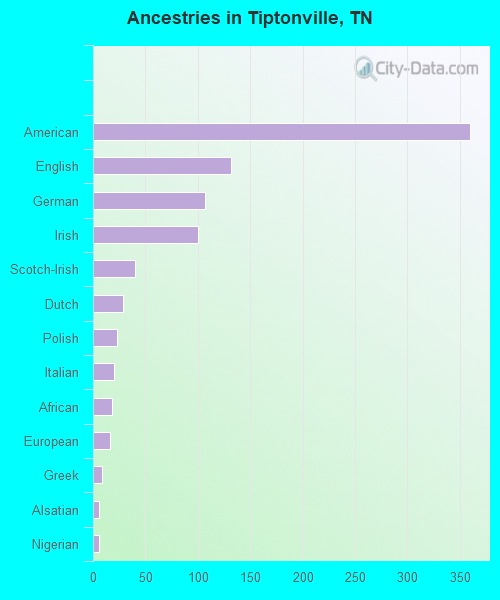
First ancestries reported:
- American: 360 (16.2%)
- English: 132 (5.9%)
- German: 107 (4.8%)
- Irish: 100 (4.5%)
- Scotch-Irish: 40 (1.8%)
- Dutch: 29 (1.3%)
- Polish: 23 (1.0%)
- Italian: 20 (0.9%)
- African: 18 (0.8%)
- European: 16 (0.7%)
- Greek: 9 (0.4%)
- Alsatian: 6 (0.3%)
- Nigerian: 6 (0.3%)
Most common places of birth for foreign-born residents (%):
| Tiptonville: | 36.7% (33) |
| Tennessee: | 23.0% (86,435) |
| Tiptonville: | 18.9% (17) |
| Tennessee: | 4.6% (17,433) |
| Tiptonville: | 11.1% (10) |
| Tennessee: | 2.2% (8,261) |
| Tiptonville: | 7.8% (7) |
| Tennessee: | 3.1% (11,640) |
| Tiptonville: | 6.7% (6) |
| Tennessee: | 1.2% (4,587) |
| Tiptonville: | 6.7% (6) |
| Tennessee: | 0.9% (3,225) |
| Tiptonville: | 4.4% (4) |
| Tennessee: | 1.1% (4,233) |
Place of birth for U.S.-born residents:
- This state: 2,679
- Other state: 1,093
- Northeast: 60
- Midwest: 447
- South: 509
- West: 64
74.6% of Tiptonville residents lived in the same house 1 years ago.
Out of people who lived in different houses, 12.1% lived in this county.
Out of people who lived in different counties, 89.3% lived in Tennessee.
| Tiptonville: | 74.6% |
| State average: | 87.0% |
Education attainment for males 25 years and older:
- No schooling: 50
- Nursery to 4th grade: 0
- 5th and 6th grade: 16
- 7th and 8th grade: 54
- 9th grade: 49
- 10th grade: 92
- 11th grade: 193
- 12th grade, no diploma: 97
- High school graduate (or equivalency): 1,250
- Less than 1 year of college: 66
- Some college more than 1 year, no degree: 329
- Associate degree: 72
- Bachelor's degree: 126
- Master's degree: 74
- Professional school degree: 0
- Doctorate degree: 11

Education attainment for females 25 years and older:
- No schooling: 26
- Nursery to 4th grade: 6
- 5th and 6th grade: 6
- 7th and 8th grade: 7
- 9th grade: 16
- 10th grade: 73
- 11th grade: 45
- 12th grade, no diploma: 43
- High school graduate (or equivalency): 152
- Less than 1 year of college: 78
- Some college more than 1 year, no degree: 104
- Associate degree: 58
- Bachelor's degree: 87
- Master's degree: 32
- Professional school degree: 0
- Doctorate degree: 0


Housing units in structures:
- One, detached: 698
- One, attached: 7
- Two: 74
- 3 or 4: 74
- 5 to 9: 149
- 10 to 19: 59
- 20 to 49: 88
- 50 or more: 6
- Mobile homes: 5
- Boats, RVs, vans, etc.: 2
Housing units lacking complete kitchen facilities in 2022: 3.2%
House/condo owner moved in on average 18 years ago
Renter moved in on average 6 years ago

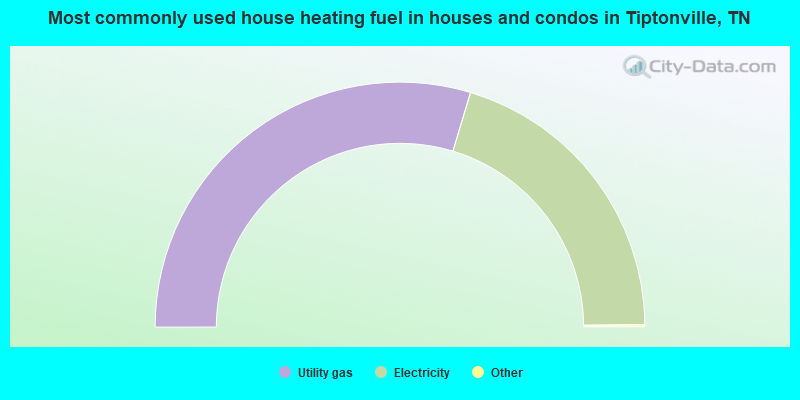
- 59.5%Utility gas
- 40.5%Electricity
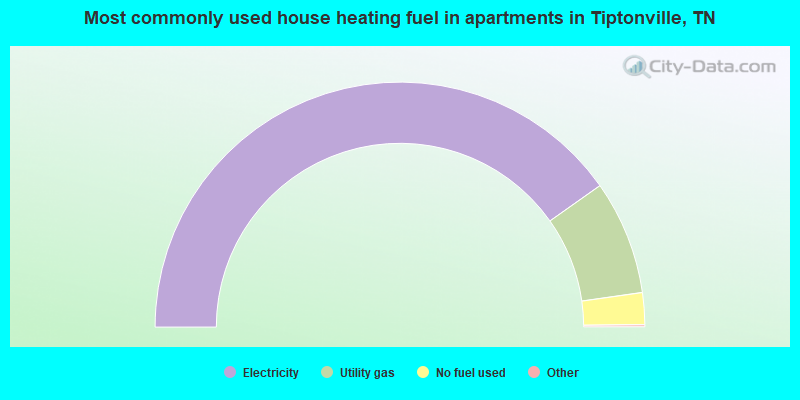
- 80.6%Electricity
- 15.1%Utility gas
- 4.2%No fuel used
Private vs. public school enrollment:
| Here: | 3.1% |
| Tennessee: | 15.0% |
| Here: | 45.3% |
| Tennessee: | 16.2% |
| Here: | 37.5% |
| Tennessee: | 23.5% |


