Tiki Island, TX (Texas) Houses and Residents
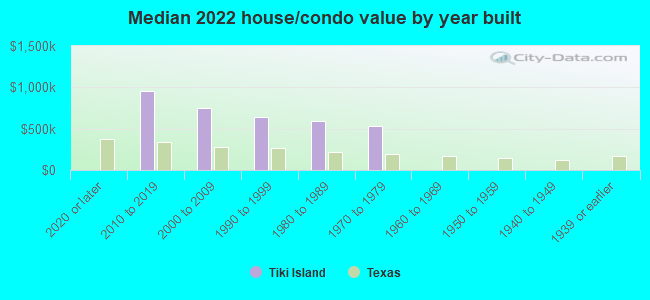
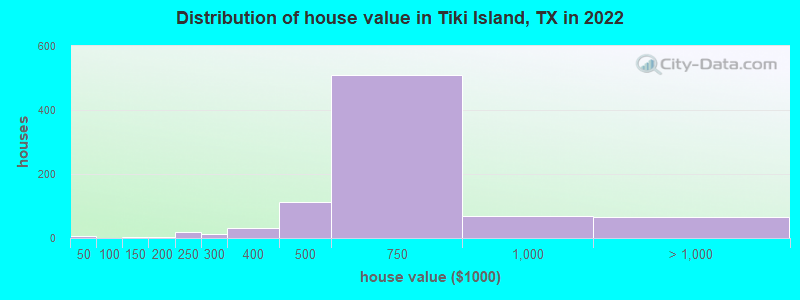
| Tiki Island: | $684,373 |
| Texas: | $275,400 |
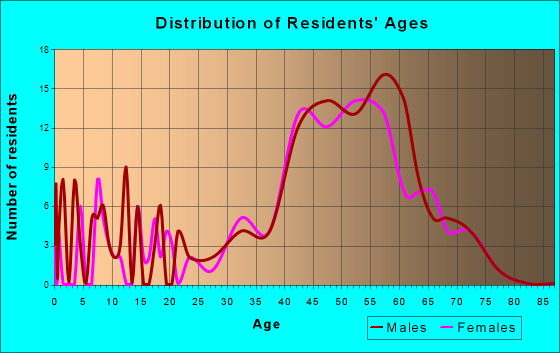
Total population: 1,007 (All urban)
Houses: 1,223 (725 occupied: 615 owner occupied, 130 renter occupied)
| % of renters here: | 17% |
| State: | 38% |
Housing density: 1,887 houses/condos per square mile
Median price asked for vacant for-sale houses and condos in 2022: $724,140.
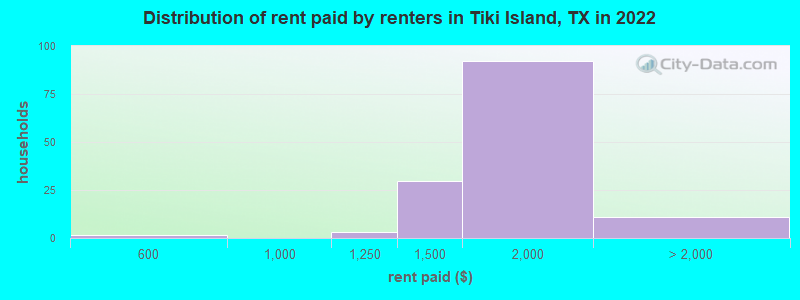
Median contract rent in 2022: $1,708 (lower quartile is $1,530, upper quartile is $1,876)
Median rent asked for vacant for-rent units in 2022: $3,327
Median gross rent in Tiki Island, TX in 2022: $1,814
Housing units in Tiki Island with a mortgage: 305 (41 second mortgage, 0 home equity loan, 16 both second mortgage and home equity loan)
Houses without a mortgage: 10
Median household income for houses/condos with a mortgage: $222,984
Median household income for apartments without a mortgage: $88,471
Median monthly housing costs: $1,992
Compare current foreclosures near Tiki Island, TX:
| Photo | Address | Area | Beds / Baths | Price | Details |
|---|---|---|---|---|---|

|
#1
11th St N
Texas City, TX 77590
|
2,625 sq. feet
|
3 baths 4 beds |
$449,900
|
show details |

|
#2
Wincrest
Dickinson, TX 77539
|
3,450 sq. feet
|
3 baths 4 beds |
$699,900
|
show details |

|
#3
Crystal Cascade Ln
League City, TX 77573
|
2,329 sq. feet
|
2 baths 4 beds |
show details | |

|
#4
Ruby Dr
Texas City, TX 77591
|
- sq. feet
|
2 baths 4 beds |
show details | |

|
#5
32nd Ave N
Texas City, TX 77591
|
1,520 sq. feet
|
2 baths 3 beds |
show details | |

|
#6
34th Ave N
Texas City, TX 77591
|
- sq. feet
|
3 baths 4 beds |
show details | |

|
#7
Santa Fe Trl
Santa Fe, TX 77510
|
1,356 sq. feet
|
2 baths 3 beds |
show details | |

|
#8
16th Ave N
Texas City, TX 77590
|
1,905 sq. feet
|
2 baths 4 beds |
show details | |

|
#9
Edwards Dr
Dickinson, TX 77539
|
1,424 sq. feet
|
3 baths 4 beds |
show details | |

|
#10
Overland Trl
Dickinson, TX 77539
|
1,171 sq. feet
|
2 baths 3 beds |
show details |
| Photo | Address | Area | Beds / Baths | Price | Details |
|---|---|---|---|---|---|

|
#11
Fm 646 Rd N
Dickinson, TX 77539
|
- sq. feet
|
3 baths 4 beds |
show details | |

|
#12
Blimp Base Road
Hitchcock, TX 77563
|
- sq. feet
|
2 baths 4 beds |
show details | |

|
#13
Ora Lee St
Hitchcock, TX 77563
|
1,380 sq. feet
|
2 baths 3 beds |
show details | |

|
#14
Oleander Ave
Texas City, TX 77590
|
- sq. feet
|
2 baths 3 beds |
show details | |

|
#15
Mammoth Springs Ln
Dickinson, TX 77539
|
1,915 sq. feet
|
2 baths 3 beds |
show details | |

|
#16
Lake Landing Dr
League City, TX 77573
|
7,959 sq. feet
|
5 baths 7 beds |
show details | |

|
#17
Cambria Ct
League City, TX 77573
|
3,251 sq. feet
|
3 baths 4 beds |
show details | |

|
#18
7th Ave N
Texas City, TX 77590
|
1,596 sq. feet
|
2 baths 3 beds |
show details | |

|
#19
Little St
La Marque, TX 77568
|
1,265 sq. feet
|
1 baths 3 beds |
show details | |

|
#20
23rd St
Santa Fe, TX 77510
|
1,360 sq. feet
|
2 baths - beds |
show details |
| Photo | Address | Area | Beds / Baths | Price | Details |
|---|---|---|---|---|---|

|
#21
Buttonwood Dr
Texas City, TX 77591
|
2,208 sq. feet
|
2 baths - beds |
show details | |

|
#22
Dollar Reef Dr
Bacliff, TX 77518
|
1,755 sq. feet
|
1 baths - beds |
show details | |

|
#23
Bayou Crest Cir
Dickinson, TX 77539
|
2,422 sq. feet
|
3 baths - beds |
show details | |

|
#24
Pointe Drive
League City, TX 77573
|
1,553 sq. feet
|
2 baths - beds |
show details | |

|
#25
Cecina St
League City, TX 77573
|
1,591 sq. feet
|
2 baths 2 beds |
show details | |

|
#26
Henckel Dr
Hitchcock, TX 77563
|
668 sq. feet
|
1 baths - beds |
show details | |

|
#27
Quayside Dr
Galveston, TX 77554
|
2,139 sq. feet
|
4 baths 3 beds |
show details | |

|
#28
N Martin Luther King Ave
Hitchcock, TX 77563
|
1,444 sq. feet
|
2 baths - beds |
show details | |

|
#29
Arbor Hollow Ln
Dickinson, TX 77539
|
1,373 sq. feet
|
2 baths - beds |
show details | |

|
#30
Pompano St
Hitchcock, TX 77563
|
936 sq. feet
|
1 baths - beds |
show details |
| Photo | Address | Area | Beds / Baths | Price | Details |
|---|---|---|---|---|---|

|
#31
Laurel Meadow Ct
La Marque, TX 77568
|
1,769 sq. feet
|
2 baths - beds |
show details | |

|
#32
Blue Bonnet Dr
Texas City, TX 77591
|
1,653 sq. feet
|
2 baths - beds |
show details | |

|
#33
Texas St
Hitchcock, TX 77563
|
1,098 sq. feet
|
1 baths - beds |
show details | |

|
#34
Avenue H
Dickinson, TX 77539
|
1,402 sq. feet
|
1 baths - beds |
show details | |

|
#35
Capella Oaks Ln
Dickinson, TX 77539
|
1,433 sq. feet
|
2 baths - beds |
show details | |

|
#36
Colony Creek Dr
Dickinson, TX 77539
|
2,328 sq. feet
|
2 baths - beds |
show details | |

|
#37
Quintana Dr
Galveston, TX 77554
|
2,033 sq. feet
|
2 baths - beds |
show details | |

|
#38
Ridgewood Ln
Dickinson, TX 77539
|
2,121 sq. feet
|
2 baths - beds |
show details | |

|
#39
Chase Land Cir
Bacliff, TX 77518
|
1,854 sq. feet
|
2 baths - beds |
show details | |

|
#40
Naples Terrace Ln
La Marque, TX 77568
|
2,431 sq. feet
|
2 baths - beds |
show details |
| Photo | Address | Area | Beds / Baths | Price | Details |
|---|---|---|---|---|---|

|
#41
Post Office St Apt 210
Galveston, TX 77550
|
1,079 sq. feet
|
9 baths - beds |
show details | |

|
#42
Laurelmist Ln
La Marque, TX 77568
|
2,682 sq. feet
|
2 baths - beds |
show details | |

|
#43
Laurelmist Ln
La Marque, TX 77568
|
2,641 sq. feet
|
3 baths - beds |
show details | |

|
#44
River Ridge Ln
Dickinson, TX 77539
|
1,723 sq. feet
|
2 baths - beds |
show details | |

|
#45
Mallard St
Hitchcock, TX 77563
|
640 sq. feet
|
1 baths - beds |
show details | |

|
#46
Avenue L
Galveston, TX 77550
|
1,052 sq. feet
|
1 baths - beds |
show details | |

|
#47
Robin St # 7314
Texas City, TX 77591
|
1,444 sq. feet
|
2 baths - beds |
show details | |

|
#48
Shady Ln
La Marque, TX 77568
|
1,384 sq. feet
|
2 baths - beds |
show details | |

|
#49
Sylvia Dr
Galveston, TX 77551
|
728 sq. feet
|
1 baths - beds |
show details | |

|
Check over 1 million property listings on Foreclosure.com!
|
browse all offers | |||


 | Palm at Cove View Condos Galveston (2 replies) |
| which is the nicest galveston beach (115 replies) |
| Exploring Houston to make a more definitive decision about re-locating (21 replies) |
| Spitballing ideas of where to live if I came to TX (20 replies) |
| Bayou Vista, TX (7 replies) |
| Austin Summers (37 replies) |
Median year apartment built: 1997
Household type by relationship:
Households: 1,217- Male householders: 465 (221 living alone), Female householders: 249 (90 living alone)
358 spouses (353 opposite-sex spouses), 19 unmarried partners, (19 opposite-sex unmarried partners), 114 children (114 natural, 0 adopted, 0 stepchildren), 6 grandchildren, 2 brothers or sisters, 0 parents, 0 foster children, 0 other relatives, 3 non-relatives
Size of family households: 349 2-persons, 38 3-persons, 25 4-persons.
Size of nonfamily households: 321 1-person, 15 2-persons.
47 married couples with children.
9 single-parent households (9 men, 0 women).
93.0% of residents of Tiki Island speak English at home.
1.2% of residents speak Spanish at home (100% speak English very well).
1.1% of residents speak other Indo-European language at home (36% speak English very well, 64% speak English well).
5.2% of residents speak Asian or Pacific Island language at home (100% speak English very well).
Foreign born population: 156 (12.8%)
(51.9% of them are naturalized citizens)
| Here: | 5.7 |
| State: | 6.3 |
| Here: | 3.2 |
| State: | 4.0 |
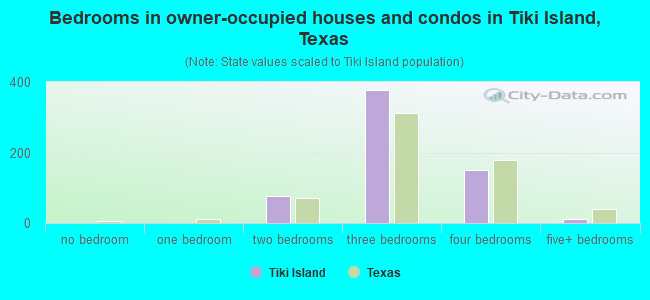
- Bedrooms in owner-occupied houses and condos in Tiki Island, Texas
- 0no bedroom
- 01 bedroom
- 762 bedrooms
- 3783 bedrooms
- 1494 bedrooms
- 125+ bedrooms
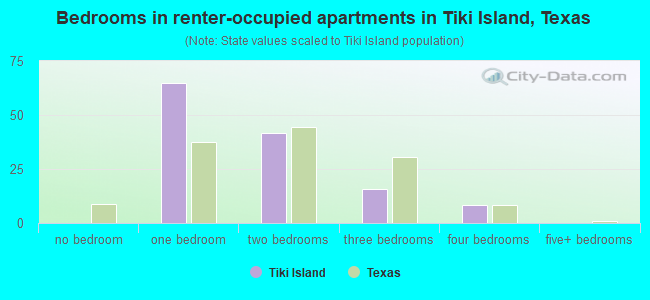
- Bedrooms in renter-occupied apartments in Tiki Island, Texas
- 0no bedroom
- 651 bedroom
- 412 bedrooms
- 163 bedrooms
- 84 bedrooms
- 05+ bedrooms
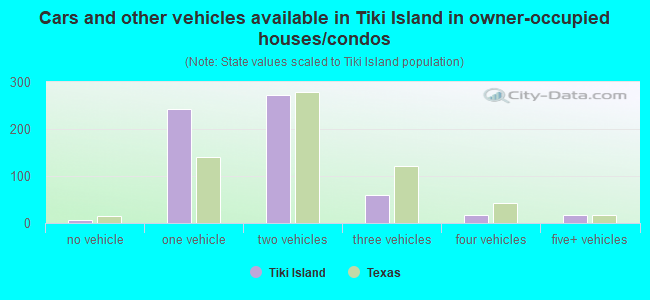
- Cars and other vehicles available in Tiki Island in owner-occupied houses/condos
- 7no vehicle
- 2421 vehicle
- 2732 vehicles
- 593 vehicles
- 164 vehicles
- 175+ vehicles
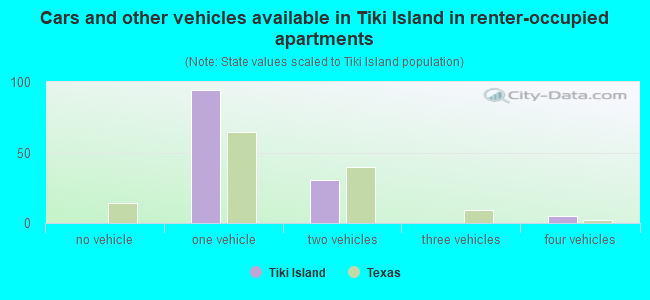
- Cars and other vehicles available in Tiki Island in renter-occupied apartments
- 0no vehicle
- 951 vehicle
- 312 vehicles
- 03 vehicles
- 54 vehicles
- 05+ vehicles
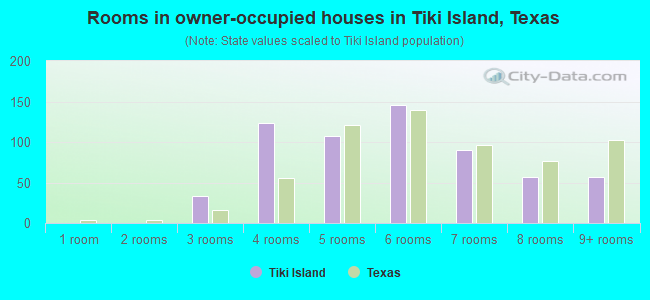
- Rooms in owner-occupied houses in Tiki Island, Texas
- 01 room
- 02 rooms
- 333 rooms
- 1244 rooms
- 1075 rooms
- 1466 rooms
- 907 rooms
- 578 rooms
- 579+ rooms
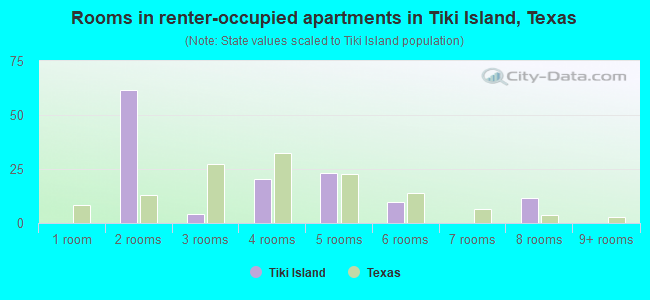
- Rooms in renter-occupied apartments in Tiki Island, Texas
- 01 room
- 622 rooms
- 43 rooms
- 204 rooms
- 235 rooms
- 106 rooms
- 07 rooms
- 128 rooms
- 09+ rooms
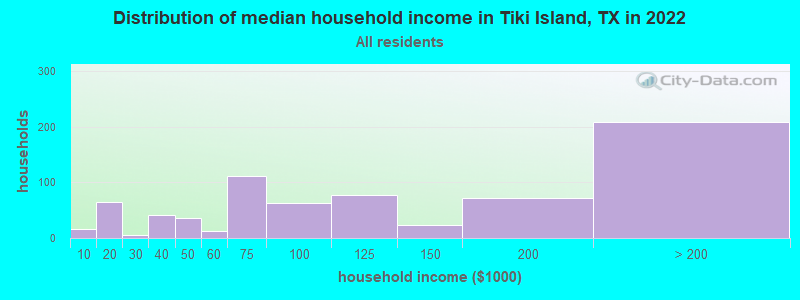
Tiki Island, TX household income distribution

- 17Less than $10,000
- 64$10,000 to $19,999
- 6$20,000 to $29,999
- 41$30,000 to $39,999
- 36$40,000 to $49,999
- 13$50,000 to $59,999
- 112$60,000 to $74,999
- 63$75,000 to $99,999
- 78$100,000 to $124,999
- 24$125,000 to $149,999
- 72$150,000 to $199,999
- 209$200,000 or more
Home value of owner - occupied houses in 2022 in Tiki Island, TX
-
- 4Less than $10,000
- 2$100,000 to $124,999
- 2$175,000 to $199,999
- 18$200,000 to $249,999
- 11$250,000 to $299,999
- 30$300,000 to $399,999
- 113$400,000 to $499,999
- 507$500,000 to $749,999
- 67$750,000 to $999,999
- 60$1,000,000 to $1,499,999
- 3$1,500,000 to $1,999,999
- 2$2,000,000 or more
Rent paid by renters in 2022 in Tiki Island, TX
-
- 1$550 to $599
- 3$1,000 to $1,249
- 29$1,250 to $1,499
- 92$1,500 to $1,999
- 3$2,000 to $2,499
- 2$2,500 to $2,999
- 5No cash rent
Percentage of workers working in this county: 55.4%
Number of people working at home: 163 (22.5% of all workers)
Travel time to work (commute)
- Less than 5 minutes: 0
- 5 to 9 minutes: 38
- 10 to 14 minutes: 40
- 15 to 19 minutes: 105
- 20 to 24 minutes: 39
- 25 to 29 minutes: 19
- 30 to 34 minutes: 36
- 35 to 39 minutes: 24
- 40 to 44 minutes: 22
- 45 to 59 minutes: 129
- 60 to 89 minutes: 97
- 90 or more minutes: 30
Means of transportation to work:
- Drove a car alone: 526 (85.4%)
- Carpooled: 53 (8.6%)
- Walked: 2 (0.3%)
- Other means: 13 (2.1%)
- Worked at home: 22 (3.6%)
- Unemployment by race in 2022
- Unemployment rate for White non-Hispanic residents
- 3.2%Males
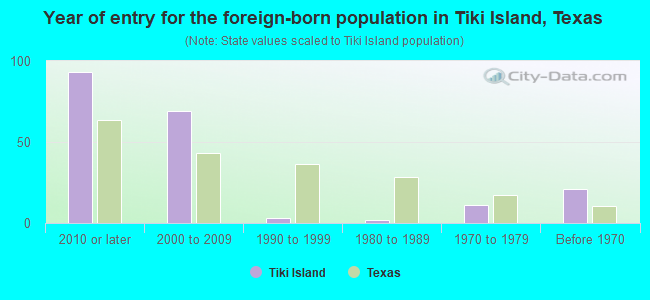
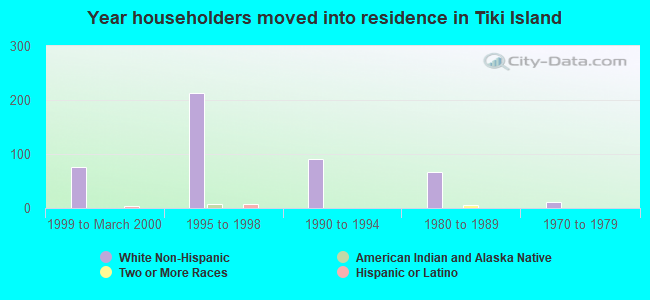
- Year of entry for the foreign-born population in Tiki Island, Texas
- 932010 or later
- 692000 to 2009
- 31990 to 1999
- 21980 to 1989
- 111970 to 1979
- 21Before 1970
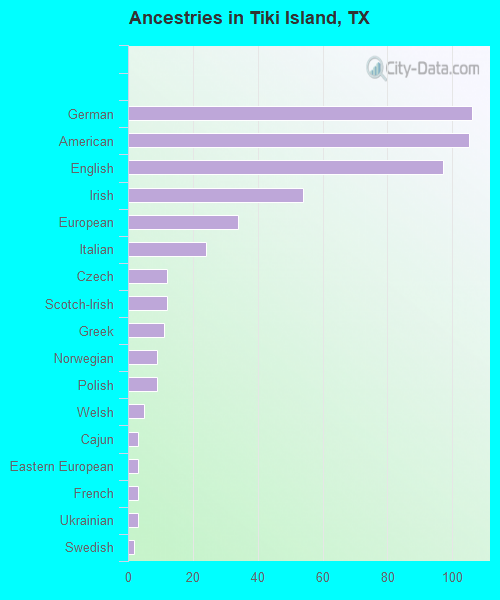
First ancestries reported:
- German: 106 (15.6%)
- American: 105 (15.5%)
- English: 97 (14.3%)
- Irish: 54 (8.0%)
- European: 34 (5.0%)
- Italian: 24 (3.5%)
- Czech: 12 (1.8%)
- Scotch-Irish: 12 (1.8%)
- Greek: 11 (1.6%)
- Norwegian: 9 (1.3%)
- Polish: 9 (1.3%)
- Welsh: 5 (0.7%)
- Cajun: 3 (0.4%)
- Eastern European: 3 (0.4%)
- French: 3 (0.4%)
- Ukrainian: 3 (0.4%)
- Swedish: 2 (0.3%)
Most common places of birth for foreign-born residents (%):
| Tiki Island: | 42.4% (61) |
| Texas: | 0.4% (17,796) |
| Tiki Island: | 41.7% (60) |
| Texas: | 6.1% (306,347) |
| Tiki Island: | 3.5% (5) |
| Texas: | 1.2% (60,172) |
| Tiki Island: | 2.8% (4) |
| Texas: | 0.2% (8,866) |
| Tiki Island: | 2.8% (4) |
| Texas: | 0.2% (9,664) |
| Tiki Island: | 2.1% (3) |
| Texas: | 0.1% (4,334) |
| Tiki Island: | 2.1% (3) |
| Texas: | 0.2% (7,897) |
Place of birth for U.S.-born residents:
- This state: 583
- Other state: 466
- Northeast: 109
- Midwest: 164
- South: 124
- West: 71
90.3% of Tiki Island residents lived in the same house 1 years ago.
Out of people who lived in different houses, 16.4% lived in this county.
Out of people who lived in different counties, 43.6% lived in Texas.
| Tiki Island: | 90.3% |
| State average: | 85.7% |
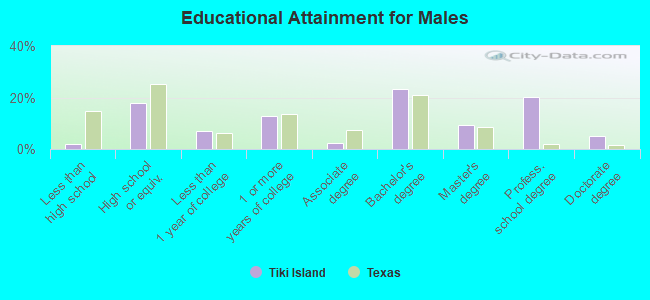
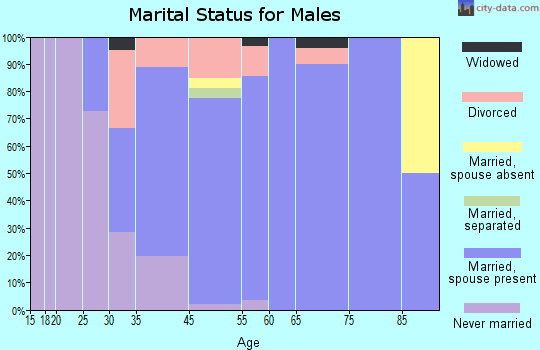
Education attainment for males 25 years and older:
- No schooling: 0
- Nursery to 4th grade: 0
- 5th and 6th grade: 0
- 7th and 8th grade: 0
- 9th grade: 0
- 10th grade: 3
- 11th grade: 9
- 12th grade, no diploma: 0
- High school graduate (or equivalency): 117
- Less than 1 year of college: 46
- Some college more than 1 year, no degree: 85
- Associate degree: 16
- Bachelor's degree: 153
- Master's degree: 60
- Professional school degree: 133
- Doctorate degree: 32
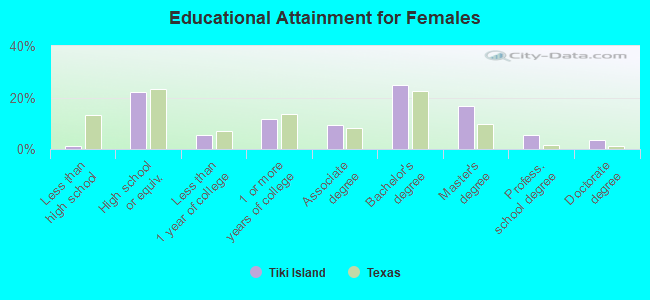
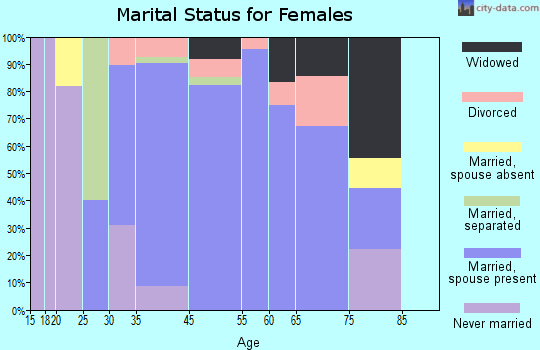
Education attainment for females 25 years and older:
- No schooling: 0
- Nursery to 4th grade: 0
- 5th and 6th grade: 0
- 7th and 8th grade: 0
- 9th grade: 3
- 10th grade: 0
- 11th grade: 3
- 12th grade, no diploma: 0
- High school graduate (or equivalency): 104
- Less than 1 year of college: 25
- Some college more than 1 year, no degree: 56
- Associate degree: 45
- Bachelor's degree: 117
- Master's degree: 79
- Professional school degree: 25
- Doctorate degree: 16
Housing units in structures:
- One, detached: 1,108
- One, attached: 5
- Two: 3
- 3 or 4: 4
- 5 to 9: 10
- 10 to 19: 18
- 20 to 49: 73
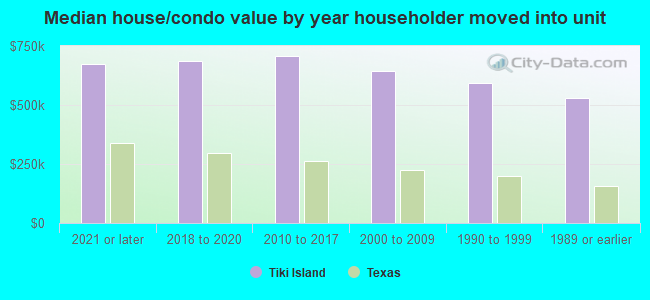
House/condo owner moved in on average 11 years ago
Renter moved in on average 3 years ago
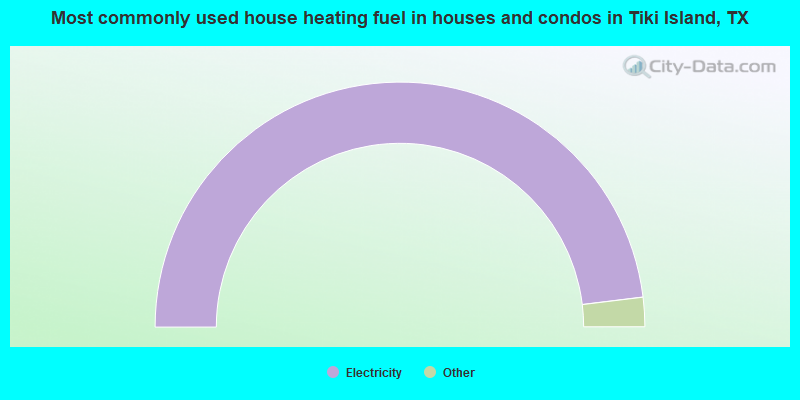
- 96.2%Electricity
- 2.8%Bottled, tank, or LP gas
- 0.7%No fuel used
- 0.3%Utility gas
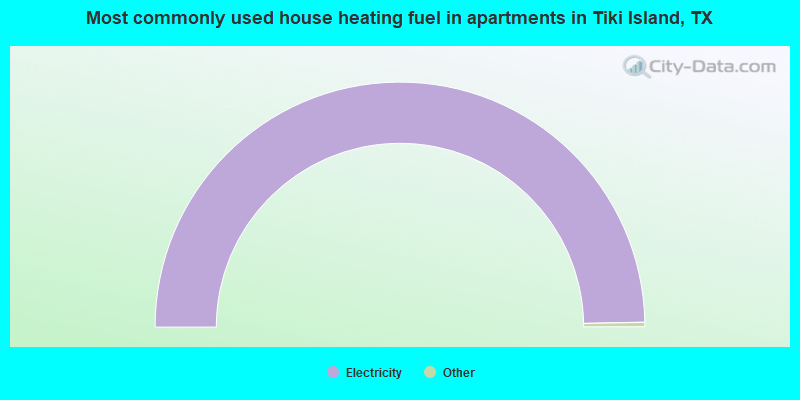
- 100.0%Electricity
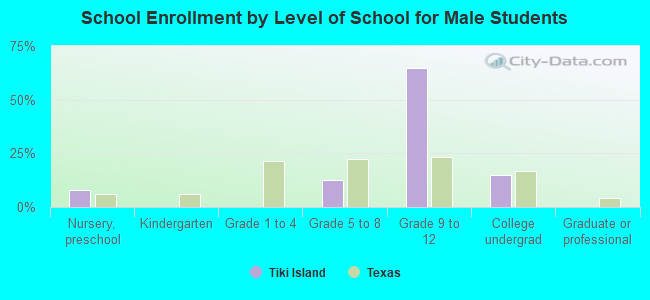
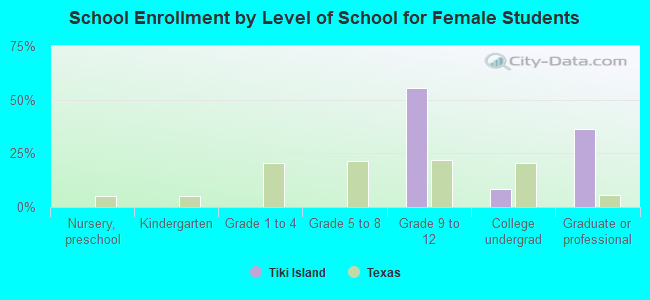
Private vs. public school enrollment:
| Here: | 100.0% |
| Texas: | 8.8% |
| Here: | 45.1% |
| Texas: | 8.0% |
| Here: | 42.9% |
| Texas: | 16.2% |