Tiger Valley, TN (Tennessee) Houses and Residents
| Tiger Valley: | $140,932 |
| Tennessee: | $284,800 |
Total population: 6,033 (Urban population: 1,843, Rural population: 3,990 (99 farm, 3,891 nonfarm))
Houses: 2,710 (2,451 occupied: 1,997 owner occupied, 454 renter occupied)
| % of renters here: | 19% |
| State: | 33% |
Housing density: 42 houses/condos per square mile
Median price asked for vacant for-sale houses and condos in 2022 in this county: $137,997.
Median contract rent in 2022: $589 (lower quartile is $462, upper quartile is $723)
Median rent asked for vacant for-rent units in 2022: $581
Median gross rent in Tiger Valley, TN in 2022: $759
Housing units in Tiger Valley with a mortgage: 472 (40 second mortgage, 48 home equity loan, 0 both second mortgage and home equity loan)
Houses without a mortgage: 577


Household type by relationship:
Households: 55,933- In family households: 46,435 (11,586 male householders, 4,517 female householders)
11,989 spouses, 14,161 children (12,759 natural, 437 adopted, 965 stepchildren), 1,500 grandchildren, 380 brothers or sisters, 399 parents, foster children, 435 other relatives, 1,159 non-relatives
- In nonfamily households: 9,498 (3,804 male householders (3,101 living alone)), 4,290 female householders (3,810 living alone)), 1,404 nonrelatives
- In group quarters: 1,491 (910 institutionalized population)
8,247 married couples with children.
2,723 single-parent households (575 men, 2,148 women).
98.8% of residents of Tiger Valley speak English at home.
1.1% of residents speak Spanish at home (43% speak English very well, 50% speak English well, 7% speak English not well).
0.2% of residents speak other Indo-European language at home (60% speak English very well, 40% speak English well).
Foreign born population: 26 (0.4%)
(50.0% of them are naturalized citizens)
| Here: | 6.1 |
| State: | 6.5 |
| Here: | 4.7 |
| State: | 4.4 |

- Bedrooms in owner-occupied houses and condos in Tiger Valley, Tennessee
- 0no bedroom
- 771 bedroom
- 7612 bedrooms
- 1,0393 bedrooms
- 904 bedrooms
- 305+ bedrooms

- Bedrooms in renter-occupied apartments in Tiger Valley, Tennessee
- 0no bedroom
- 481 bedroom
- 2292 bedrooms
- 1353 bedrooms
- 424 bedrooms
- 05+ bedrooms

- Cars and other vehicles available in Tiger Valley in owner-occupied houses/condos
- 160no vehicle
- 4241 vehicle
- 8152 vehicles
- 3783 vehicles
- 1454 vehicles
- 755+ vehicles

- Cars and other vehicles available in Tiger Valley in renter-occupied apartments
- 56no vehicle
- 1861 vehicle
- 1162 vehicles
- 813 vehicles
- 154 vehicles
- 05+ vehicles

- Rooms in owner-occupied houses in Tiger Valley, Tennessee
- 01 room
- 62 rooms
- 803 rooms
- 3734 rooms
- 6555 rooms
- 5186 rooms
- 1857 rooms
- 1028 rooms
- 789+ rooms

- Rooms in renter-occupied apartments in Tiger Valley, Tennessee
- 01 room
- 202 rooms
- 233 rooms
- 1824 rooms
- 695 rooms
- 1126 rooms
- 297 rooms
- 78 rooms
- 129+ rooms


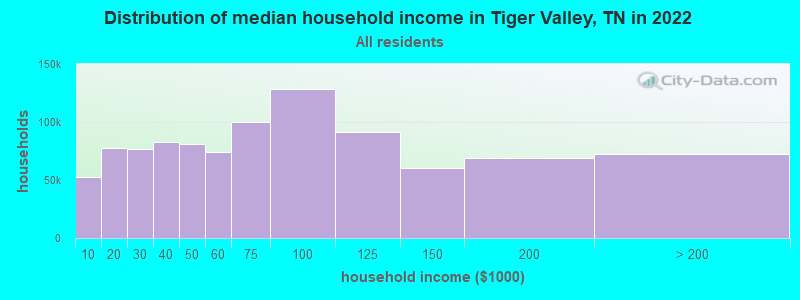
Tiger Valley, TN household income distribution

- 45,076Less than $10,000
- 69,548$10,000 to $19,999
- 67,540$20,000 to $29,999
- 71,857$30,000 to $39,999
- 70,012$40,000 to $49,999
- 64,269$50,000 to $59,999
- 86,912$60,000 to $74,999
- 111,239$75,000 to $99,999
- 80,645$100,000 to $124,999
- 51,554$125,000 to $149,999
- 58,205$150,000 to $199,999
- 57,257$200,000 or more
Percentage of workers working in this county: 50.7%
Number of people working at home: 345 (11.5% of all workers)
Travel time to work (commute)
- Less than 5 minutes: 33
- 5 to 9 minutes: 94
- 10 to 14 minutes: 244
- 15 to 19 minutes: 438
- 20 to 24 minutes: 409
- 25 to 29 minutes: 143
- 30 to 34 minutes: 525
- 35 to 39 minutes: 153
- 40 to 44 minutes: 99
- 45 to 59 minutes: 166
- 60 to 89 minutes: 89
- 90 or more minutes: 72
Means of transportation to work:
- Drove a car alone: 2,009 (80.1%)
- Carpooled: 417 (16.6%)
- Walked: 39 (1.6%)
- Worked at home: 44 (1.8%)


- Year of entry for the foreign-born population in Tiger Valley, Tennessee
- 01995 to March 2000
- 01990 to 1994
- 01985 to 1989
- 01980 to 1984
- 01975 to 1979
- 01970 to 1974
- 71965 to 1969
- 5Before 1965
Most common places of birth for foreign-born residents (%):
| Tiger Valley: | 58.3% (7) |
| Tennessee: | 28.1% (44,682) |
| Tiger Valley: | 41.7% (5) |
| Tennessee: | 5.2% (8,316) |
Place of birth for U.S.-born residents:
- This state: 4,125
- Other state: 1,679
- Northeast: 123
- Midwest: 390
- South: 1,085
- West: 81
65% of Tiger Valley residents lived in the same house 5 years ago.
Out of people who lived in different houses, 71% lived in this county.
Out of people who lived in different counties, 46% lived in Tennessee.
Education attainment for males 25 years and older:
- No schooling: 28
- Nursery to 4th grade: 51
- 5th and 6th grade: 68
- 7th and 8th grade: 231
- 9th grade: 91
- 10th grade: 173
- 11th grade: 95
- 12th grade, no diploma: 57
- High school graduate (or equivalency): 758
- Less than 1 year of college: 99
- Some college more than 1 year, no degree: 156
- Associate degree: 61
- Bachelor's degree: 97
- Master's degree: 38
- Professional school degree: 0
- Doctorate degree: 6

Education attainment for females 25 years and older:
- No schooling: 21
- Nursery to 4th grade: 20
- 5th and 6th grade: 42
- 7th and 8th grade: 234
- 9th grade: 110
- 10th grade: 106
- 11th grade: 84
- 12th grade, no diploma: 28
- High school graduate (or equivalency): 864
- Less than 1 year of college: 126
- Some college more than 1 year, no degree: 185
- Associate degree: 122
- Bachelor's degree: 118
- Master's degree: 56
- Professional school degree: 6
- Doctorate degree: 0


Housing units in structures:
- One, detached: 1,734
- One, attached: 6
- Two: 27
- 3 or 4: 25
- 5 to 9: 9
- Mobile homes: 909
Median worth of mobile homes: $74,369
Housing units lacking complete kitchen facilities: 3.1%

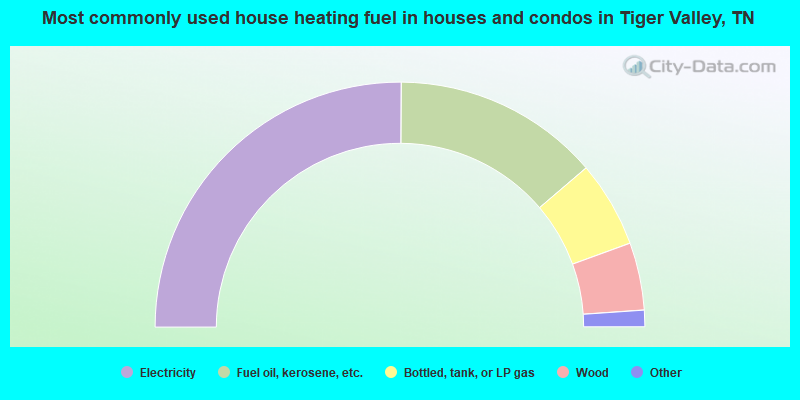
- 50.2%Electricity
- 27.3%Fuel oil, kerosene, etc.
- 11.4%Bottled, tank, or LP gas
- 8.9%Wood
- 1.9%Coal or coke
- 0.4%Utility gas
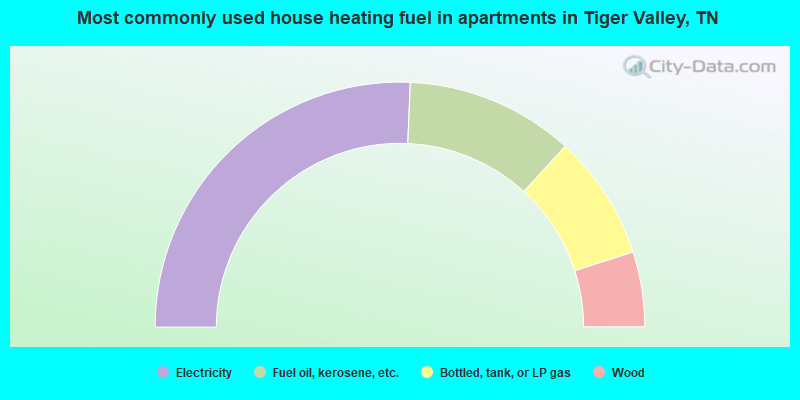
- 51.3%Electricity
- 22.2%Fuel oil, kerosene, etc.
- 16.5%Bottled, tank, or LP gas
- 9.9%Wood
Private vs. public school enrollment:
| Here: | 0.0% |
| Tennessee: | 9.5% |
| Here: | 0.8% |
| Tennessee: | 10.4% |
| Here: | 6.1% |
| Tennessee: | 22.8% |


