Tigard, OR (Oregon) Houses and Residents
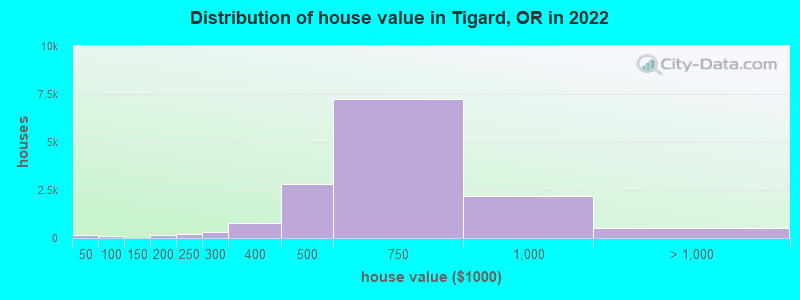
Estimated median house or condo value in 2022: $612,460 (it was $187,100 in 2000 )
Tigard:
$612,460Oregon:
$475,600
Lower value quartile - upper value quartile: $470,265 - $728,037Mean price in 2022: Detached houses: $512,338 Here:
$512,338State:
$562,872
Townhouses or other attached units: $579,836 Here:
$579,836State:
$463,029
In 3-to-4-unit structures: $304,943 Here:
$304,943State:
$419,673
In 5-or-more-unit structures: $205,291 Here:
$205,291State:
$420,389
Mobile homes: $80,045 Here:
$80,045State:
$214,044
Total population: 50,787 (Urban population: 41,261, Rural population: 0)
Houses: 23,770 (23,011 occupied: 14,393 owner occupied, 8,762 renter occupied )
% of renters here:
38%State:
37%
Housing density: 2,188 houses/condos per square mile
Median price asked for vacant for-sale houses and condos in 2022: $364,044.
Median contract rent in 2022: $1,503 (lower quartile is $1,162, upper quartile is $1,848)
Median rent asked for vacant for-rent units in 2022: $1,479
Median gross rent in Tigard, OR in 2022: $1,645
Housing units in Tigard with a mortgage: 10,314 (1,050 second mortgage, 40 home equity loan, 883 both second mortgage and home equity loan )Houses without a mortgage: 35
Median household income for houses/condos with a mortgage: $145,562
Median household income for apartments without a mortgage: $94,627
Median monthly housing costs: $1,734
Data:
Median house or condo value ($)
Median house or condo value ($ change since 2000)
Median house or condo value ($) - White
Median house or condo value ($) - Black or African American
Median house or condo value ($) - Asian
Median house or condo value ($) - Hispanic or Latino
Median house or condo value ($) - American Indian and Alaska Native
Median house or condo value ($) - Multirace
Median house or condo value ($) - Other Race
Median price asked for mobile homes ($)
Household density (households per square mile)
Mean house or condo value by units in structure - 1, detached ($)
Mean house or condo value by units in structure - 1, attached ($)
Mean house or condo value by units in structure - 2 ($)
Mean house or condo value by units in structure by units in structure - 3 or 4 ($)
Mean house or condo value by units in structure - 5 or more ($)
Mean house or condo value by units in structure - Boat, RV, van, etc. ($)
Mean house or condo value by units in structure - Mobile home ($)
Median contract rent ($)
Median contract rent - Lower quartile ($)
Median contract rent - Upper quartile ($)
Median gross rent ($)
Urban houses (%)
Rural houses (%)
Houses occupied (%)
Houses occupied (% change since 2000)
Houses owner occupied (%)
Houses owner occupied (% change since 2000)
Houses renter occupied (%)
Houses renter occupied (% change since 2000)
Vacant housing units - For rent (%)
Vacant housing units - For rent (% change since 2000)
Vacant housing units - For sale only (%)
Vacant housing units - For sale only (% change since 2000)
Vacant housing units - Rented or sold, not occupied (%)
Vacant housing units - Rented or sold, not occupied (% change since 2000)
Vacant housing units - For seasonal, recreational, or occasional use (%)
Vacant housing units - For seasonal, recreational, or occasional use (% change since 2000)
Vacant housing units - For migrant workers (%)
Vacant housing units - For migrant workers (% change since 2000)
Vacant housing units - Other vacant (%)
Vacant housing units - Other vacant (% change since 2000)
Median monthly housing costs ($)
Median household income for houses/condos with a mortgage ($)
Median household income for houses/condos without a mortgage ($)
Median household income ($)
Median household income ($) - White
Median household income ($) - Black or African American
Median household income ($) - Asian
Median household income ($) - Hispanic or Latino
Median household income ($) - American Indian and Alaska Native
Median household income ($) - Multirace
Median household income ($) - Other Race
Mortgage status - with mortgage (%)
Mortgage status - with second mortgage (%)
Mortgage status - with home equity loan (%)
Mortgage status - with both second mortgage and home equity loan (%)
Mortgage status - without a mortgage (%)
Median year house/condo built
Median year apartment built
Household type by relationship - Male householder living alone (%)
Household type by relationship - Male householder not living alone (%)
Household type by relationship - Female householder living alone (%)
Household type by relationship - Female householder not living alone (%)
Household type by relationship - Opposite-Sex spouse (%)
Household type by relationship - Same-Sex spouse (%)
Household type by relationship - Opposite-Sex unmarried partner (%)
Household type by relationship - Same-Sex unmarried partner (%)
Household type by relationship - In group quarters (%)
Size of family households - 2-person household (%)
Size of family households - 3-person household (%)
Size of family households - 4-person household (%)
Size of family households - 5-person household (%)
Size of family households - 6-person household (%)
Size of family households - 7-or-more-person household (%)
Size of nonfamily households - 1-person household (%)
Size of nonfamily households - 2-person household (%)
Size of nonfamily households - 3-person household (%)
Size of nonfamily households - 4-person household (%)
Size of nonfamily households - 5-person household (%)
Size of nonfamily households - 6-person household (%)
Size of nonfamily households - 7-or-moreperson household (%)
Year house built - Built 2010 or later (%)
Year house built - Built 2000 to 2009 (%)
Year house built - Built 1990 to 1999 (%)
Year house built - Built 1980 to 1989 (%)
Year house built - Built 1970 to 1979 (%)
Year house built - Built 1960 to 1969 (%)
Year house built - Built 1950 to 1959 (%)
Year house built - Built 1940 to 1949 (%)
Year house built - Built 1939 or earlier (%)
Median number of rooms in houses and condos
Median number of rooms in apartments
Median number of bedrooms in owner occupied houses
Mean number of bedrooms in owner occupied houses
Median number of bedrooms in renter occupied houses
Mean number of bedrooms in renter occupied houses
Median number of vehichles in owner occupied houses
Mean number of vehichles in owner occupied houses
Median number of vehichles in renter occupied houses
Mean number of vehichles in renter occupied houses
Rooms in owner-occupied houses - 1 room (%)
Rooms in owner-occupied houses - 2 rooms (%)
Rooms in owner-occupied houses - 3 rooms (%)
Rooms in owner-occupied houses - 4 rooms (%)
Rooms in owner-occupied houses - 5 rooms (%)
Rooms in owner-occupied houses - 6 rooms (%)
Rooms in owner-occupied houses - 7 rooms (%)
Rooms in owner-occupied houses - 8 rooms (%)
Rooms in owner-occupied houses - 9+ rooms (%)
Rooms in renter-occupied houses - 1 room (%)
Rooms in renter-occupied houses - 2 rooms (%)
Rooms in renter-occupied houses - 3 rooms (%)
Rooms in renter-occupied houses - 4 rooms (%)
Rooms in renter-occupied houses - 5 rooms (%)
Rooms in renter-occupied houses - 6 rooms (%)
Rooms in renter-occupied houses - 7 rooms (%)
Rooms in renter-occupied houses - 8 rooms (%)
Rooms in renter-occupied houses - 9+ rooms (%)
Bedrooms in owner-occupied houses - no bedrooms (%)
Bedrooms in owner-occupied houses - 1 bedroom (%)
Bedrooms in owner-occupied houses - 2 bedrooms (%)
Bedrooms in owner-occupied houses - 3 bedrooms (%)
Bedrooms in owner-occupied houses - 4 bedrooms (%)
Bedrooms in owner-occupied houses - 5+ bedrooms (%)
Bedrooms in renter-occupied houses - no bedrooms (%)
Bedrooms in renter-occupied houses - 1 bedroom (%)
Bedrooms in renter-occupied houses - 2 bedrooms (%)
Bedrooms in renter-occupied houses - 3 bedrooms (%)
Bedrooms in renter-occupied houses - 4 bedrooms (%)
Bedrooms in renter-occupied houses - 5+ bedrooms (%)
Vehicles available in owner-occupied houses - no vehicle available (%)
Vehicles available in owner-occupied houses - 1 vehicle available(%)
Vehicles available in owner-occupied houses - 2 Vehicles available (%)
Vehicles available in owner-occupied houses - 3 Vehicles available (%)
Vehicles available in owner-occupied houses - 4 Vehicles available (%)
Vehicles available in owner-occupied houses - 5+ Vehicles available (%)
Vehicles available in renter-occupied houses - no vehicle available (%)
Vehicles available in renter-occupied houses - 1 vehicle available (%)
Vehicles available in renter-occupied houses - 2 Vehicles available (%)
Vehicles available in renter-occupied houses - 3 Vehicles available (%)
Vehicles available in renter-occupied houses - 4 Vehicles available (%)
Vehicles available in renter-occupied houses - 5+ Vehicles available (%)
Housing units in structures - 1, detached (%)
Housing units in structures - 1, attached (%)
Housing units in structures - 2 (%)
Housing units in structures - 3 or 4 (%)
Housing units in structures - 5 to 9 (%)
Housing units in structures - 10 to 19 (%)
Housing units in structures - 20 to 49 (%)
Housing units in structures - 50 or more (%)
Housing units in structures - Mobile home (%)
Housing units in structures - Boat, RV, van, etc. (%)
Housing units in structures - Owners - 1, detached (%)
Housing units in structures - Owners - 1, attached (%)
Housing units in structures - Owners - 2 (%)
Housing units in structures - Owners - 3 or 4 (%)
Housing units in structures - Owners - 5 to 9 (%)
Housing units in structures - Owners - 10 to 19 (%)
Housing units in structures - Owners - 20 to 49 (%)
Housing units in structures - Owners - 50 or more (%)
Housing units in structures - Owners - Mobile home (%)
Housing units in structures - Owners - Boat, RV, van, etc. (%)
Housing units in structures - Renters - 1, detached (%)
Housing units in structures - Renters - 1, attached (%)
Housing units in structures - Renters - 2 (%)
Housing units in structures - Renters - 3 or 4 (%)
Housing units in structures - Renters - 5 to 9 (%)
Housing units in structures - Renters - 10 to 19 (%)
Housing units in structures - Renters - 20 to 49 (%)
Housing units in structures - Renters - 50 or more (%)
Housing units in structures - Renters - Mobile home (%)
Housing units in structures - Renters - Boat, RV, van, etc. (%)
House/condo owner moved in on average (years ago)
Renter moved in on average (years ago)
Year householder moved into unit - Moved in 1999 to March 2000 (%)
Year householder moved into unit - Moved in 1999 to March 2000 (%) - White
Year householder moved into unit - Moved in 1999 to March 2000 (%) - Black or African American
Year householder moved into unit - Moved in 1999 to March 2000 (%) - Asian
Year householder moved into unit - Moved in 1999 to March 2000 (%) - Hispanic or Latino
Year householder moved into unit - Moved in 1999 to March 2000 (%) - American Indian and Alaska Native
Year householder moved into unit - Moved in 1999 to March 2000 (%) - Multirace
Year householder moved into unit - Moved in 1999 to March 2000 (%) - Other Race
Year householder moved into unit - Moved in 1995 to 1998 (%)
Year householder moved into unit - Moved in 1995 to 1998 (%) - White
Year householder moved into unit - Moved in 1995 to 1998 (%) - Black or African American
Year householder moved into unit - Moved in 1995 to 1998 (%) - Asian
Year householder moved into unit - Moved in 1995 to 1998 (%) - Hispanic or Latino
Year householder moved into unit - Moved in 1995 to 1998 (%) - American Indian and Alaska Native
Year householder moved into unit - Moved in 1995 to 1998 (%) - Multirace
Year householder moved into unit - Moved in 1995 to 1998 (%) - Other Race
Year householder moved into unit - Moved in 1990 to 1994 (%)
Year householder moved into unit - Moved in 1990 to 1994 (%) - White
Year householder moved into unit - Moved in 1990 to 1994 (%) - Black or African American
Year householder moved into unit - Moved in 1990 to 1994 (%) - Asian
Year householder moved into unit - Moved in 1990 to 1994 (%) - Hispanic or Latino
Year householder moved into unit - Moved in 1990 to 1994 (%) - American Indian and Alaska Native
Year householder moved into unit - Moved in 1990 to 1994 (%) - Multirace
Year householder moved into unit - Moved in 1990 to 1994 (%) - Other Race
Year householder moved into unit - Moved in 1980 to 1989 (%)
Year householder moved into unit - Moved in 1980 to 1989 (%) - White
Year householder moved into unit - Moved in 1980 to 1989 (%) - Black or African American
Year householder moved into unit - Moved in 1980 to 1989 (%) - Asian
Year householder moved into unit - Moved in 1980 to 1989 (%) - Hispanic or Latino
Year householder moved into unit - Moved in 1980 to 1989 (%) - American Indian and Alaska Native
Year householder moved into unit - Moved in 1980 to 1989 (%) - Multirace
Year householder moved into unit - Moved in 1980 to 1989 (%) - Other Race
Year householder moved into unit - Moved in 1970 to 1979 (%)
Year householder moved into unit - Moved in 1970 to 1979 (%) - White
Year householder moved into unit - Moved in 1970 to 1979 (%) - Black or African American
Year householder moved into unit - Moved in 1970 to 1979 (%) - Asian
Year householder moved into unit - Moved in 1970 to 1979 (%) - Hispanic or Latino
Year householder moved into unit - Moved in 1970 to 1979 (%) - American Indian and Alaska Native
Year householder moved into unit - Moved in 1970 to 1979 (%) - Multirace
Year householder moved into unit - Moved in 1970 to 1979 (%) - Other Race
Year householder moved into unit - Moved in 1969 or earlier (%)
Year householder moved into unit - Moved in 1969 or earlier (%) - White
Year householder moved into unit - Moved in 1969 or earlier (%) - Black or African American
Year householder moved into unit - Moved in 1969 or earlier (%) - Asian
Year householder moved into unit - Moved in 1969 or earlier (%) - Hispanic or Latino
Year householder moved into unit - Moved in 1969 or earlier (%) - American Indian and Alaska Native
Year householder moved into unit - Moved in 1969 or earlier (%) - Multirace
Year householder moved into unit - Moved in 1969 or earlier (%) - Other Race
Housing units lacking complete plumbing facilities (%)
Housing units lacking complete kitchen facilities (%)
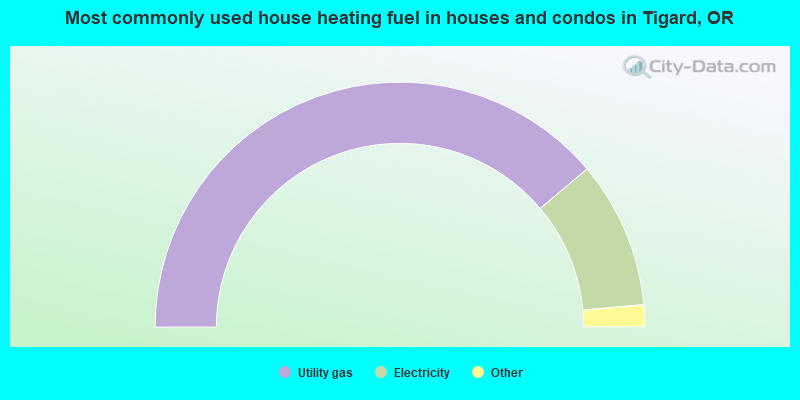
House heating fuel used in houses and condos - Utility gas (%)
House heating fuel used in houses and condos - Bottled, tank, or LP gas (%)
House heating fuel used in houses and condos - Electricity (%)
House heating fuel used in houses and condos - Fuel oil, kerosene, etc. (%)
House heating fuel used in houses and condos - Coal or coke (%)
House heating fuel used in houses and condos - Wood (%)
House heating fuel used in houses and condos - Solar energy (%)
House heating fuel used in houses and condos - Other fuel (%)
House heating fuel used in houses and condos - No fuel used (%)
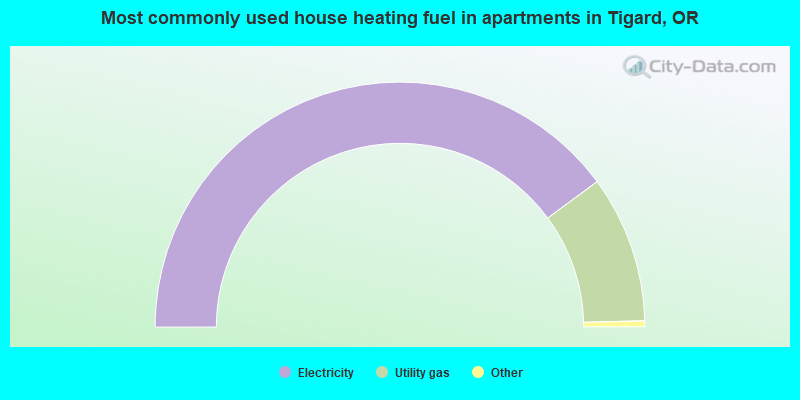
House heating fuel used in apartments - Utility gas (%)
House heating fuel used in apartments - Bottled, tank, or LP gas (%)
House heating fuel used in apartments - Electricity (%)
House heating fuel used in apartments - Fuel oil, kerosene, etc. (%)
House heating fuel used in apartments - Coal or coke (%)
House heating fuel used in apartments - Wood (%)
House heating fuel used in apartments - Solar energy (%)
House heating fuel used in apartments - Other fuel (%)
House heating fuel used in apartments - No fuel used (%)
Latest news about housing in Tigard, OR collected exclusively by city-data.com from local newspapers, TV, and radio stations
Median year house/condo built: 1987Median year apartment built: 1985Household type by relationship:
Households: 55,219
Male householders: 11,297 (2,076 living alone ), Female householders: 11,179 (3,586 living alone )11,654 spouses (11,540 opposite-sex spouses ), 1,641 unmarried partners , (1,587 opposite-sex unmarried partners ), 14,356 children (13,543 natural , 309 adopted , 503 stepchildren ), 644 grandchildren , 456 brothers or sisters , 586 parents , 0 foster children , 704 other relatives , 2,233 non-relatives In group quarters: 463
Size of family households: 7,298 2-persons , 3,543 3-persons , 2,587 4-persons , 798 5-persons , 400 6-persons , 121 7-or-more-persons .
Size of nonfamily households: 6,123 1-person , 2,175 2-persons , 77 3-persons , 120 4-persons , 12 5-persons .
7,641 married couples with children. single-parent households (907 men , 1,511 women ).
79.0% of residents of Tigard speak English at home. of residents speak Spanish at home (72% speak English very well , 13% speak English well , 11% speak English not well , 4% don't speak English at all ).of residents speak other Indo-European language at home (72% speak English very well , 13% speak English well , 15% speak English not well ).of residents speak Asian or Pacific Island language at home (68% speak English very well , 20% speak English well , 11% speak English not well ).of residents speak other language at home (88% speak English very well , 12% speak English well ).
Foreign born population: 7,887 (14.3%)of them are naturalized citizens )
Median number of rooms in houses and condos:
Median number of rooms in apartments
Owner-occupied Renter-occupied
Rooms in owner-occupied houses in Tigard, Oregon
39 1 room 86 2 rooms 438 3 rooms 961 4 rooms 2,821 5 rooms 2,643 6 rooms 2,315 7 rooms 1,963 8 rooms 3,128 9+ rooms
Rooms in renter-occupied apartments in Tigard, Oregon
524 1 room 1,043 2 rooms 2,011 3 rooms 2,710 4 rooms 965 5 rooms 947 6 rooms 322 7 rooms 102 8 rooms 139 9+ rooms
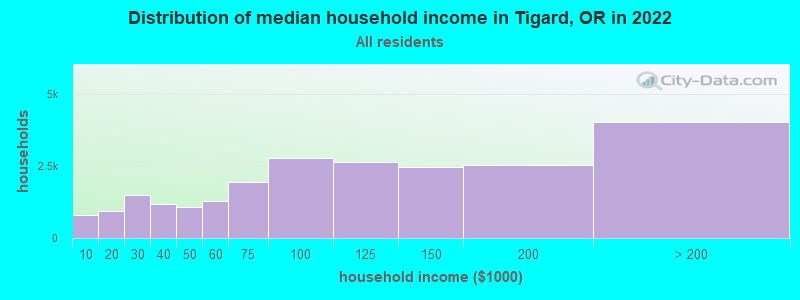
Tigard, OR household income distribution 799 Less than $10,000945 $10,000 to $19,9991,485 $20,000 to $29,9991,180 $30,000 to $39,9991,067 $40,000 to $49,9991,298 $50,000 to $59,9991,946 $60,000 to $74,9992,769 $75,000 to $99,9992,625 $100,000 to $124,9992,450 $125,000 to $149,9992,533 $150,000 to $199,9994,018 $200,000 or more
Home value of owner - occupied houses in 2022 in Tigard, OR 42 Less than $10,0008 $10,000 to $14,999107 $40,000 to $49,99917 $50,000 to $59,99926 $100,000 to $124,999116 $150,000 to $174,99955 $175,000 to $199,999207 $200,000 to $249,999337 $250,000 to $299,999802 $300,000 to $399,9992,832 $400,000 to $499,9997,240 $500,000 to $749,9992,172 $750,000 to $999,999412 $1,000,000 to $1,499,99944 $1,500,000 to $1,999,99957 $2,000,000 or moreRent paid by renters in 2022 in Tigard, OR 148 $150 to $19915 $300 to $34918 $400 to $4493 $450 to $49925 $500 to $54925 $550 to $59917 $600 to $64982 $650 to $699120 $700 to $74944 $750 to $799273 $800 to $899500 $900 to $9991,535 $1,000 to $1,2491,598 $1,250 to $1,4993,083 $1,500 to $1,9991,030 $2,000 to $2,499123 $2,500 to $2,99949 $3,000 to $3,4992 $3,500 or more207 No cash rent
Percentage of workers working in this county: 75.0%Number of people working at home: 9,081 (30.4% of all workers )
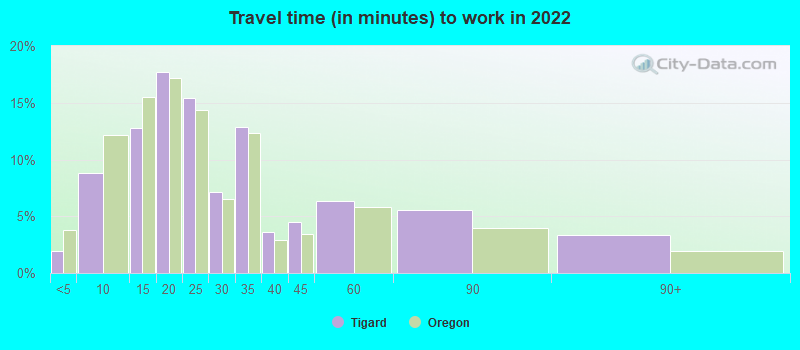
Travel time to work (commute)
Less than 5 minutes: 3225 to 9 minutes: 1,82910 to 14 minutes: 3,01315 to 19 minutes: 3,94420 to 24 minutes: 3,67525 to 29 minutes: 1,41330 to 34 minutes: 3,56535 to 39 minutes: 80240 to 44 minutes: 1,15745 to 59 minutes: 97360 to 89 minutes: 51390 or more minutes: 173
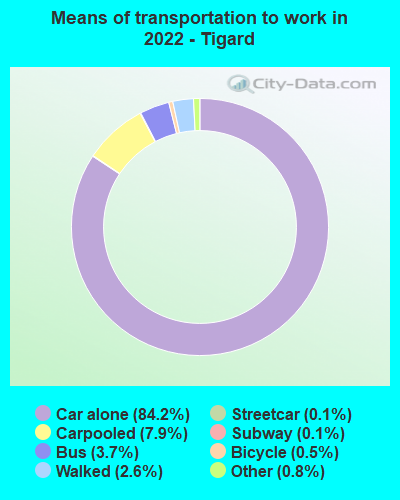
Means of transportation to work:
Drove a car alone: 26,354 (65.7%)Carpooled: 2,165 (5.4%)Bus : 1,009 (2.5%)Subway or elevated rail : 17 (0.0%)Long-distance train or commuter rail : 18 (0.0%)Light rail, streetcar or trolley : 15 (0.0%)Taxi: 309 (0.8%)Bicycle: 94 (0.2%)Walked: 955 (2.4%)Worked at home: 9,081 (22.6%)
Unemployment by race in 2022
Unemployment rate for White non-Hispanic residents 3.3% Males2.8% FemalesUnemployment rate for Black residents 8.1% Males12.1% FemalesUnemployment rate for American Indian and Alaska Native residents 6.0% FemalesUnemployment rate for Asian residents 1.3% Males3.2% FemalesUnemployment rate for other race residents 14.3% Males1.5% FemalesUnemployment rate for two or more race residents 9.5% MalesUnemployment rate for Hispanic or Latino residents 8.7% Males1.1% Females
Year of entry for the foreign-born population in Tigard, Oregon
1,851 2010 or later 1,206 2000 to 2009 2,508 1990 to 1999 1,377 1980 to 1989 688 1970 to 1979 567 Before 1970
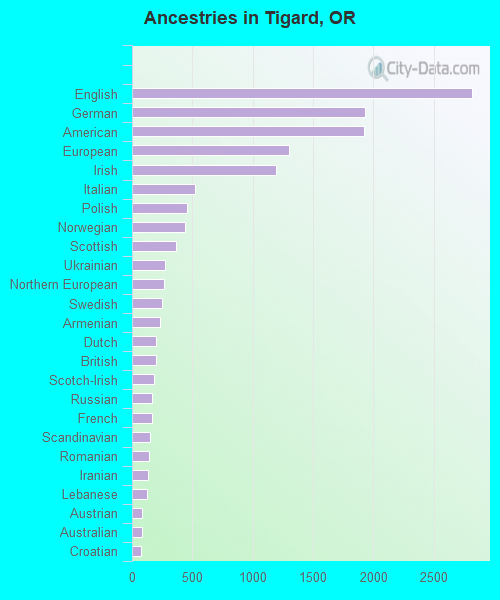
First ancestries reported:
English: 2,819 (11.0%)
German: 1,930 (7.5%)
American: 1,920 (7.5%)
European: 1,300 (5.1%)
Irish: 1,197 (4.7%)
Italian: 522 (2.0%)
Polish: 457 (1.8%)
Norwegian: 441 (1.7%)
Scottish: 361 (1.4%)
Ukrainian: 275 (1.1%)
Northern European: 266 (1.0%)
Swedish: 252 (1.0%)
Armenian: 234 (0.9%)
Dutch: 202 (0.8%)
British: 195 (0.8%)
Scotch-Irish: 185 (0.7%)
Russian: 168 (0.7%)
French: 164 (0.6%)
Scandinavian: 149 (0.6%)
Romanian: 138 (0.5%)
Iranian: 129 (0.5%)
Lebanese: 123 (0.5%)
Austrian: 83 (0.3%)
Australian: 80 (0.3%)
Croatian: 78 (0.3%)
Nigerian: 77 (0.3%)
Yugoslavian: 75 (0.3%)
Canadian: 72 (0.3%)
Czech: 67 (0.3%)
Welsh: 62 (0.2%)
Danish: 61 (0.2%)
Eastern European: 57 (0.2%)
Greek: 54 (0.2%)
Egyptian: 51 (0.2%)
Finnish: 42 (0.2%)
Slavic: 42 (0.2%)
Portuguese: 39 (0.2%)
Hungarian: 29 (0.1%)
Swiss: 29 (0.1%)
Iraqi: 27 (0.1%)
Basque: 21 (0.08%)
Celtic: 21 (0.08%)
Bulgarian: 18 (0.07%)
Czechoslovakian: 17 (0.07%)
Syrian: 14 (0.05%)
Serbian: 13 (0.05%)
Brazilian: 12 (0.05%)
Latvian: 11 (0.04%)
New Zealander: 9 (0.04%)
Turkish: 8 (0.03%)
African: 7 (0.03%)
Lithuanian: 5 (0.02%)
Kenyan: 4 (0.02%)
Belizean: 4 (0.02%)
French Canadian: 2 (0.01%)
Most common places of birth for foreign-born residents (%): Mexico Tigard:
11.3% (894)Oregon:
33.9% (140,109)
Philippines Tigard:
8.3% (656)Oregon:
3.5% (14,530)
Vietnam Tigard:
6.6% (521)Oregon:
5.5% (22,563)
India Tigard:
6.3% (502)Oregon:
4.7% (19,604)
Canada Tigard:
5.1% (406)Oregon:
3.7% (15,229)
China, excluding Hong Kong and Taiwan Tigard:
4.6% (366)Oregon:
5.2% (21,429)
Azerbaijan Tigard:
4.2% (337)Oregon:
0.1% (554)
Guatemala Tigard:
4.0% (319)Oregon:
1.7% (7,103)
Peru Tigard:
3.3% (263)Oregon:
0.7% (2,927)
Micronesia Tigard:
3.2% (250)Oregon:
0.5% (1,921)
England Tigard:
3.0% (234)Oregon:
1.5% (6,313)
France Tigard:
2.8% (223)Oregon:
0.7% (2,761)
Iraq Tigard:
2.8% (222)Oregon:
0.7% (3,094)
Cambodia Tigard:
2.4% (188)Oregon:
0.6% (2,330)
Korea Tigard:
2.3% (181)Oregon:
2.8% (11,450)
Japan Tigard:
2.2% (176)Oregon:
1.5% (6,259)
Ukraine Tigard:
1.7% (138)Oregon:
2.1% (8,469)
Hong Kong Tigard:
1.7% (137)Oregon:
0.6% (2,667)
Iran Tigard:
1.7% (134)Oregon:
1.0% (4,122)
Cuba Tigard:
1.7% (133)Oregon:
0.5% (2,247)
Bosnia and Herzegovina Tigard:
1.5% (121)Oregon:
0.2% (782)
Place of birth for U.S.-born residents:
This state: 23,933Other state: 22,406Northeast: 2,397Midwest: 3,767South: 3,333West: 12,894 88.9% of Tigard residents lived in the same house 1 years ago.
Out of people who lived in different houses, 32.8% lived in this county.
Out of people who lived in different counties, 48.6% lived in Oregon.
Tigard:
88.9%State average:
85.5%
Education attainment for males 25 years and older:
No schooling: 350Nursery to 4th grade: 245th and 6th grade: 1357th and 8th grade: 349th grade: 13410th grade: 4411th grade: 12112th grade, no diploma: 271High school graduate (or equivalency): 3,062Less than 1 year of college: 1,075Some college more than 1 year, no degree: 3,075Associate degree: 2,197Bachelor's degree: 6,265Master's degree: 2,213Professional school degree: 764Doctorate degree: 305
Education attainment for females 25 years and older:
No schooling: 335Nursery to 4th grade: 305th and 6th grade: 347th and 8th grade: 729th grade: 2910th grade: 18111th grade: 2712th grade, no diploma: 307High school graduate (or equivalency): 2,925Less than 1 year of college: 1,448Some college more than 1 year, no degree: 3,229Associate degree: 1,924Bachelor's degree: 6,432Master's degree: 2,981Professional school degree: 689Doctorate degree: 275
Housing units in structures:
One, detached: 13,800One, attached: 1,823Two: 4403 or 4: 1,9345 to 9: 1,77710 to 19: 1,34720 to 49: 81850 or more: 1,793Mobile homes: 20Boats, RVs, vans, etc.: 13Housing units lacking complete plumbing facilities in 2022: 1.1%Housing units lacking complete kitchen facilities in 2022: 2.4%House/condo owner moved in on average 10 years ago
Renter moved in on average 3 years ago
Private vs. public school enrollment:
Students in private schools in grades 1 to 8 (elementary and middle school): 917 Students in private schools in grades 9 to 12 (high school): 148 Students in private undergraduate colleges: 213