Tiffin, OH (Ohio) Houses and Residents
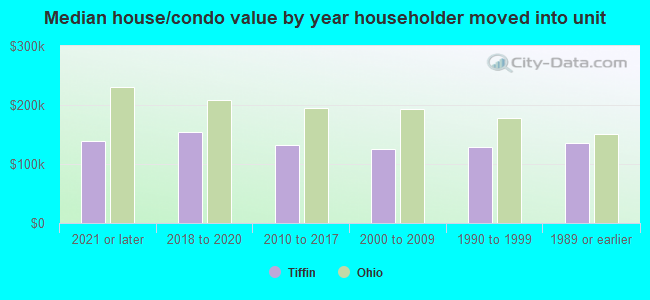
| Tiffin: | $137,626 |
| Ohio: | $204,100 |
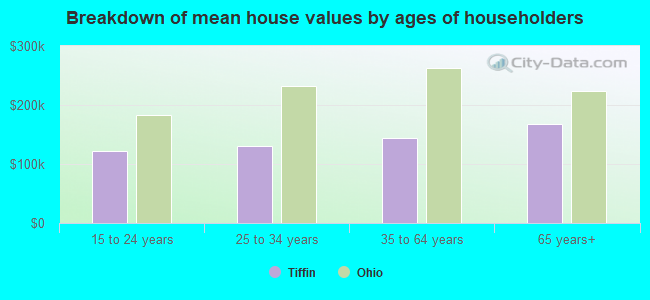
Mean price in 2022:
Detached houses: $187,823
Here: $187,823 State: $254,366 Townhouses or other attached units: $191,867
Here: $191,867 State: $225,733 In 2-unit structures: $108,601
Here: $108,601 State: $144,384 Mobile homes: $22,704
Here: $22,704 State: $62,719
Total population: 17,739 (All urban)
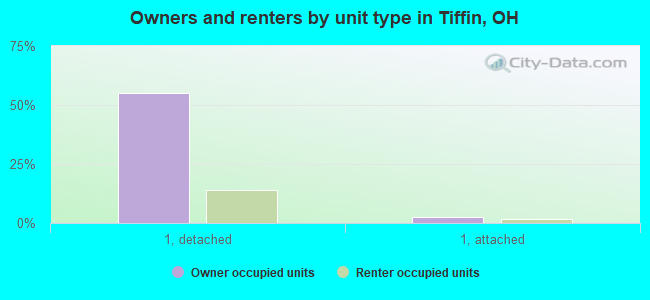
Houses: 8,442 (7,603 occupied: 4,636 owner occupied, 3,046 renter occupied)
| % of renters here: | 40% |
| State: | 33% |
Housing density: 1,300 houses/condos per square mile
Median price asked for vacant for-sale houses and condos in 2022: $53,546.
Median contract rent in 2022: $587 (lower quartile is $475, upper quartile is $773)
Median rent asked for vacant for-rent units in 2022: $720
Median gross rent in Tiffin, OH in 2022: $804
Housing units in Tiffin with a mortgage: 2,442 (210 second mortgage, 0 home equity loan, 206 both second mortgage and home equity loan)
Houses without a mortgage: 201
Median household income for houses/condos with a mortgage: $73,335
Median household income for apartments without a mortgage: $46,515
Median monthly housing costs: $747
Compare current foreclosures near Tiffin, OH:
| Photo | Address | Area | Beds / Baths | Price | Details |
|---|---|---|---|---|---|

|
#1
2nd Ave
Tiffin, OH 44883
|
1,002 sq. feet
|
1 baths 2 beds |
$16,700
|
show details |

|
#2
Hudson St
Tiffin, OH 44883
|
1,612 sq. feet
|
1 baths 3 beds |
show details | |

|
#3
N County Road 11
Tiffin, OH 44883
|
1,456 sq. feet
|
2 baths 3 beds |
show details | |

|
#4
6th Ave
Tiffin, OH 44883
|
1,056 sq. feet
|
1 baths 3 beds |
show details | |

|
#5
Tomb St
Tiffin, OH 44883
|
960 sq. feet
|
1 baths 3 beds |
show details | |

|
#6
Lindsay Ave
Tiffin, OH 44883
|
1,536 sq. feet
|
2 baths 4 beds |
show details | |

|
#7
Jefferson St
Tiffin, OH 44883
|
1,340 sq. feet
|
2 baths 3 beds |
show details | |

|
#8
7th Ave
Tiffin, OH 44883
|
1,416 sq. feet
|
1 baths 3 beds |
show details | |

|
#9
E Davis St
Tiffin, OH 44883
|
1,416 sq. feet
|
1 baths 3 beds |
show details | |

|
#10
S Sandusky St
Tiffin, OH 44883
|
1,274 sq. feet
|
2 baths 3 beds |
show details |
| Photo | Address | Area | Beds / Baths | Price | Details |
|---|---|---|---|---|---|

|
#11
Melmore St
Tiffin, OH 44883
|
1,959 sq. feet
|
2 baths 4 beds |
show details | |

|
#12
Nelson St
Tiffin, OH 44883
|
1,584 sq. feet
|
1 baths 4 beds |
show details | |

|
#13
Wentz St
Tiffin, OH 44883
|
1,160 sq. feet
|
1 baths 2 beds |
show details | |

|
#14
Wall St
Tiffin, OH 44883
|
1,434 sq. feet
|
1 baths 3 beds |
show details | |

|
#15
N State Route 53
Tiffin, OH 44883
|
928 sq. feet
|
1 baths 2 beds |
show details | |

|
#16
S Monroe St
Tiffin, OH 44883
|
2,144 sq. feet
|
2 baths 4 beds |
show details | |

|
#17
Coe St
Tiffin, OH 44883
|
1,258 sq. feet
|
1 baths 3 beds |
show details | |

|
#18
E South Trl
Tiffin, OH 44883
|
- sq. feet
|
- baths - beds |
show details | |

|
#19
Jefferson St
Tiffin, OH 44883
|
- sq. feet
|
- baths - beds |
show details | |

|
#20
Circular St
Tiffin, OH 44883
|
- sq. feet
|
- baths - beds |
show details |
| Photo | Address | Area | Beds / Baths | Price | Details |
|---|---|---|---|---|---|

|
#21
Gail Ln
Tiffin, OH 44883
|
- sq. feet
|
- baths - beds |
show details | |

|
#22
W State St
Fremont, OH 43420
|
2,190 sq. feet
|
2 baths 4 beds |
show details | |

|
#23
Seneca St
Attica, OH 44807
|
1,193 sq. feet
|
1 baths 3 beds |
show details | |

|
#24
County Road 175
Clyde, OH 43410
|
1,038 sq. feet
|
1 baths 3 beds |
show details | |

|
#25
6th St
Fremont, OH 43420
|
1,456 sq. feet
|
1 baths 2 beds |
show details | |

|
#26
N Ohio Ave
Fremont, OH 43420
|
982 sq. feet
|
1 baths 3 beds |
show details | |

|
#27
W Jackson St
Fostoria, OH 44830
|
1,484 sq. feet
|
1 baths 2 beds |
show details | |

|
#28
Berkshire Dr
Fostoria, OH 44830
|
1,056 sq. feet
|
1 baths 3 beds |
show details | |

|
#29
Kennedy Ln
Fostoria, OH 44830
|
2,128 sq. feet
|
2 baths 4 beds |
show details | |

|
#30
Vickie Ln
Fostoria, OH 44830
|
1,568 sq. feet
|
2 baths 4 beds |
show details |
| Photo | Address | Area | Beds / Baths | Price | Details |
|---|---|---|---|---|---|

|
#31
Hawthorne Rd
Fostoria, OH 44830
|
3,529 sq. feet
|
3 baths 5 beds |
show details | |

|
#32
Martin Ave
Fremont, OH 43420
|
1,648 sq. feet
|
1 baths 3 beds |
show details | |

|
#33
Amsden Blvd
Fremont, OH 43420
|
748 sq. feet
|
1 baths 2 beds |
show details | |

|
#34
May St
Fremont, OH 43420
|
1,069 sq. feet
|
1 baths 4 beds |
show details | |

|
#35
Race St
Clyde, OH 43410
|
1,876 sq. feet
|
2 baths 3 beds |
show details | |

|
#36
Hazel St
Fremont, OH 43420
|
1,326 sq. feet
|
1 baths 3 beds |
show details | |

|
#37
E State St
Fremont, OH 43420
|
1,364 sq. feet
|
1 baths 2 beds |
show details | |

|
#38
Township Highway 95
Carey, OH 43316
|
2,184 sq. feet
|
1 baths 3 beds |
show details | |

|
#39
Mechanic St
Clyde, OH 43410
|
984 sq. feet
|
1 baths 3 beds |
show details | |

|
#40
N Woodland Ave
Clyde, OH 43410
|
1,264 sq. feet
|
1 baths 3 beds |
show details |
| Photo | Address | Area | Beds / Baths | Price | Details |
|---|---|---|---|---|---|

|
#41
N Ohio Ave
Fremont, OH 43420
|
1,646 sq. feet
|
1 baths 3 beds |
show details | |

|
#42
N Union St
Fostoria, OH 44830
|
1,740 sq. feet
|
1 baths 3 beds |
show details | |

|
#43
George St
Clyde, OH 43410
|
1,110 sq. feet
|
1 baths 3 beds |
show details | |

|
#44
Columbus Ave
Fostoria, OH 44830
|
1,820 sq. feet
|
1 baths 3 beds |
show details | |

|
#45
W Township Road 112
Fostoria, OH 44830
|
2,232 sq. feet
|
1 baths 1 beds |
show details | |

|
#46
Columbus Ave
Fostoria, OH 44830
|
720 sq. feet
|
1 baths 2 beds |
show details | |

|
#47
W North St
Fostoria, OH 44830
|
1,864 sq. feet
|
1 baths 4 beds |
show details | |

|
#48
N Union St
Fostoria, OH 44830
|
3,370 sq. feet
|
3 baths 5 beds |
show details | |

|
#49
N County Road 43
Republic, OH 44867
|
1,400 sq. feet
|
1 baths 2 beds |
show details | |

|
Check over 1 million property listings on Foreclosure.com!
|
browse all offers | |||

Latest news about housing in Tiffin, OH collected exclusively by city-data.com from local newspapers, TV, and radio stations

 | Relocating to Small Town Ohio (37 replies) |
| Trying to escape Commifornia to freedom and space. Ohio? And where? (51 replies) |
| Your experience with relocation to Findlay? (5 replies) |
| Downtown Toledo Living (38 replies) |
| Moving from Long Island, NY to Findlay, OH (18 replies) |
| How is Ohio University perceived in Cleveland? (48 replies) |
Median year apartment built: 1962
Household type by relationship:
Households: 17,865- Male householders: 3,496 (1,246 living alone), Female householders: 4,034 (1,783 living alone)
2,513 spouses (2,495 opposite-sex spouses), 785 unmarried partners, (730 opposite-sex unmarried partners), 3,906 children (3,614 natural, 38 adopted, 253 stepchildren), 265 grandchildren, 145 brothers or sisters, 235 parents, 2 foster children, 106 other relatives, 326 non-relatives
- In group quarters: 2,045
Size of family households: 2,021 2-persons, 824 3-persons, 605 4-persons, 290 5-persons, 173 6-persons, 10 7-or-more-persons.
Size of nonfamily households: 3,126 1-person, 563 2-persons, 91 3-persons.
1,705 married couples with children.
1,194 single-parent households (311 men, 883 women).
96.1% of residents of Tiffin speak English at home.
2.0% of residents speak Spanish at home (78% speak English very well, 9% speak English well, 13% speak English not well).
0.8% of residents speak other Indo-European language at home (80% speak English very well, 20% speak English well).
0.7% of residents speak Asian or Pacific Island language at home (57% speak English very well, 43% speak English well).
0.2% of residents speak other language at home (100% speak English very well).
Foreign born population: 304 (1.7%)
(50.7% of them are naturalized citizens)
| Here: | 6.4 |
| State: | 6.7 |
| Here: | 4.6 |
| State: | 4.4 |
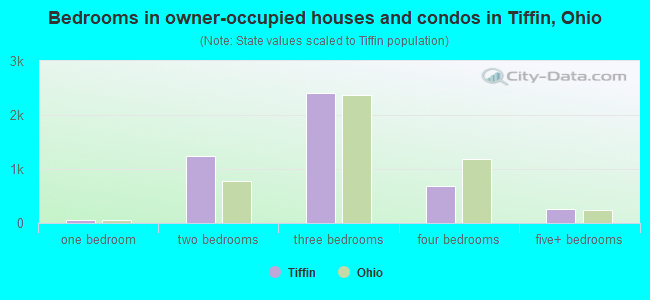
- Bedrooms in owner-occupied houses and condos in Tiffin, Ohio
- 0no bedroom
- 531 bedroom
- 1,2442 bedrooms
- 2,4023 bedrooms
- 6784 bedrooms
- 2605+ bedrooms
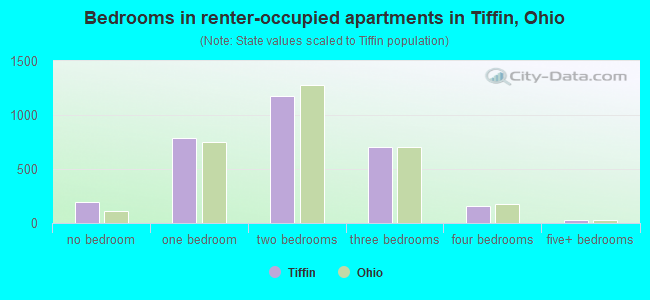
- Bedrooms in renter-occupied apartments in Tiffin, Ohio
- 198no bedroom
- 7911 bedroom
- 1,1762 bedrooms
- 7033 bedrooms
- 1544 bedrooms
- 245+ bedrooms
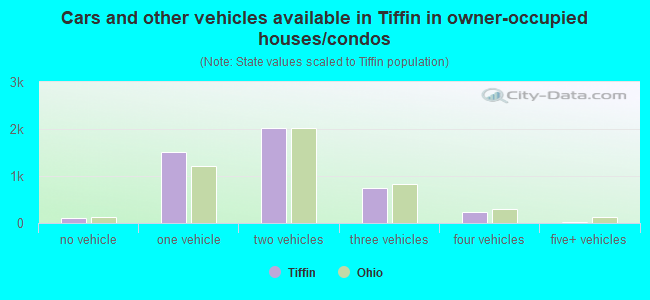
- Cars and other vehicles available in Tiffin in owner-occupied houses/condos
- 116no vehicle
- 1,5051 vehicle
- 2,0192 vehicles
- 7363 vehicles
- 2314 vehicles
- 295+ vehicles
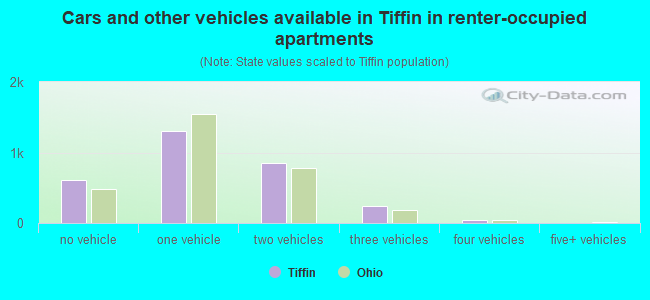
- Cars and other vehicles available in Tiffin in renter-occupied apartments
- 613no vehicle
- 1,3091 vehicle
- 8452 vehicles
- 2373 vehicles
- 424 vehicles
- 05+ vehicles
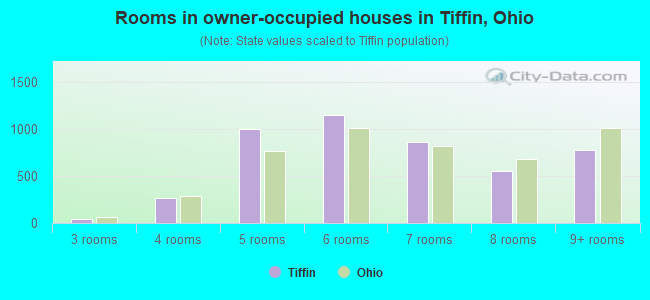
- Rooms in owner-occupied houses in Tiffin, Ohio
- 01 room
- 02 rooms
- 423 rooms
- 2644 rooms
- 9985 rooms
- 1,1466 rooms
- 8587 rooms
- 5538 rooms
- 7769+ rooms
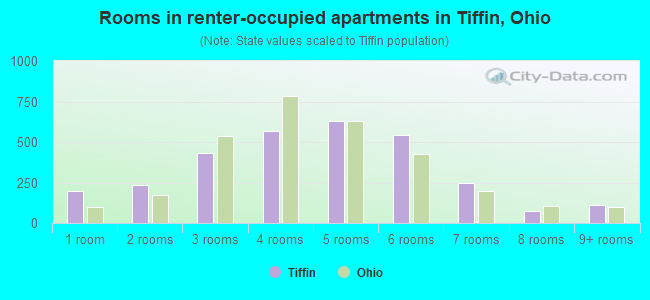
- Rooms in renter-occupied apartments in Tiffin, Ohio
- 1981 room
- 2352 rooms
- 4343 rooms
- 5704 rooms
- 6315 rooms
- 5426 rooms
- 2507 rooms
- 778 rooms
- 1099+ rooms
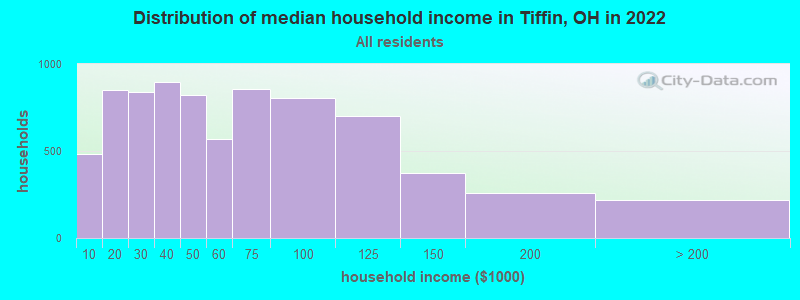
Tiffin, OH household income distribution

- 485Less than $10,000
- 852$10,000 to $19,999
- 839$20,000 to $29,999
- 895$30,000 to $39,999
- 823$40,000 to $49,999
- 570$50,000 to $59,999
- 858$60,000 to $74,999
- 804$75,000 to $99,999
- 704$100,000 to $124,999
- 371$125,000 to $149,999
- 257$150,000 to $199,999
- 220$200,000 or more
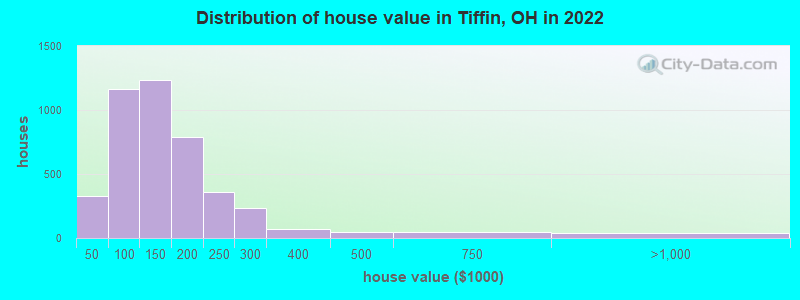
Home value of owner - occupied houses in 2022 in Tiffin, OH
-
- 12$10,000 to $14,999
- 39$15,000 to $19,999
- 82$20,000 to $24,999
- 17$25,000 to $29,999
- 11$30,000 to $34,999
- 63$35,000 to $39,999
- 98$40,000 to $49,999
- 30$50,000 to $59,999
- 149$60,000 to $69,999
- 291$70,000 to $79,999
- 290$80,000 to $89,999
- 303$90,000 to $99,999
- 675$100,000 to $124,999
- 556$125,000 to $149,999
- 422$150,000 to $174,999
- 364$175,000 to $199,999
- 359$200,000 to $249,999
- 235$250,000 to $299,999
- 74$300,000 to $399,999
- 49$400,000 to $499,999
- 47$500,000 to $749,999
- 29$750,000 to $999,999
- 10$1,000,000 to $1,499,999
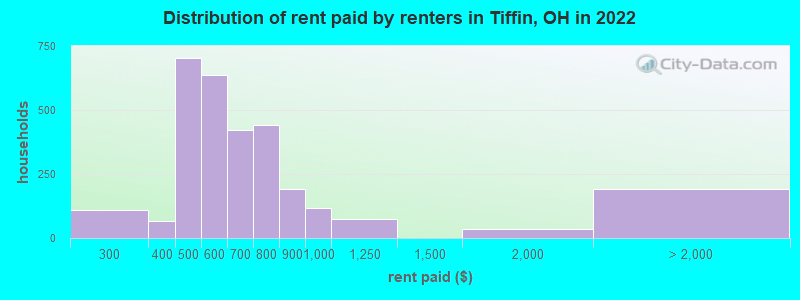
Rent paid by renters in 2022 in Tiffin, OH
-
- 5$100 to $149
- 75$200 to $249
- 34$250 to $299
- 27$300 to $349
- 39$350 to $399
- 481$400 to $449
- 220$450 to $499
- 352$500 to $549
- 282$550 to $599
- 193$600 to $649
- 226$650 to $699
- 217$700 to $749
- 222$750 to $799
- 192$800 to $899
- 118$900 to $999
- 74$1,000 to $1,249
- 33$1,500 to $1,999
- 7$2,000 to $2,499
- 185No cash rent
Percentage of workers working in this county: 77.2%
Number of people working at home: 715 (8.2% of all workers)
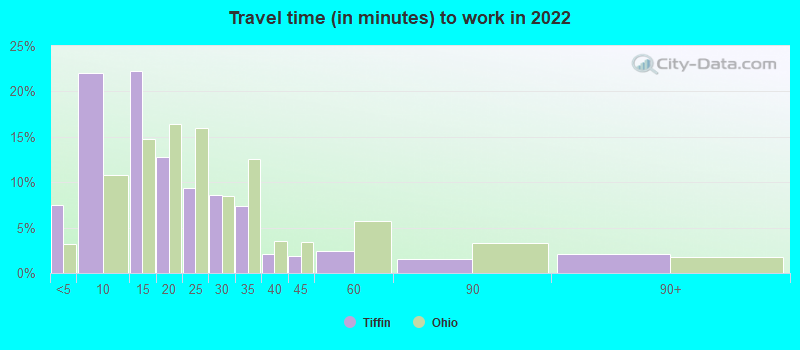
Travel time to work (commute)
- Less than 5 minutes: 558
- 5 to 9 minutes: 2,273
- 10 to 14 minutes: 1,802
- 15 to 19 minutes: 745
- 20 to 24 minutes: 297
- 25 to 29 minutes: 551
- 30 to 34 minutes: 619
- 35 to 39 minutes: 167
- 40 to 44 minutes: 181
- 45 to 59 minutes: 301
- 60 to 89 minutes: 161
- 90 or more minutes: 144
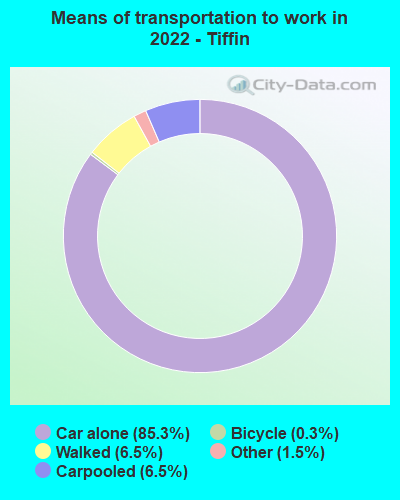
Means of transportation to work:
- Drove a car alone: 8,822 (77.7%)
- Carpooled: 718 (6.3%)
- Taxi: 186 (1.6%)
- Bicycle: 29 (0.3%)
- Walked: 678 (6.0%)
- Worked at home: 715 (6.3%)
- Unemployment by race in 2022
- Unemployment rate for White non-Hispanic residents
- 3.3%Males
- 2.6%Females
- Unemployment rate for Black residents
- 15.0%Males
- 16.8%Females
- Unemployment rate for other race residents
- 29.9%Males
- 15.3%Females
- Unemployment rate for two or more race residents
- 3.2%Males
- Unemployment rate for Hispanic or Latino residents
- 10.6%Males
- 5.7%Females
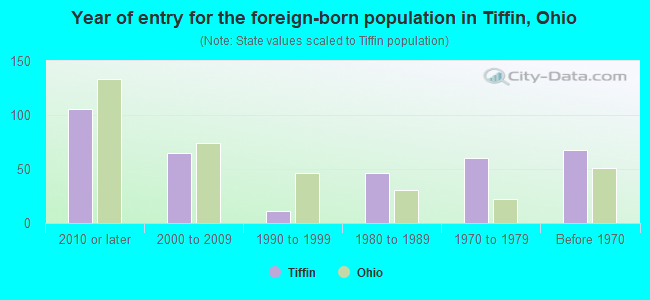
- Year of entry for the foreign-born population in Tiffin, Ohio
- 1062010 or later
- 652000 to 2009
- 111990 to 1999
- 461980 to 1989
- 601970 to 1979
- 68Before 1970
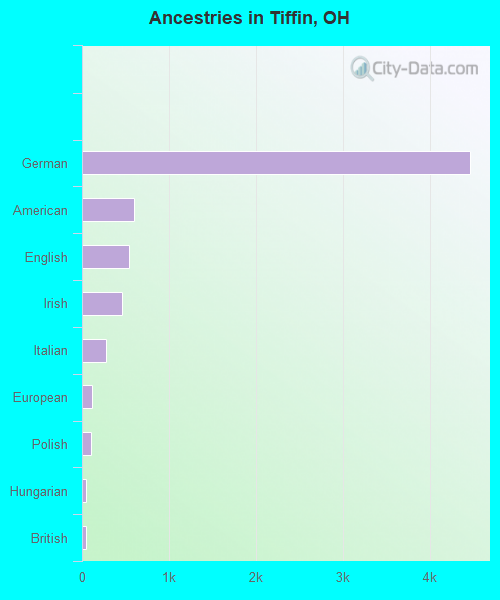
First ancestries reported:
- German: 4,457 (52.2%)
- American: 600 (7.0%)
- English: 537 (6.3%)
- Irish: 456 (5.3%)
- Italian: 271 (3.2%)
- European: 115 (1.3%)
- Polish: 102 (1.2%)
- Hungarian: 51 (0.6%)
- British: 43 (0.5%)
- Dutch: 39 (0.5%)
- Canadian: 27 (0.3%)
- Kenyan: 26 (0.3%)
- Austrian: 24 (0.3%)
- Greek: 20 (0.2%)
- Latvian: 20 (0.2%)
- Northern European: 20 (0.2%)
- French: 19 (0.2%)
- Swiss: 19 (0.2%)
- Norwegian: 18 (0.2%)
- Scotch-Irish: 16 (0.2%)
- Belgian: 14 (0.2%)
- Albanian: 13 (0.2%)
- Scottish: 13 (0.2%)
- Portuguese: 12 (0.1%)
- African: 12 (0.1%)
- Eastern European: 10 (0.1%)
- French Canadian: 10 (0.1%)
- Slovak: 10 (0.1%)
- Yugoslavian: 9 (0.1%)
- Swedish: 8 (0.09%)
- Danish: 7 (0.08%)
- Welsh: 7 (0.08%)
- Icelander: 6 (0.07%)
- Croatian: 1 (0.01%)
Most common places of birth for foreign-born residents (%):
| Tiffin: | 14.2% (41) |
| Ohio: | 0.9% (5,422) |
| Tiffin: | 13.5% (39) |
| Ohio: | 11.6% (66,525) |
| Tiffin: | 12.2% (35) |
| Ohio: | 2.0% (11,398) |
| Tiffin: | 10.1% (29) |
| Ohio: | 2.2% (12,846) |
| Tiffin: | 7.6% (22) |
| Ohio: | 0.0% (168) |
| Tiffin: | 6.6% (19) |
| Ohio: | 0.6% (3,669) |
| Tiffin: | 6.2% (18) |
| Ohio: | 2.6% (14,988) |
| Tiffin: | 5.9% (17) |
| Ohio: | 0.7% (4,155) |
| Tiffin: | 5.6% (16) |
| Ohio: | 1.0% (5,979) |
| Tiffin: | 5.2% (15) |
| Ohio: | 1.0% (5,674) |
| Tiffin: | 4.5% (13) |
| Ohio: | 3.1% (17,818) |
| Tiffin: | 2.1% (6) |
| Ohio: | 7.8% (44,796) |
| Tiffin: | 1.7% (5) |
| Ohio: | 0.3% (1,793) |
| Tiffin: | 1.7% (5) |
| Ohio: | 0.1% (502) |
Place of birth for U.S.-born residents:
- This state: 15,189
- Other state: 2,291
- Northeast: 269
- Midwest: 624
- South: 847
- West: 557
82.1% of Tiffin residents lived in the same house 1 years ago.
Out of people who lived in different houses, 31.8% lived in this county.
Out of people who lived in different counties, 81.4% lived in Ohio.
| Tiffin: | 82.1% |
| State average: | 87.8% |
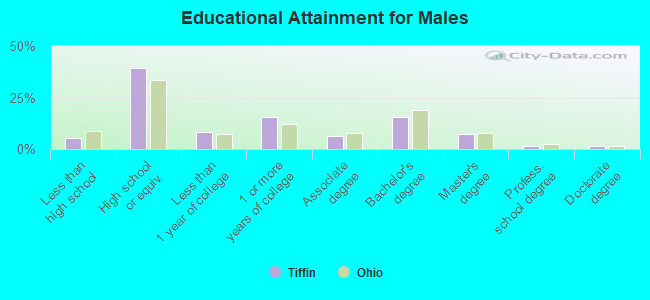
Education attainment for males 25 years and older:
- No schooling: 48
- Nursery to 4th grade: 0
- 5th and 6th grade: 0
- 7th and 8th grade: 36
- 9th grade: 28
- 10th grade: 0
- 11th grade: 55
- 12th grade, no diploma: 110
- High school graduate (or equivalency): 2,119
- Less than 1 year of college: 435
- Some college more than 1 year, no degree: 826
- Associate degree: 352
- Bachelor's degree: 826
- Master's degree: 381
- Professional school degree: 85
- Doctorate degree: 83
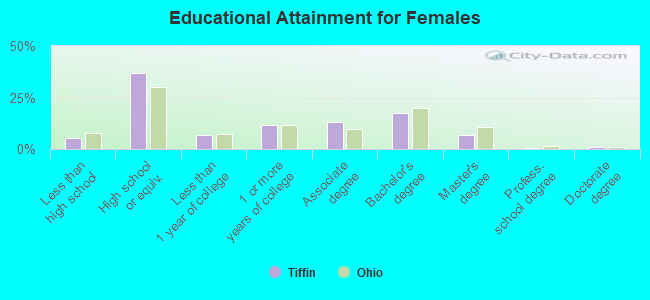
Education attainment for females 25 years and older:
- No schooling: 19
- Nursery to 4th grade: 0
- 5th and 6th grade: 11
- 7th and 8th grade: 21
- 9th grade: 54
- 10th grade: 91
- 11th grade: 75
- 12th grade, no diploma: 66
- High school graduate (or equivalency): 2,266
- Less than 1 year of college: 428
- Some college more than 1 year, no degree: 701
- Associate degree: 809
- Bachelor's degree: 1,073
- Master's degree: 403
- Professional school degree: 43
- Doctorate degree: 53
Housing units in structures:
- One, detached: 5,454
- One, attached: 460
- Two: 590
- 3 or 4: 582
- 5 to 9: 604
- 10 to 19: 168
- 20 to 49: 313
- 50 or more: 97
- Mobile homes: 169
Median worth of mobile homes: $28,450
Housing units lacking complete kitchen facilities in 2022: 5.1%
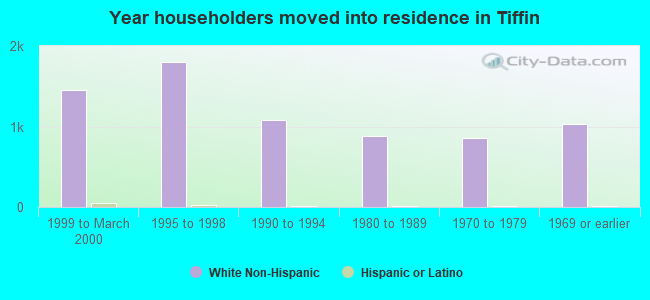
House/condo owner moved in on average 12 years ago
Renter moved in on average 5 years ago
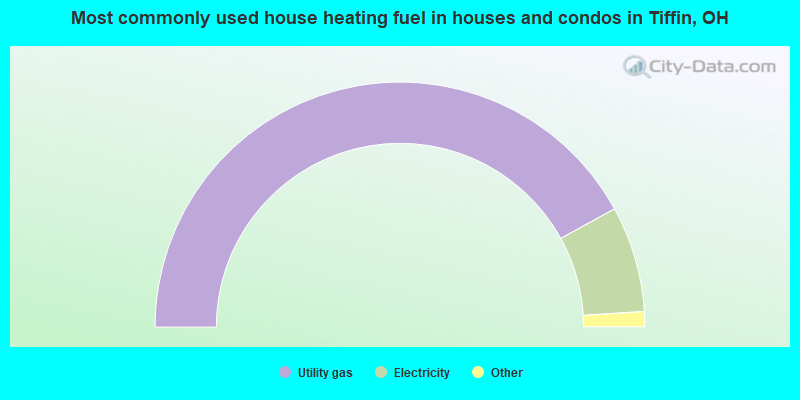
- 84.0%Utility gas
- 14.0%Electricity
- 1.2%Bottled, tank, or LP gas
- 0.4%Wood
- 0.3%Other fuel
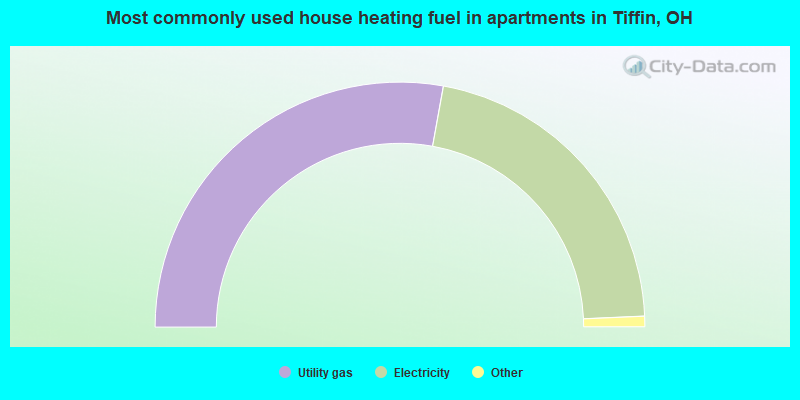
- 55.7%Utility gas
- 42.9%Electricity
- 1.0%Other fuel
- 0.4%Bottled, tank, or LP gas
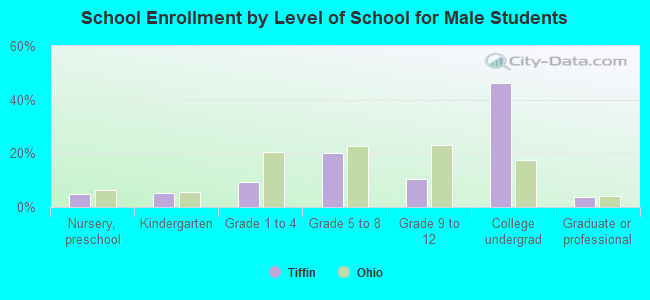
Private vs. public school enrollment:
| Here: | 12.2% |
| Ohio: | 16.0% |
| Here: | 14.0% |
| Ohio: | 13.1% |
| Here: | 74.5% |
| Ohio: | 22.3% |