Thornwood, NY (New York) Houses and Residents
| Thornwood: | $671,104 |
| New York: | $400,400 |
Mean price in 2022:
Detached houses: $975,132
Here: $975,132 State: $476,719 Townhouses or other attached units: $641,182
Here: $641,182 State: $699,270 In 2-unit structures: $613,393
Here: $613,393 State: $713,077
Total population: 3,759 (All urban)
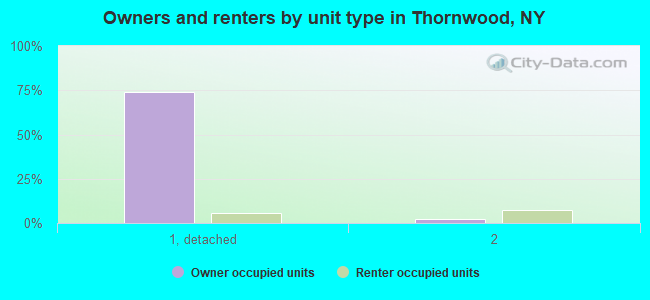
Houses: 1,475 (1,446 occupied: 1,227 owner occupied, 222 renter occupied)
| % of renters here: | 15% |
| State: | 46% |
Housing density: 434 houses/condos per square mile
Median price asked for vacant for-sale houses and condos in 2022 in this county: $406,754.
Median contract rent in 2022: $1,845 (lower quartile is $1,129, upper quartile is over $2,000)
Median gross rent in Thornwood, NY in 2022: $1,899
Housing units in Thornwood with a mortgage: 734 (133 second mortgage, 0 home equity loan, 121 both second mortgage and home equity loan)
Houses without a mortgage: 29
Median household income for houses/condos with a mortgage: $197,011
Median household income for apartments without a mortgage: $142,173
Median monthly housing costs: $2,619
Compare current foreclosures near Thornwood, NY:
| Photo | Address | Area | Beds / Baths | Price | Details |
|---|---|---|---|---|---|

|
#1
Westlake Dr
Thornwood, NY 10594
|
- sq. feet
|
3 baths 4 beds |
show details | |

|
#2
Commerce St
Thornwood, NY 10594
|
- sq. feet
|
- baths - beds |
show details | |

|
#3
Columbus Ave
Thornwood, NY 10594
|
- sq. feet
|
- baths - beds |
show details | |

|
#4
W Sidney Ave
Mount Vernon, NY 10550
|
2,800 sq. feet
|
3 baths 8 beds |
$454,900
|
show details |

|
#5
N Broadway Apt A6
Yonkers, NY 10701
|
950 sq. feet
|
2 baths 2 beds |
$219,900
|
show details |

|
#6
Limerick St
Stamford, CT 06902
|
1,382 sq. feet
|
4 baths 5 beds |
$919,900
|
show details |

|
#7
Riverdale Ave
Port Chester, NY 10573
|
1,616 sq. feet
|
1 baths 3 beds |
$645,000
|
show details |

|
#8
E 221st St
Bronx, NY 10467
|
1,890 sq. feet
|
2 baths 3 beds |
$554,900
|
show details |

|
#9
N Broadway
Irvington, NY 10533
|
850 sq. feet
|
1 baths 2 beds |
$315,000
|
show details |

|
#10
Lenni Lenape Ct
Stony Point, NY 10980
|
3,252 sq. feet
|
3 baths 4 beds |
$699,900
|
show details |
| Photo | Address | Area | Beds / Baths | Price | Details |
|---|---|---|---|---|---|

|
#11
Chalmers Blvd
Amawalk, NY 10501
|
1,072 sq. feet
|
1 baths 1 beds |
$475,000
|
show details |

|
#12
Davenport Ave Apt 1b
New Rochelle, NY 10805
|
750 sq. feet
|
1 baths 1 beds |
$159,900
|
show details |

|
#13
N Riverside Ave
Croton On Hudson, NY 10520
|
1,642 sq. feet
|
2 baths 3 beds |
$585,000
|
show details |

|
#14
Midland Ave Apt 4h
Bronxville, NY 10708
|
900 sq. feet
|
1 baths 1 beds |
$184,000
|
show details |

|
#15
N Main St Apt C-15
Spring Valley, NY 10977
|
800 sq. feet
|
1 baths 1 beds |
$85,000
|
show details |

|
#16
Crane Ave
White Plains, NY 10603
|
2,400 sq. feet
|
2 baths 4 beds |
$654,500
|
show details |

|
#17
Croton Park Rd
Cortlandt Manor, NY 10567
|
658 sq. feet
|
1 baths 1 beds |
$176,900
|
show details |

|
#18
Sylvan Knoll Rd
Stamford, CT 06902
|
1,100 sq. feet
|
1 baths 2 beds |
$339,900
|
show details |

|
#19
Martin Dr
Harrington Park, NJ 07640
|
1,746 sq. feet
|
3 baths 3 beds |
$950,000
|
show details |

|
#20
Central Park Ave Apt 9m
Yonkers, NY 10710
|
1,300 sq. feet
|
2 baths 3 beds |
$319,900
|
show details |
| Photo | Address | Area | Beds / Baths | Price | Details |
|---|---|---|---|---|---|

|
#21
Marietta Ave
Thornwood, NY 10594
|
- sq. feet
|
- baths - beds |
show details | |

|
#22
Talmadge Hill Rd
Darien, CT 06820
|
- sq. feet
|
4 baths 5 beds |
$2,395,000
|
show details |

|
#23
Raven Ct
Armonk, NY 10504
|
- sq. feet
|
2 baths 3 beds |
$1,560,000
|
show details |

|
#24
Arlington Ave Apt 11n
Bronx, NY 10471
|
500 sq. feet
|
- baths 1 beds |
$182,500
|
show details |

|
#25
Tuttle St
Stamford, CT 06902
|
- sq. feet
|
1 baths 3 beds |
$262,500
|
show details |

|
#26
Overbrook Dr
Stamford, CT 06906
|
2,679 sq. feet
|
3 baths 4 beds |
show details | |

|
#27
John St
Ossining, NY 10562
|
1,536 sq. feet
|
2 baths 4 beds |
show details | |

|
#28
Leewood Cir Apt 7r
Eastchester, NY 10709
|
- sq. feet
|
1 baths 2 beds |
show details | |

|
#29
S 9th Ave
Mount Vernon, NY 10550
|
3,574 sq. feet
|
3 baths 6 beds |
show details | |

|
#30
James St
Stony Point, NY 10980
|
1,134 sq. feet
|
1 baths 2 beds |
show details |
| Photo | Address | Area | Beds / Baths | Price | Details |
|---|---|---|---|---|---|

|
#31
E 3rd St
Mount Vernon, NY 10553
|
3,366 sq. feet
|
5 baths 9 beds |
show details | |

|
#32
Palmer Rd
Yonkers, NY 10701
|
2,392 sq. feet
|
3 baths 8 beds |
show details | |

|
#33
Lea Ct
Pomona, NY 10970
|
3,188 sq. feet
|
3 baths 5 beds |
show details | |

|
#34
Renaissance Sq
White Plains, NY 10601
|
1,658 sq. feet
|
3 baths 2 beds |
show details | |

|
#35
Lafayette Ave
Westwood, NJ 07675
|
616 sq. feet
|
1 baths 3 beds |
show details | |

|
#36
Kings Hwy
Valley Cottage, NY 10989
|
1,754 sq. feet
|
3 baths 4 beds |
show details | |

|
#37
Zarriello Ln
West Haverstraw, NY 10993
|
1,350 sq. feet
|
2 baths 3 beds |
show details | |

|
#38
Captain Shankey Dr
Garnerville, NY 10923
|
981 sq. feet
|
1 baths 2 beds |
show details | |

|
#39
Estates Dr
Ossining, NY 10562
|
3,293 sq. feet
|
3 baths 4 beds |
show details | |

|
#40
Amory Ave
Pearl River, NY 10965
|
1,730 sq. feet
|
2 baths 3 beds |
show details |
| Photo | Address | Area | Beds / Baths | Price | Details |
|---|---|---|---|---|---|

|
#41
Soundview Ave Unit 60
Stamford, CT 06902
|
2,189 sq. feet
|
1 baths 3 beds |
show details | |

|
#42
Oakwood Dr
Woodcliff Lake, NJ 07677
|
2,605 sq. feet
|
2 baths 3 beds |
show details | |

|
#43
Hillside Ave
Yonkers, NY 10703
|
2,436 sq. feet
|
3 baths 6 beds |
show details | |

|
#44
Quince Lane Aka 41 N. Quince Lane
Monsey, NY 10952
|
4,522 sq. feet
|
5 baths 8 beds |
show details | |

|
#45
Prescott Ave
White Plains, NY 10606
|
3,833 sq. feet
|
3 baths 5 beds |
show details | |

|
#46
Mcmullen Ave
Stamford, CT 06902
|
2,828 sq. feet
|
3 baths 8 beds |
show details | |

|
#47
Edson Ave
Bronx, NY 10466
|
2,160 sq. feet
|
2 baths 6 beds |
show details | |

|
#48
Portland Pl
Yonkers, NY 10703
|
- sq. feet
|
3 baths 6 beds |
show details | |

|
#49
Zarriello Ln
West Haverstraw, NY 10993
|
1,350 sq. feet
|
2 baths 3 beds |
show details | |

|
Check over 1 million property listings on Foreclosure.com!
|
browse all offers | |||


 | Upper Middle class african-american communities in ny (2052 replies) |
| Scarsdale vs Bronxville (35 replies) |
| $500k budget - looking for house with great school district (30 replies) |
| Croton, Thornwood, Pleasantville, or Yorktown? (87 replies) |
| Where to live in Northern Westchester with activities (10 replies) |
| not-so-great-house/good schools vs. good house/not-so-great-schools (29 replies) |
Median year apartment built: 1977
Household type by relationship:
Households: 4,363- Male householders: 765 (157 living alone), Female householders: 652 (88 living alone)
1,058 spouses (1,058 opposite-sex spouses), 85 unmarried partners, (74 opposite-sex unmarried partners), 1,537 children (1,482 natural, 0 adopted, 54 stepchildren), 41 grandchildren, 18 brothers or sisters, 37 parents, 0 foster children, 68 other relatives, 19 non-relatives
- In group quarters: 78
Size of family households: 404 2-persons, 173 3-persons, 355 4-persons, 116 5-persons, 8 6-persons, 25 7-or-more-persons.
Size of nonfamily households: 267 1-person, 81 2-persons, 12 4-persons.
870 married couples with children.
16 single-parent households (0 men, 16 women).
82.1% of residents of Thornwood speak English at home.
5.8% of residents speak Spanish at home (75% speak English very well, 17% speak English well, 9% speak English not well).
6.6% of residents speak other Indo-European language at home (72% speak English very well, 4% speak English well, 24% speak English not well).
5.6% of residents speak Asian or Pacific Island language at home (96% speak English very well, 4% speak English not well).
Foreign born population: 548 (12.6%)
(76.6% of them are naturalized citizens)
| Here: | 6.7 |
| State: | 6.3 |
| Here: | 4.2 |
| State: | 3.8 |
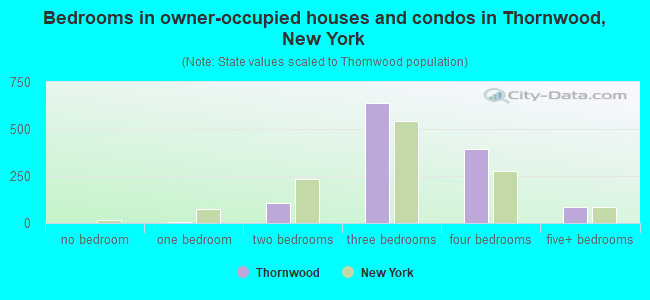
- Bedrooms in owner-occupied houses and condos in Thornwood, New York
- 0no bedroom
- 61 bedroom
- 1082 bedrooms
- 6403 bedrooms
- 3914 bedrooms
- 835+ bedrooms
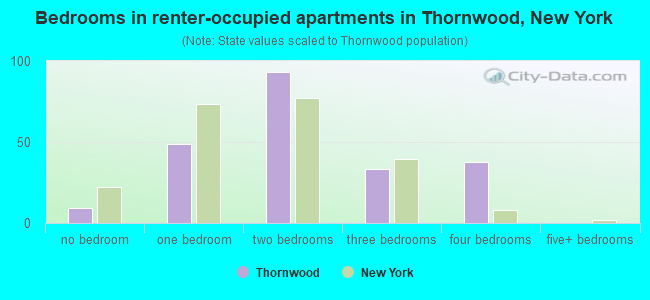
- Bedrooms in renter-occupied apartments in Thornwood, New York
- 9no bedroom
- 491 bedroom
- 932 bedrooms
- 343 bedrooms
- 384 bedrooms
- 05+ bedrooms
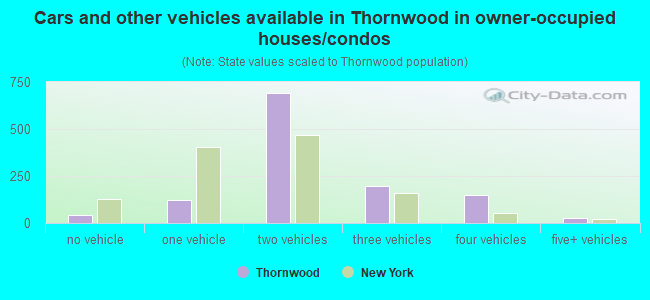
- Cars and other vehicles available in Thornwood in owner-occupied houses/condos
- 41no vehicle
- 1201 vehicle
- 6922 vehicles
- 1953 vehicles
- 1514 vehicles
- 295+ vehicles
- Cars and other vehicles available in Thornwood in renter-occupied apartments
- 20no vehicle
- 801 vehicle
- 912 vehicles
- 303 vehicles
- 04 vehicles
- 05+ vehicles
- Rooms in owner-occupied houses in Thornwood, New York
- 01 room
- 02 rooms
- 53 rooms
- 404 rooms
- 705 rooms
- 4466 rooms
- 1517 rooms
- 2148 rooms
- 3029+ rooms
- Rooms in renter-occupied apartments in Thornwood, New York
- 91 room
- 392 rooms
- 93 rooms
- 714 rooms
- 335 rooms
- 246 rooms
- 07 rooms
- 388 rooms
- 09+ rooms
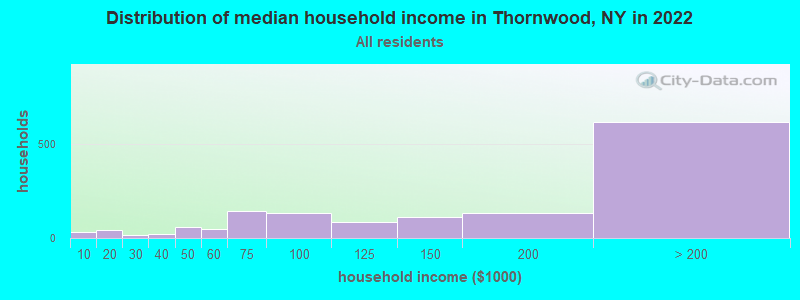
Thornwood, NY household income distribution

- 34Less than $10,000
- 42$10,000 to $19,999
- 14$20,000 to $29,999
- 20$30,000 to $39,999
- 56$40,000 to $49,999
- 48$50,000 to $59,999
- 142$60,000 to $74,999
- 135$75,000 to $99,999
- 83$100,000 to $124,999
- 110$125,000 to $149,999
- 135$150,000 to $199,999
- 618$200,000 or more
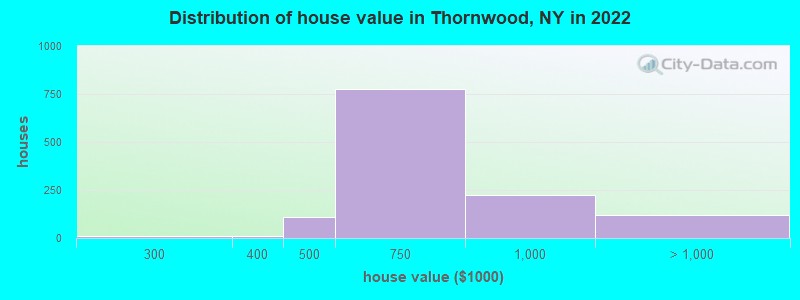
Home value of owner - occupied houses in 2022 in Thornwood, NY
-
- 10$250,000 to $299,999
- 8$300,000 to $399,999
- 108$400,000 to $499,999
- 777$500,000 to $749,999
- 221$750,000 to $999,999
- 64$1,000,000 to $1,499,999
- 45$1,500,000 to $1,999,999
- 11$2,000,000 or more
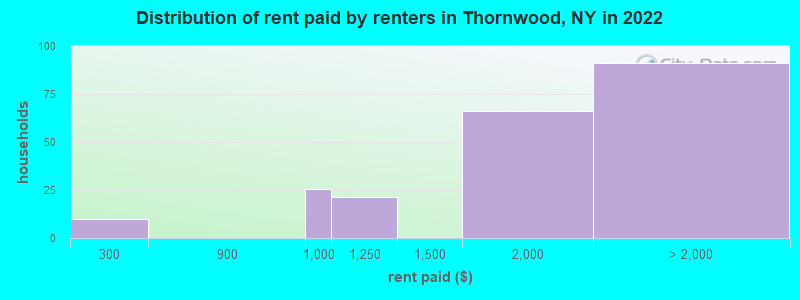
Rent paid by renters in 2022 in Thornwood, NY
-
- 9$200 to $249
- 25$900 to $999
- 21$1,000 to $1,249
- 66$1,500 to $1,999
- 19$2,000 to $2,499
- 38$2,500 to $2,999
- 32$3,500 or more
Percentage of workers working in this county: 76.1%
Number of people working at home: 336 (14.7% of all workers)
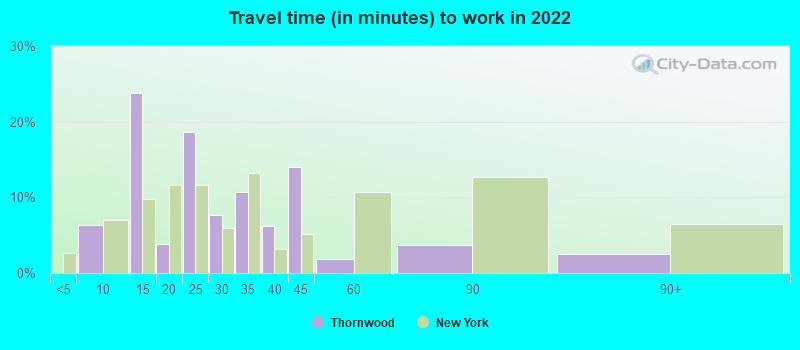
Travel time to work (commute)
- Less than 5 minutes: 67
- 5 to 9 minutes: 92
- 10 to 14 minutes: 310
- 15 to 19 minutes: 267
- 20 to 24 minutes: 230
- 25 to 29 minutes: 300
- 30 to 34 minutes: 201
- 35 to 39 minutes: 50
- 40 to 44 minutes: 21
- 45 to 59 minutes: 35
- 60 to 89 minutes: 204
- 90 or more minutes: 161
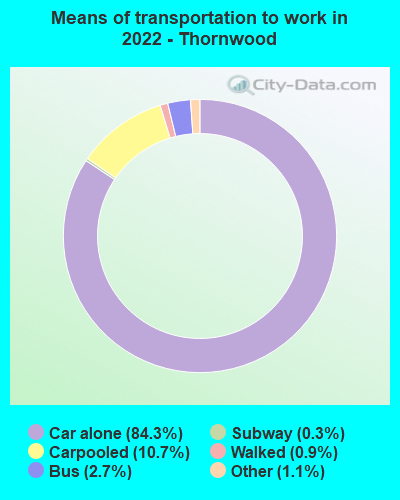
Means of transportation to work:
- Drove a car alone: 831 (63.1%)
- Carpooled: 107 (8.1%)
- Bus: 22 (1.7%)
- Long-distance train or commuter rail: 2 (0.2%)
- Taxi: 19 (1.4%)
- Walked: 9 (0.7%)
- Worked at home: 336 (25.5%)
- Unemployment by race in 2022
- Unemployment rate for White non-Hispanic residents
- 0.7%Males
- Unemployment rate for other race residents
- 20.5%Males
- 53.6%Females
- Unemployment rate for Hispanic or Latino residents
- 7.7%Males
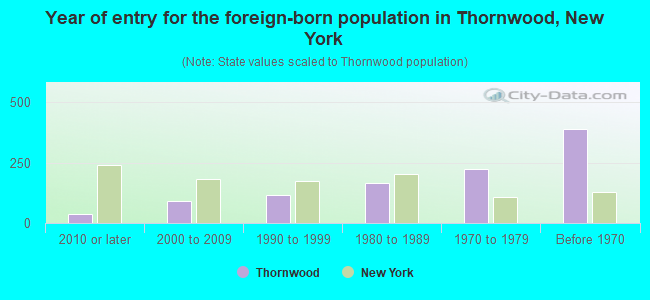
- Year of entry for the foreign-born population in Thornwood, New York
- 392010 or later
- 932000 to 2009
- 1171990 to 1999
- 1681980 to 1989
- 2251970 to 1979
- 390Before 1970
First ancestries reported:
- Italian: 758 (42.5%)
- Albanian: 140 (7.8%)
- Irish: 125 (7.0%)
- German: 117 (6.6%)
- American: 90 (5.0%)
- European: 23 (1.3%)
- English: 16 (0.9%)
- Eastern European: 14 (0.8%)
- Portuguese: 14 (0.8%)
- French Canadian: 13 (0.7%)
- Celtic: 12 (0.7%)
- Belgian: 11 (0.6%)
- Brazilian: 11 (0.6%)
- Greek: 11 (0.6%)
- Czech: 9 (0.5%)
- African: 9 (0.5%)
- Scottish: 8 (0.4%)
- Polish: 7 (0.4%)
- Jamaican: 7 (0.4%)
- Northern European: 6 (0.3%)
- Dutch: 5 (0.3%)
- Norwegian: 4 (0.2%)
Most common places of birth for foreign-born residents (%):
| Thornwood: | 20.1% (109) |
| New York: | 3.5% (158,432) |
| Thornwood: | 16.0% (87) |
| New York: | 4.8% (214,559) |
| Thornwood: | 12.9% (70) |
| New York: | 1.8% (81,374) |
| Thornwood: | 11.4% (62) |
| New York: | 0.7% (30,173) |
| Thornwood: | 7.4% (40) |
| New York: | 3.9% (177,448) |
| Thornwood: | 4.6% (25) |
| New York: | 1.4% (62,442) |
| Thornwood: | 4.4% (24) |
| New York: | 2.0% (91,070) |
| Thornwood: | 4.1% (22) |
| New York: | 0.0% (1,860) |
| Thornwood: | 3.5% (19) |
| New York: | 0.6% (26,772) |
| Thornwood: | 2.9% (16) |
| New York: | 0.5% (23,242) |
| Thornwood: | 2.2% (12) |
| New York: | 2.5% (111,920) |
| Thornwood: | 1.8% (10) |
| New York: | 0.2% (10,519) |
| Thornwood: | 1.8% (10) |
| New York: | 5.0% (227,557) |
| Thornwood: | 1.7% (9) |
| New York: | 1.4% (61,245) |
Place of birth for U.S.-born residents:
- This state: 3,171
- Other state: 603
- Northeast: 457
- Midwest: 79
- South: 10
- West: 40
93.3% of Thornwood residents lived in the same house 1 years ago.
Out of people who lived in different houses, 36.2% lived in this county.
Out of people who lived in different counties, 37.6% lived in New York.
| Thornwood: | 93.3% |
| State average: | 89.6% |
Education attainment for males 25 years and older:
- No schooling: 52
- Nursery to 4th grade: 0
- 5th and 6th grade: 16
- 7th and 8th grade: 0
- 9th grade: 0
- 10th grade: 0
- 11th grade: 24
- 12th grade, no diploma: 26
- High school graduate (or equivalency): 173
- Less than 1 year of college: 101
- Some college more than 1 year, no degree: 171
- Associate degree: 218
- Bachelor's degree: 389
- Master's degree: 243
- Professional school degree: 66
- Doctorate degree: 19
Education attainment for females 25 years and older:
- No schooling: 29
- Nursery to 4th grade: 0
- 5th and 6th grade: 5
- 7th and 8th grade: 9
- 9th grade: 0
- 10th grade: 9
- 11th grade: 0
- 12th grade, no diploma: 0
- High school graduate (or equivalency): 319
- Less than 1 year of college: 99
- Some college more than 1 year, no degree: 58
- Associate degree: 112
- Bachelor's degree: 539
- Master's degree: 367
- Professional school degree: 32
- Doctorate degree: 9
Housing units in structures:
- One, detached: 1,214
- One, attached: 11
- Two: 101
- 3 or 4: 74
- 5 to 9: 18
- 10 to 19: 23
- 20 to 49: 20
- 50 or more: 11
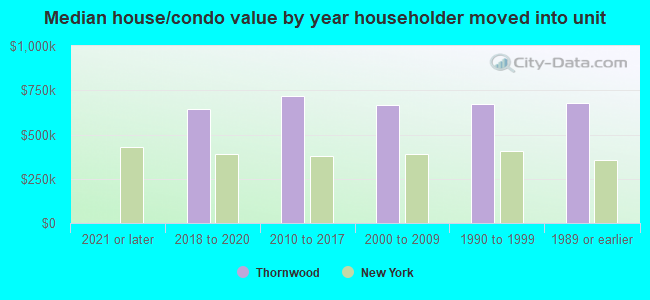
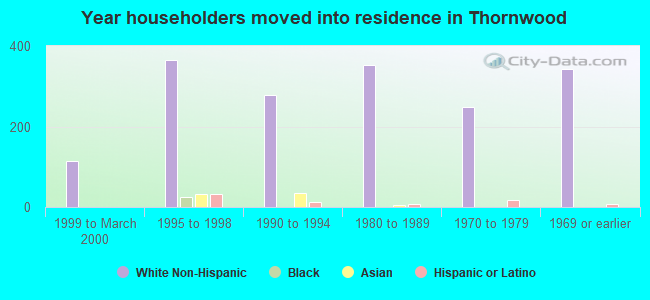
House/condo owner moved in on average 17 years ago
Renter moved in on average 4 years ago
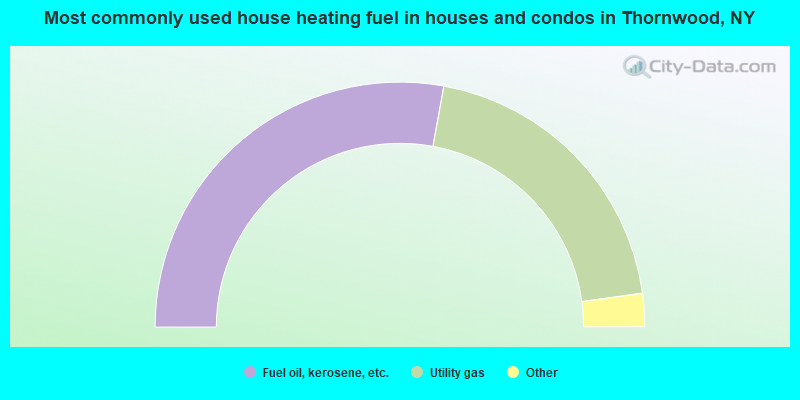
- 55.8%Fuel oil, kerosene, etc.
- 39.9%Utility gas
- 1.7%Electricity
- 1.6%Bottled, tank, or LP gas
- 1.0%Wood
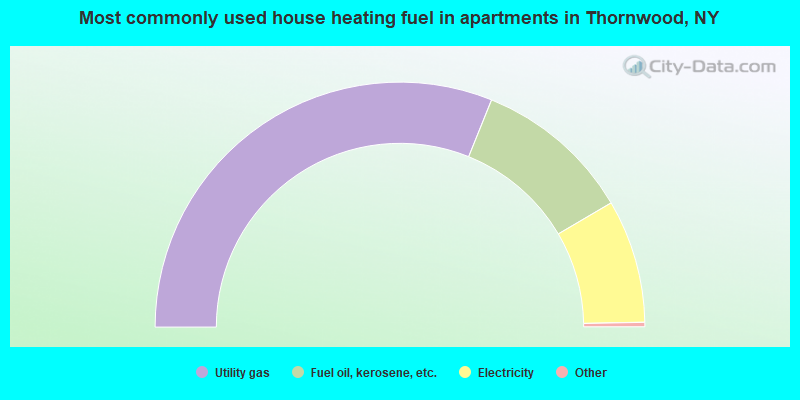
- 62.6%Utility gas
- 21.0%Fuel oil, kerosene, etc.
- 16.4%Electricity
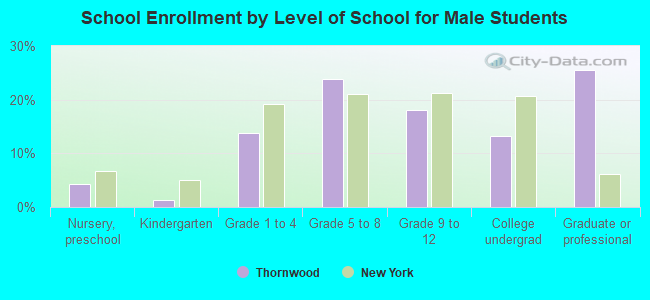
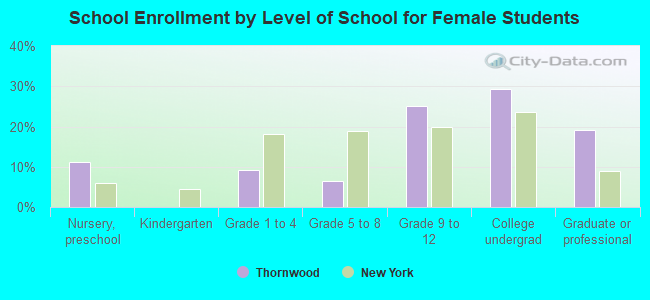
Private vs. public school enrollment:
| Here: | 7.3% |
| New York: | 15.6% |
| Here: | 17.1% |
| New York: | 15.0% |
| Here: | 26.4% |
| New York: | 39.2% |