Thiensville, WI (Wisconsin) Houses and Residents
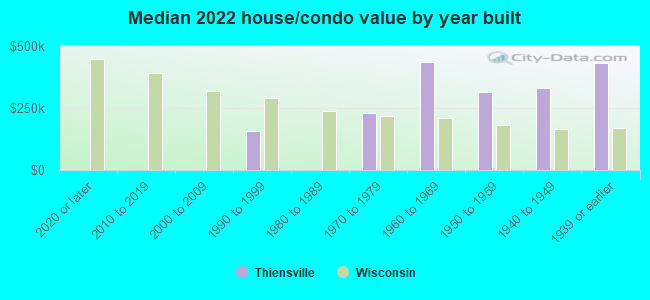
| Thiensville: | $344,976 |
| Wisconsin: | $252,800 |
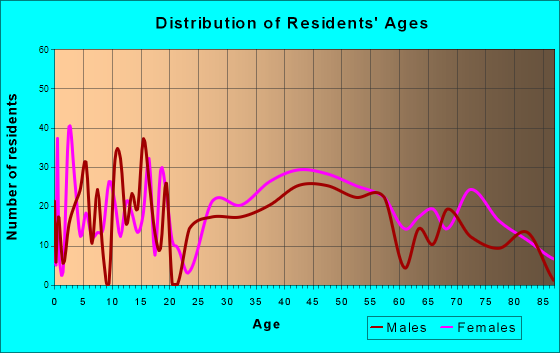
Total population: 3,186 (All urban)
Houses: 1,619 (1,611 occupied: 1,076 owner occupied, 578 renter occupied)
| % of renters here: | 35% |
| State: | 32% |
Housing density: 1,475 houses/condos per square mile
Median price asked for vacant for-sale houses and condos in 2022 in this county: $317,172.
Median contract rent in 2022: $1,113 (lower quartile is $864, upper quartile is $1,478)
Median rent asked for vacant for-rent units in 2022: $1,148
Median gross rent in Thiensville, WI in 2022: $1,224
Housing units in Thiensville with a mortgage: 643 (86 second mortgage, 0 home equity loan, 83 both second mortgage and home equity loan)
Houses without a mortgage: 11
Median household income for houses/condos with a mortgage: $112,636
Median household income for apartments without a mortgage: $65,817
Median monthly housing costs: $1,175
Compare current foreclosures near Thiensville, WI:
| Photo | Address | Area | Beds / Baths | Price | Details |
|---|---|---|---|---|---|

|
#1
N Port Washington Rd # 231
Thiensville, WI 53092
|
- sq. feet
|
- baths - beds |
show details | |

|
#2
Kasota Ct
Thiensville, WI 53092
|
- sq. feet
|
- baths - beds |
show details | |

|
#3
N Weston Dr, Apt 209
Thiensville, WI 53092
|
- sq. feet
|
- baths - beds |
show details | |

|
#4
W River Birch Dr
Thiensville, WI 53092
|
- sq. feet
|
- baths - beds |
show details | |

|
#5
Concord Pl Apt 5
Thiensville, WI 53092
|
- sq. feet
|
- baths - beds |
show details | |

|
#6
N 25th St
Milwaukee, WI 53206
|
854 sq. feet
|
1 baths 2 beds |
$129,900
|
show details |

|
#7
S 47th St
Milwaukee, WI 53219
|
826 sq. feet
|
1 baths 2 beds |
$167,000
|
show details |

|
#8
N 54th St
Milwaukee, WI 53210
|
1,700 sq. feet
|
2 baths 4 beds |
$248,900
|
show details |

|
#9
N 84th St
Milwaukee, WI 53222
|
3,046 sq. feet
|
2 baths 6 beds |
$116,500
|
show details |

|
#10
N 44th St
Milwaukee, WI 53210
|
1,885 sq. feet
|
2 baths 4 beds |
$79,900
|
show details |
| Photo | Address | Area | Beds / Baths | Price | Details |
|---|---|---|---|---|---|

|
#11
W Thurston Ct
Milwaukee, WI 53218
|
1,909 sq. feet
|
2 baths 5 beds |
$245,000
|
show details |

|
#12
N Country View Dr
Thiensville, WI 53092
|
- sq. feet
|
- baths - beds |
show details | |

|
#13
N Bobolink Ln
Thiensville, WI 53092
|
- sq. feet
|
- baths - beds |
show details | |

|
#14
W El Rancho Dr
Thiensville, WI 53092
|
- sq. feet
|
- baths - beds |
show details | |

|
#15
W Sierra Ln
Thiensville, WI 53092
|
- sq. feet
|
- baths - beds |
show details | |

|
#16
N Balsam Tree Ct # 38
Thiensville, WI 53092
|
- sq. feet
|
- baths - beds |
show details | |

|
#17
S 15th Pl
Milwaukee, WI 53215
|
- sq. feet
|
2 baths 5 beds |
$86,300
|
show details |

|
#18
N 66th St
Milwaukee, WI 53218
|
- sq. feet
|
2 baths 6 beds |
$156,750
|
show details |

|
#19
W Nash St
Milwaukee, WI 53206
|
1,581 sq. feet
|
2 baths 3 beds |
show details | |

|
#20
N 42nd St
Milwaukee, WI 53216
|
- sq. feet
|
1 baths 4 beds |
show details |
| Photo | Address | Area | Beds / Baths | Price | Details |
|---|---|---|---|---|---|

|
#21
N 85th St
Milwaukee, WI 53222
|
2,031 sq. feet
|
2 baths 5 beds |
show details | |

|
#22
W Melvina St
Milwaukee, WI 53222
|
1,064 sq. feet
|
1 baths 3 beds |
show details | |

|
#23
N 74th St
Milwaukee, WI 53218
|
1,110 sq. feet
|
1 baths 4 beds |
show details | |

|
#24
S 98th St
Milwaukee, WI 53227
|
816 sq. feet
|
1 baths 2 beds |
show details | |

|
#25
N 84th St
Milwaukee, WI 53225
|
939 sq. feet
|
1 baths 3 beds |
show details | |

|
#26
S 80th St
Milwaukee, WI 53214
|
1,876 sq. feet
|
1 baths 2 beds |
show details | |

|
#27
N 6th St
Milwaukee, WI 53212
|
972 sq. feet
|
1 baths 2 beds |
show details | |

|
#28
W Cleveland Ave
Milwaukee, WI 53219
|
1,263 sq. feet
|
1 baths 3 beds |
show details | |

|
#29
N 83rd St
Milwaukee, WI 53218
|
2,066 sq. feet
|
2 baths 6 beds |
show details | |

|
#30
N 42nd St
Milwaukee, WI 53209
|
796 sq. feet
|
1 baths 3 beds |
show details |
| Photo | Address | Area | Beds / Baths | Price | Details |
|---|---|---|---|---|---|

|
#31
N 47th St
Milwaukee, WI 53208
|
1,988 sq. feet
|
2 baths 5 beds |
show details | |

|
#32
N 64th St
Milwaukee, WI 53218
|
1,214 sq. feet
|
1 baths 2 beds |
show details | |

|
#33
N 29th St
Milwaukee, WI 53216
|
1,713 sq. feet
|
2 baths 4 beds |
show details | |

|
#34
W Chambers St
Milwaukee, WI 53212
|
1,067 sq. feet
|
1 baths 3 beds |
show details | |

|
#35
Creekside Pl
West Bend, WI 53095
|
2,822 sq. feet
|
2 baths 4 beds |
show details | |

|
#36
Williams Ct
Brookfield, WI 53045
|
1,683 sq. feet
|
2 baths 3 beds |
show details | |

|
#37
Creekwood Ln
West Bend, WI 53095
|
1,780 sq. feet
|
2 baths 3 beds |
show details | |

|
#38
Edgewater Dr
West Bend, WI 53095
|
2,230 sq. feet
|
2 baths 4 beds |
show details | |

|
#39
Minz Park Cir Apt 4
West Bend, WI 53095
|
1,098 sq. feet
|
1 baths 2 beds |
show details | |

|
#40
Tulane St
Brookfield, WI 53005
|
1,057 sq. feet
|
1 baths 2 beds |
show details |
| Photo | Address | Area | Beds / Baths | Price | Details |
|---|---|---|---|---|---|

|
#41
N 169th St
Brookfield, WI 53005
|
1,509 sq. feet
|
1 baths 3 beds |
show details | |

|
#42
Clarence Ct Apt 5
West Bend, WI 53095
|
1,204 sq. feet
|
1 baths 2 beds |
show details | |

|
#43
S Main St
West Bend, WI 53095
|
1,560 sq. feet
|
2 baths 3 beds |
show details | |

|
#44
Terrace Dr
West Bend, WI 53095
|
1,245 sq. feet
|
1 baths 3 beds |
show details | |

|
#45
Harvey Ave
Brookfield, WI 53005
|
1,512 sq. feet
|
1 baths 3 beds |
show details | |

|
#46
S Bobolink Dr
Brookfield, WI 53005
|
1,692 sq. feet
|
2 baths 7 beds |
show details | |

|
#47
Sunny Crest Dr
Brookfield, WI 53005
|
2,396 sq. feet
|
2 baths 4 beds |
show details | |

|
#48
S Indiana Ave
West Bend, WI 53095
|
1,066 sq. feet
|
1 baths 3 beds |
show details | |

|
#49
Lilly Rd
Brookfield, WI 53005
|
1,552 sq. feet
|
1 baths 3 beds |
show details | |

|
Check over 1 million property listings on Foreclosure.com!
|
browse all offers | |||

Latest news about housing in Thiensville, WI collected exclusively by city-data.com from local newspapers, TV, and radio stations

 | Recommendations on houses (4 replies) |
| Thiensville (15 replies) |
| Questions re: moving to the area and colleges (10 replies) |
| North Shore or Brookfield/Elm Grove (12 replies) |
| Do you consider Mequon to be a part of the North Shore (5 replies) |
| Renting apt in Whitefish Bay vs other areas north of Milwaukee (20 replies) |
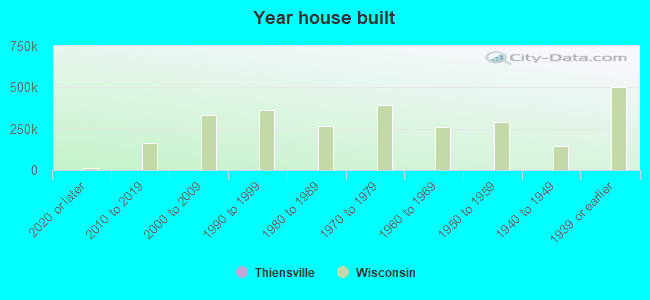
Median year apartment built: 1977
Household type by relationship:
Households: 3,324- Male householders: 779 (208 living alone), Female householders: 827 (438 living alone)
752 spouses (752 opposite-sex spouses), 77 unmarried partners, (77 opposite-sex unmarried partners), 614 children (590 natural, 0 adopted, 24 stepchildren), 48 grandchildren, 23 brothers or sisters, 25 parents, 0 foster children, 17 other relatives, 159 non-relatives
Size of family households: 472 2-persons, 232 3-persons, 82 4-persons, 84 5-persons, 10 6-persons.
Size of nonfamily households: 646 1-person, 97 2-persons, 7 4-persons, 13 5-persons.
337 married couples with children.
111 single-parent households (54 men, 57 women).
94.1% of residents of Thiensville speak English at home.
1.4% of residents speak Spanish at home (74% speak English very well, 26% speak English well).
3.5% of residents speak other Indo-European language at home (100% speak English very well).
1.2% of residents speak Asian or Pacific Island language at home (21% speak English very well, 23% speak English well, 56% speak English not well).
Foreign born population: 167 (5.0%)
(38.3% of them are naturalized citizens)
| Here: | 7.2 |
| State: | 6.5 |
| Here: | 4.3 |
| State: | 4.1 |
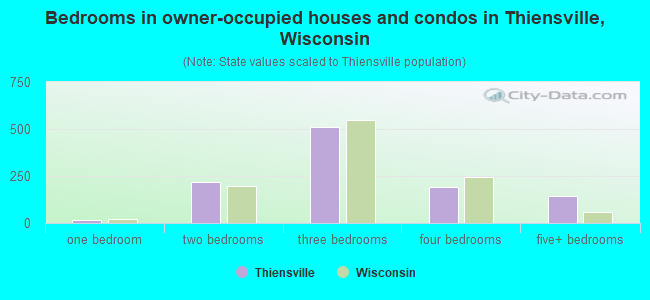
- Bedrooms in owner-occupied houses and condos in Thiensville, Wisconsin
- 0no bedroom
- 141 bedroom
- 2162 bedrooms
- 5123 bedrooms
- 1934 bedrooms
- 1415+ bedrooms
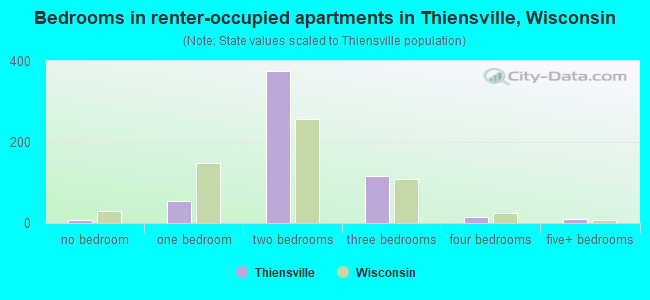
- Bedrooms in renter-occupied apartments in Thiensville, Wisconsin
- 7no bedroom
- 541 bedroom
- 3762 bedrooms
- 1173 bedrooms
- 144 bedrooms
- 105+ bedrooms
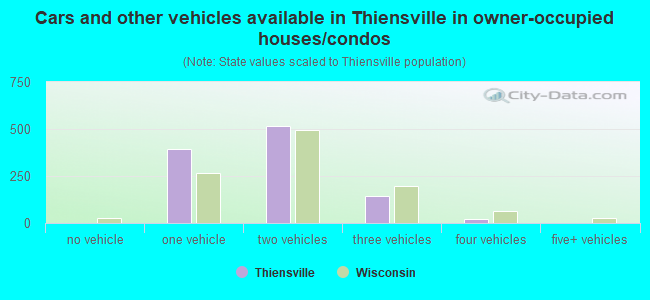
- Cars and other vehicles available in Thiensville in owner-occupied houses/condos
- 2no vehicle
- 3931 vehicle
- 5152 vehicles
- 1453 vehicles
- 214 vehicles
- 05+ vehicles
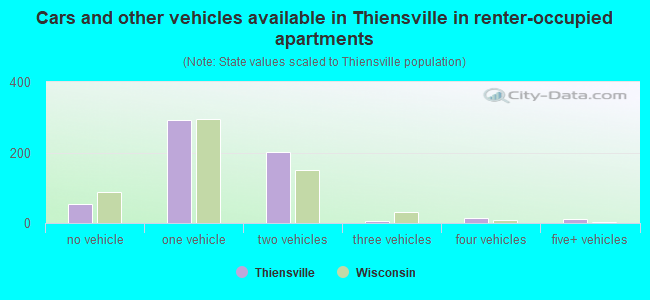
- Cars and other vehicles available in Thiensville in renter-occupied apartments
- 53no vehicle
- 2931 vehicle
- 2012 vehicles
- 63 vehicles
- 144 vehicles
- 105+ vehicles
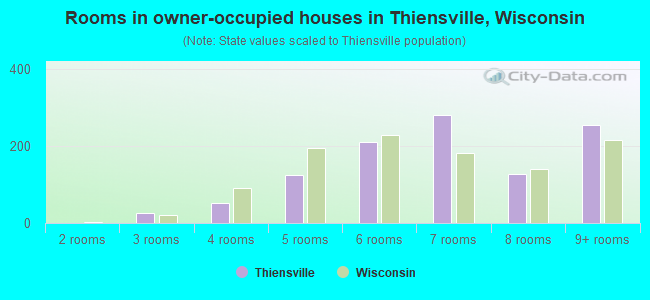
- Rooms in owner-occupied houses in Thiensville, Wisconsin
- 01 room
- 02 rooms
- 263 rooms
- 524 rooms
- 1255 rooms
- 2106 rooms
- 2817 rooms
- 1278 rooms
- 2559+ rooms
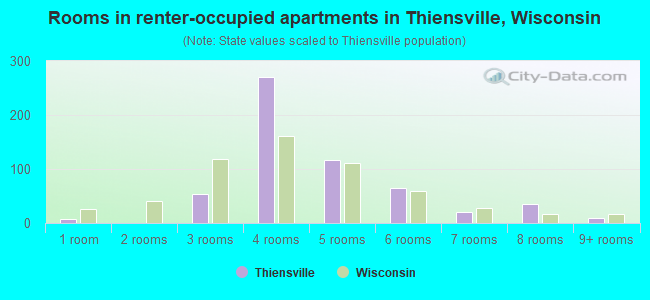
- Rooms in renter-occupied apartments in Thiensville, Wisconsin
- 71 room
- 02 rooms
- 543 rooms
- 2704 rooms
- 1165 rooms
- 646 rooms
- 217 rooms
- 358 rooms
- 109+ rooms
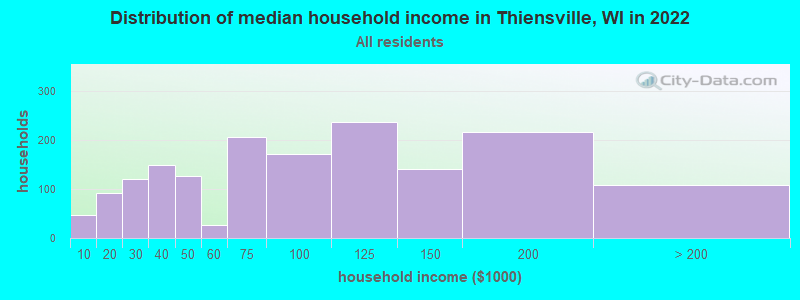
Thiensville, WI household income distribution

- 46Less than $10,000
- 91$10,000 to $19,999
- 121$20,000 to $29,999
- 150$30,000 to $39,999
- 127$40,000 to $49,999
- 27$50,000 to $59,999
- 207$60,000 to $74,999
- 171$75,000 to $99,999
- 237$100,000 to $124,999
- 141$125,000 to $149,999
- 216$150,000 to $199,999
- 108$200,000 or more
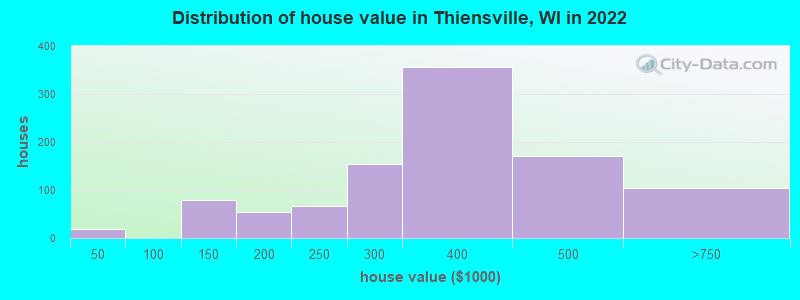
Home value of owner - occupied houses in 2022 in Thiensville, WI
-
- 1$15,000 to $19,999
- 18$20,000 to $24,999
- 31$100,000 to $124,999
- 47$125,000 to $149,999
- 42$150,000 to $174,999
- 11$175,000 to $199,999
- 67$200,000 to $249,999
- 155$250,000 to $299,999
- 355$300,000 to $399,999
- 170$400,000 to $499,999
- 104$500,000 to $749,999
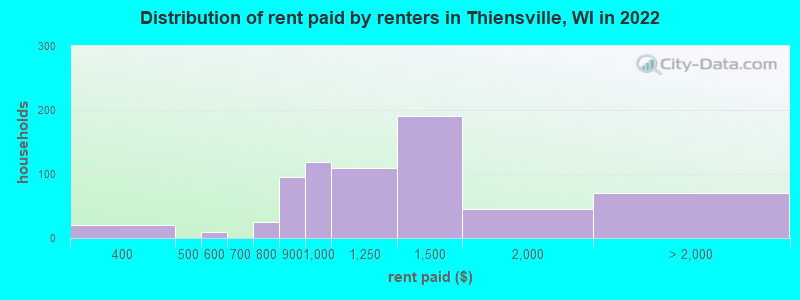
Rent paid by renters in 2022 in Thiensville, WI
-
- 21$300 to $349
- 10$500 to $549
- 24$750 to $799
- 94$800 to $899
- 117$900 to $999
- 108$1,000 to $1,249
- 190$1,250 to $1,499
- 45$1,500 to $1,999
- 22$2,000 to $2,499
- 22$2,500 to $2,999
- 25No cash rent
Percentage of workers working in this county: 54.1%
Number of people working at home: 343 (17.7% of all workers)
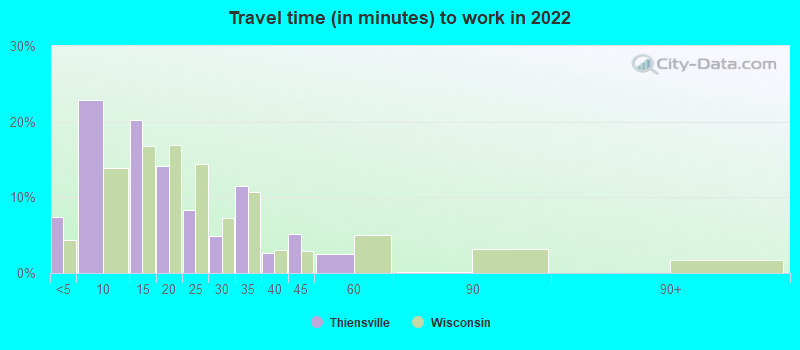
Travel time to work (commute)
- Less than 5 minutes: 79
- 5 to 9 minutes: 84
- 10 to 14 minutes: 227
- 15 to 19 minutes: 184
- 20 to 24 minutes: 287
- 25 to 29 minutes: 221
- 30 to 34 minutes: 196
- 35 to 39 minutes: 62
- 40 to 44 minutes: 71
- 45 to 59 minutes: 60
- 60 to 89 minutes: 135
- 90 or more minutes: 37
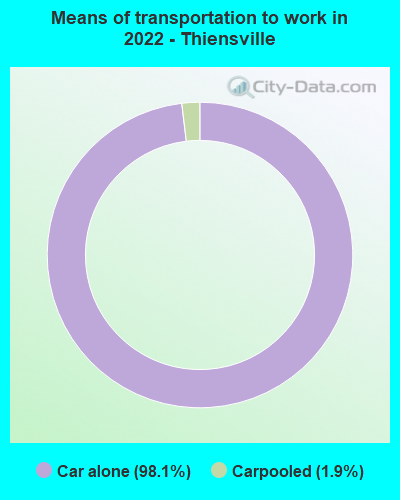
Means of transportation to work:
- Drove a car alone: 694 (69.0%)
- Carpooled: 15 (1.5%)
- Worked at home: 343 (34.1%)
- Unemployment by race in 2022
- Unemployment rate for White non-Hispanic residents
- 0.7%Males
- 1.2%Females
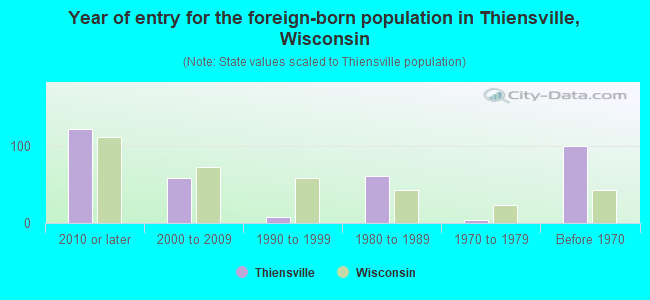
- Year of entry for the foreign-born population in Thiensville, Wisconsin
- 1222010 or later
- 592000 to 2009
- 81990 to 1999
- 611980 to 1989
- 41970 to 1979
- 100Before 1970
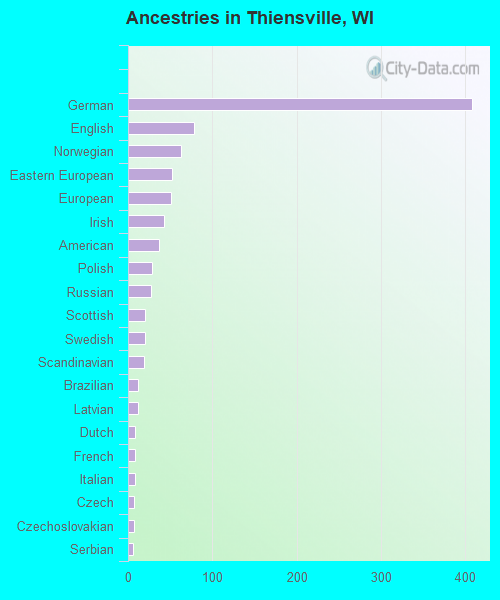
First ancestries reported:
- German: 408 (34.6%)
- English: 78 (6.6%)
- Norwegian: 63 (5.3%)
- Eastern European: 52 (4.4%)
- European: 51 (4.3%)
- Irish: 43 (3.6%)
- American: 37 (3.1%)
- Polish: 28 (2.4%)
- Russian: 27 (2.3%)
- Scottish: 20 (1.7%)
- Swedish: 20 (1.7%)
- Scandinavian: 19 (1.6%)
- Brazilian: 12 (1.0%)
- Latvian: 12 (1.0%)
- Dutch: 8 (0.7%)
- French: 8 (0.7%)
- Italian: 8 (0.7%)
- Czech: 7 (0.6%)
- Czechoslovakian: 7 (0.6%)
- Serbian: 6 (0.5%)
Most common places of birth for foreign-born residents (%):
| Thiensville: | 20.8% (40) |
| Wisconsin: | 5.1% (15,165) |
| Thiensville: | 10.9% (21) |
| Wisconsin: | 29.5% (87,182) |
| Thiensville: | 9.9% (19) |
| Wisconsin: | 3.1% (9,280) |
| Thiensville: | 8.9% (17) |
| Wisconsin: | 0.1% (172) |
| Thiensville: | 8.3% (16) |
| Wisconsin: | 8.0% (23,594) |
| Thiensville: | 7.8% (15) |
| Wisconsin: | 0.2% (457) |
| Thiensville: | 6.2% (12) |
| Wisconsin: | 0.4% (1,187) |
| Thiensville: | 5.2% (10) |
| Wisconsin: | 0.7% (2,101) |
| Thiensville: | 4.2% (8) |
| Wisconsin: | 2.3% (6,747) |
| Thiensville: | 3.6% (7) |
| Wisconsin: | 0.3% (802) |
Place of birth for U.S.-born residents:
- This state: 2,106
- Other state: 1,025
- Northeast: 74
- Midwest: 444
- South: 388
- West: 155
83.6% of Thiensville residents lived in the same house 1 years ago.
Out of people who lived in different houses, 25.9% lived in this county.
Out of people who lived in different counties, 64.7% lived in Wisconsin.
| Thiensville: | 83.6% |
| State average: | 87.7% |
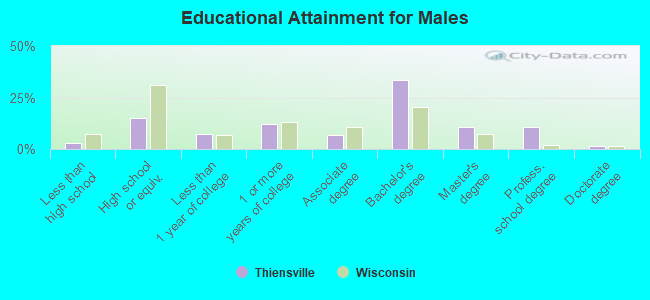
Education attainment for males 25 years and older:
- No schooling: 0
- Nursery to 4th grade: 0
- 5th and 6th grade: 10
- 7th and 8th grade: 0
- 9th grade: 0
- 10th grade: 7
- 11th grade: 0
- 12th grade, no diploma: 16
- High school graduate (or equivalency): 183
- Less than 1 year of college: 89
- Some college more than 1 year, no degree: 148
- Associate degree: 84
- Bachelor's degree: 409
- Master's degree: 130
- Professional school degree: 130
- Doctorate degree: 15
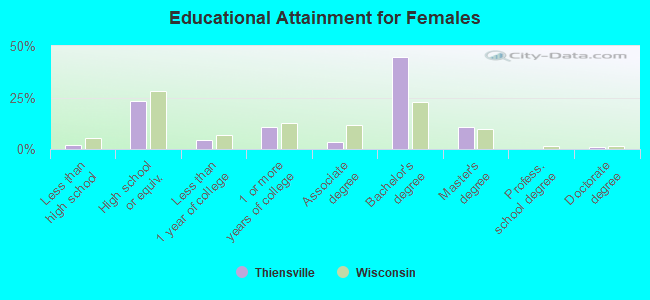
Education attainment for females 25 years and older:
- No schooling: 0
- Nursery to 4th grade: 0
- 5th and 6th grade: 0
- 7th and 8th grade: 0
- 9th grade: 11
- 10th grade: 0
- 11th grade: 0
- 12th grade, no diploma: 13
- High school graduate (or equivalency): 309
- Less than 1 year of college: 58
- Some college more than 1 year, no degree: 143
- Associate degree: 47
- Bachelor's degree: 591
- Master's degree: 140
- Professional school degree: 0
- Doctorate degree: 14
Housing units in structures:
- One, detached: 878
- One, attached: 29
- Two: 77
- 3 or 4: 20
- 5 to 9: 439
- 10 to 19: 67
- 20 to 49: 43
- 50 or more: 57
- Mobile homes: 6
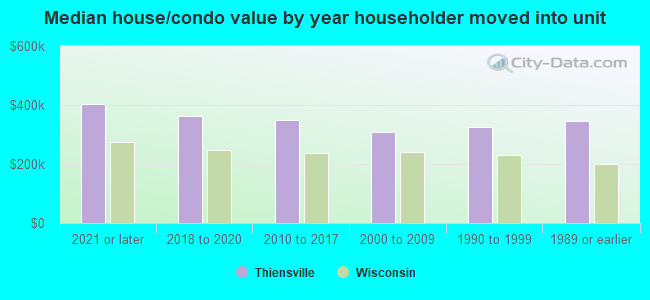
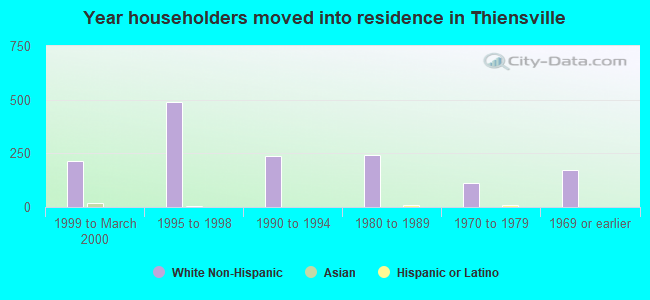
House/condo owner moved in on average 11 years ago
Renter moved in on average 1 years ago
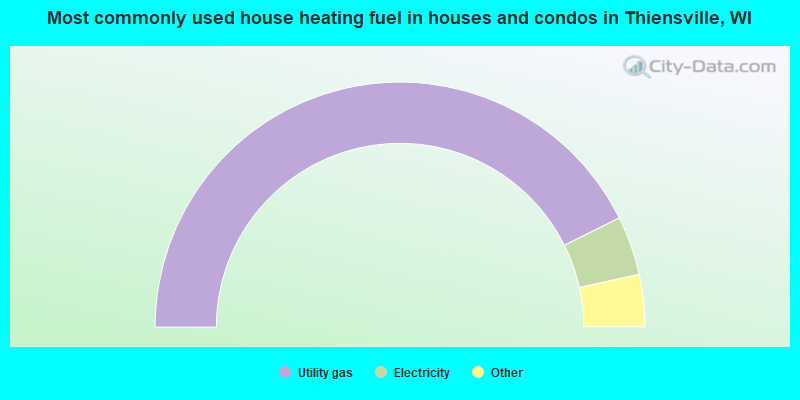
- 85.5%Utility gas
- 7.8%Electricity
- 2.3%Other fuel
- 2.2%Fuel oil, kerosene, etc.
- 1.5%Bottled, tank, or LP gas
- 0.8%No fuel used
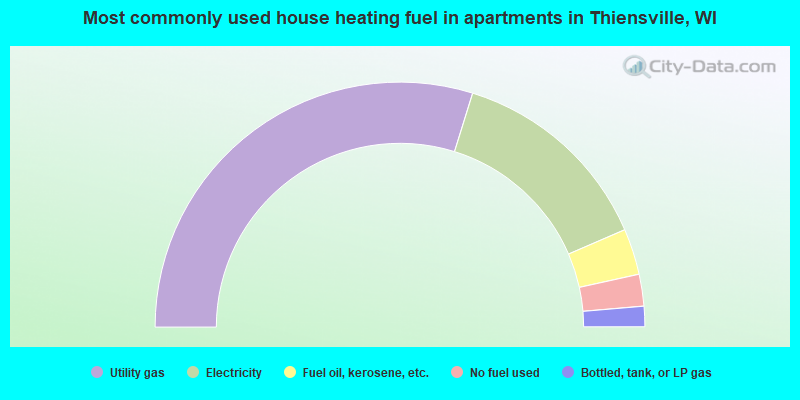
- 59.6%Utility gas
- 27.4%Electricity
- 6.1%Fuel oil, kerosene, etc.
- 4.2%No fuel used
- 2.7%Bottled, tank, or LP gas
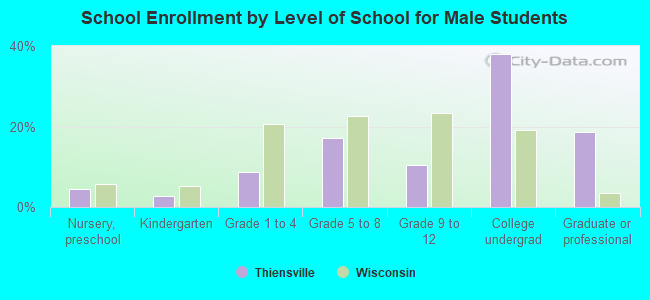
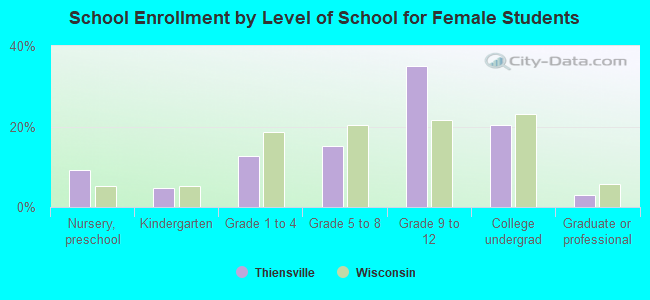
Private vs. public school enrollment:
| Here: | 22.7% |
| Wisconsin: | 16.7% |
| Here: | 3.9% |
| Wisconsin: | 12.5% |
| Here: | 42.0% |
| Wisconsin: | 17.5% |