Temperance, MI (Michigan) Houses and Residents
| Temperance: | $208,064 |
| Michigan: | $224,400 |
Mean price in 2022:
Detached houses: $280,478
Here: $280,478 State: $280,038 Townhouses or other attached units: $210,927
Here: $210,927 State: $239,520
Total population: 8,517 (Urban population: 7,743, Rural population: 0)
Houses: 3,938 (3,812 occupied: 2,863 owner occupied, 949 renter occupied)
| % of renters here: | 25% |
| State: | 27% |
Housing density: 857 houses/condos per square mile
Median price asked for vacant for-sale houses and condos in 2022: $333,715.
Median contract rent in 2022: $1,066 (lower quartile is $694, upper quartile is $1,316)
Median rent asked for vacant for-rent units in 2022: $1,113
Median gross rent in Temperance, MI in 2022: $1,216
Housing units in Temperance with a mortgage: 1,791 (279 second mortgage, 7 home equity loan, 210 both second mortgage and home equity loan)
Houses without a mortgage: 160
Median household income for houses/condos with a mortgage: $110,130
Median household income for apartments without a mortgage: $58,408
Median monthly housing costs: $1,057
Compare current foreclosures near Temperance, MI:
| Photo | Address | Area | Beds / Baths | Price | Details |
|---|---|---|---|---|---|

|
#1
Hazeldell Dr
Temperance, MI 48182
|
1,199 sq. feet
|
1 baths 3 beds |
$220,000
|
show details |

|
#2
W Dean Rd
Temperance, MI 48182
|
1,380 sq. feet
|
2 baths 2 beds |
$135,001
|
show details |

|
#3
Maplewood Dr
Temperance, MI 48182
|
- sq. feet
|
1 baths 3 beds |
show details | |

|
#4
Fairfield Ave
Temperance, MI 48182
|
- sq. feet
|
- baths - beds |
show details | |

|
#5
Wesley Dr
Temperance, MI 48182
|
- sq. feet
|
- baths - beds |
show details | |

|
#6
Douglas Rd
Temperance, MI 48182
|
- sq. feet
|
- baths - beds |
show details | |

|
#7
Birckhead Pl
Toledo, OH 43608
|
2,753 sq. feet
|
1 baths 3 beds |
$84,900
|
show details |

|
#8
Morrow Rd
Toledo, OH 43615
|
1,040 sq. feet
|
1 baths 3 beds |
$164,500
|
show details |

|
#9
Nottingham Ter
Toledo, OH 43610
|
2,073 sq. feet
|
1 baths 4 beds |
$39,900
|
show details |

|
#10
Bricker Ave
Toledo, OH 43608
|
1,611 sq. feet
|
1 baths 3 beds |
$37,500
|
show details |
| Photo | Address | Area | Beds / Baths | Price | Details |
|---|---|---|---|---|---|

|
#11
Duncan Rd
Toledo, OH 43613
|
820 sq. feet
|
1 baths 2 beds |
$34,900
|
show details |

|
#12
Artwell Dr
Sylvania, OH 43560
|
1,144 sq. feet
|
1 baths 3 beds |
$42,500
|
show details |

|
#13
E Hurd Rd
Monroe, MI 48162
|
1,230 sq. feet
|
2 baths 4 beds |
$69,900
|
show details |

|
#14
Leybourn Ave
Toledo, OH 43612
|
1,126 sq. feet
|
1 baths 3 beds |
$39,900
|
show details |

|
#15
Douglas Rd
Temperance, MI 48182
|
- sq. feet
|
- baths - beds |
show details | |

|
#16
Whitewood
Temperance, MI 48182
|
- sq. feet
|
- baths - beds |
show details | |

|
#17
Shady Grove Ln
Temperance, MI 48182
|
- sq. feet
|
- baths - beds |
show details | |

|
#18
W Sterns Rd
Temperance, MI 48182
|
- sq. feet
|
- baths - beds |
show details | |

|
#19
W Rauch Rd
Temperance, MI 48182
|
- sq. feet
|
- baths - beds |
show details | |

|
#20
School Rd
Temperance, MI 48182
|
- sq. feet
|
- baths - beds |
show details |
| Photo | Address | Area | Beds / Baths | Price | Details |
|---|---|---|---|---|---|

|
#21
Village Meadows Dr
Temperance, MI 48182
|
- sq. feet
|
- baths - beds |
show details | |

|
#22
Preswick St
Temperance, MI 48182
|
- sq. feet
|
- baths - beds |
show details | |

|
#23
Gleneagles Cir
Temperance, MI 48182
|
- sq. feet
|
- baths - beds |
show details | |

|
#24
Crabb Rd
Temperance, MI 48182
|
- sq. feet
|
- baths - beds |
show details | |

|
#25
Eastbrook Dr
Temperance, MI 48182
|
- sq. feet
|
- baths - beds |
show details | |

|
#26
Marengo Dr
Temperance, MI 48182
|
- sq. feet
|
- baths - beds |
show details | |

|
#27
Comanche Trl
Temperance, MI 48182
|
- sq. feet
|
- baths - beds |
show details | |

|
#28
Burger St
Toledo, OH 43605
|
860 sq. feet
|
1 baths 2 beds |
$19,900
|
show details |

|
#29
Wildwood Blvd
Toledo, OH 43614
|
1,078 sq. feet
|
1 baths 2 beds |
show details | |

|
#30
Parkside Blvd
Toledo, OH 43607
|
1,554 sq. feet
|
1 baths 3 beds |
show details |
| Photo | Address | Area | Beds / Baths | Price | Details |
|---|---|---|---|---|---|

|
#31
Gilhouse Rd
Toledo, OH 43623
|
1,654 sq. feet
|
1 baths 4 beds |
show details | |

|
#32
W 5th St
Monroe, MI 48161
|
2,218 sq. feet
|
2 baths 5 beds |
show details | |

|
#33
Orono Dr
Toledo, OH 43614
|
1,078 sq. feet
|
1 baths 3 beds |
show details | |

|
#34
Wood St
Petersburg, MI 49270
|
1,668 sq. feet
|
1 baths 3 beds |
show details | |

|
#35
Douglas Rd
Toledo, OH 43613
|
991 sq. feet
|
1 baths 2 beds |
show details | |

|
#36
Thackeray Rd
Maumee, OH 43537
|
1,025 sq. feet
|
1 baths 3 beds |
show details | |

|
#37
S Main St
Walbridge, OH 43465
|
1,118 sq. feet
|
1 baths 3 beds |
show details | |

|
#38
Gould Rd
Toledo, OH 43612
|
748 sq. feet
|
1 baths 2 beds |
show details | |

|
#39
N Custer Rd
Monroe, MI 48162
|
2,263 sq. feet
|
2 baths 4 beds |
show details | |

|
#40
Custer Dr
Toledo, OH 43612
|
832 sq. feet
|
1 baths 2 beds |
show details |
| Photo | Address | Area | Beds / Baths | Price | Details |
|---|---|---|---|---|---|

|
#41
E Monroe St
Dundee, MI 48131
|
1,236 sq. feet
|
1 baths 3 beds |
show details | |

|
#42
Venice Dr
Northwood, OH 43619
|
1,788 sq. feet
|
2 baths 4 beds |
show details | |

|
#43
Pope Run Ln
Sylvania, OH 43560
|
3,121 sq. feet
|
2 baths 5 beds |
show details | |

|
#44
Glenbrook Dr
Toledo, OH 43614
|
1,180 sq. feet
|
1 baths 3 beds |
show details | |

|
#45
Walden Ave
Toledo, OH 43605
|
1 sq. feet
|
1 baths 3 beds |
show details | |

|
#46
Marmion Ave
Toledo, OH 43607
|
836 sq. feet
|
2 baths 3 beds |
show details | |

|
#47
Westmonte Rd
Toledo, OH 43607
|
1,325 sq. feet
|
1 baths 2 beds |
show details | |

|
#48
Licking St
Toledo, OH 43605
|
- sq. feet
|
- baths - beds |
$7,900
|
show details |

|
#49
Claxton St
Toledo, OH 43615
|
1,234 sq. feet
|
1 baths 3 beds |
show details | |

|
Check over 1 million property listings on Foreclosure.com!
|
browse all offers | |||

Latest news about housing in Temperance, MI collected exclusively by city-data.com from local newspapers, TV, and radio stations

 | best places to rent/live near Monroe/Temperance Michigan (4 replies) |
| 2/3 of Michigan Counties add Residents; Wayne County population loss slows to a crawl (33 replies) |
| That abandoned half-built home on 23... (42 replies) |
| Moving From Nashville to Flint/Grand Blanc for J.O.B (11 replies) |
| Areas to avoid in SE michigan? (109 replies) |
| Need Info MI/OH! (25 replies) |

Median year apartment built: 1995
Household type by relationship:
Households: 9,167- Male householders: 1,746 (339 living alone), Female householders: 2,042 (723 living alone)
1,820 spouses (1,794 opposite-sex spouses), 616 unmarried partners, (390 opposite-sex unmarried partners), 2,316 children (2,242 natural, 12 adopted, 62 stepchildren), 114 grandchildren, 73 brothers or sisters, 130 parents, 13 foster children, 38 other relatives, 168 non-relatives
- In group quarters: 86
Size of family households: 1,125 2-persons, 455 3-persons, 551 4-persons, 149 5-persons, 31 6-persons.
Size of nonfamily households: 1,078 1-person, 433 2-persons, 9 3-persons, 12 6-persons.
1,070 married couples with children.
495 single-parent households (247 men, 248 women).
95.1% of residents of Temperance speak English at home.
3.2% of residents speak Spanish at home (81% speak English very well, 19% speak English well).
1.0% of residents speak other Indo-European language at home (70% speak English very well, 30% speak English well).
0.5% of residents speak other language at home (66% speak English very well, 34% speak English well).
Foreign born population: 149 (1.6%)
(78.5% of them are naturalized citizens)
| Here: | 6.9 |
| State: | 6.5 |
| Here: | 3.8 |
| State: | 4.3 |

- Bedrooms in owner-occupied houses and condos in Temperance, Michigan
- 0no bedroom
- 171 bedroom
- 1712 bedrooms
- 1,7303 bedrooms
- 8314 bedrooms
- 1135+ bedrooms

- Bedrooms in renter-occupied apartments in Temperance, Michigan
- 69no bedroom
- 2381 bedroom
- 5092 bedrooms
- 1163 bedrooms
- 184 bedrooms
- 05+ bedrooms

- Cars and other vehicles available in Temperance in owner-occupied houses/condos
- 36no vehicle
- 5711 vehicle
- 1,3732 vehicles
- 5273 vehicles
- 3084 vehicles
- 475+ vehicles

- Cars and other vehicles available in Temperance in renter-occupied apartments
- 192no vehicle
- 4991 vehicle
- 1962 vehicles
- 533 vehicles
- 04 vehicles
- 105+ vehicles

- Rooms in owner-occupied houses in Temperance, Michigan
- 01 room
- 02 rooms
- 03 rooms
- 514 rooms
- 3075 rooms
- 7816 rooms
- 5717 rooms
- 5588 rooms
- 5959+ rooms

- Rooms in renter-occupied apartments in Temperance, Michigan
- 691 room
- 212 rooms
- 3103 rooms
- 1714 rooms
- 1915 rooms
- 1596 rooms
- 07 rooms
- 208 rooms
- 89+ rooms


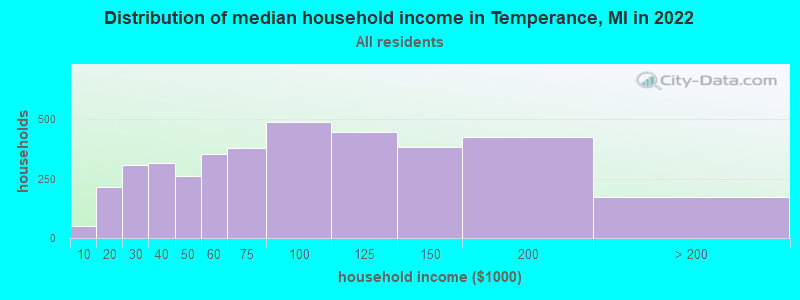
Temperance, MI household income distribution

- 50Less than $10,000
- 215$10,000 to $19,999
- 306$20,000 to $29,999
- 314$30,000 to $39,999
- 260$40,000 to $49,999
- 355$50,000 to $59,999
- 378$60,000 to $74,999
- 488$75,000 to $99,999
- 447$100,000 to $124,999
- 382$125,000 to $149,999
- 423$150,000 to $199,999
- 174$200,000 or more
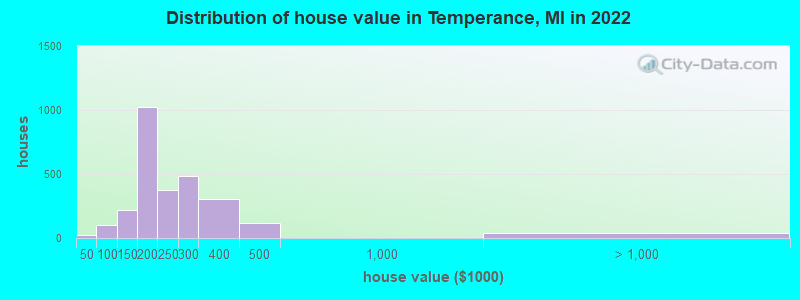
Home value of owner - occupied houses in 2022 in Temperance, MI
-
- 8Less than $10,000
- 7$15,000 to $19,999
- 11$20,000 to $24,999
- 14$50,000 to $59,999
- 38$70,000 to $79,999
- 21$80,000 to $89,999
- 23$90,000 to $99,999
- 107$100,000 to $124,999
- 112$125,000 to $149,999
- 411$150,000 to $174,999
- 612$175,000 to $199,999
- 378$200,000 to $249,999
- 484$250,000 to $299,999
- 302$300,000 to $399,999
- 117$400,000 to $499,999
- 40$2,000,000 or more
Rent paid by renters in 2022 in Temperance, MI
-
- 12$250 to $299
- 185$350 to $399
- 19$450 to $499
- 65$500 to $549
- 14$550 to $599
- 8$600 to $649
- 11$650 to $699
- 6$700 to $749
- 10$750 to $799
- 28$800 to $899
- 148$900 to $999
- 306$1,000 to $1,249
- 147$1,250 to $1,499
- 222$1,500 to $1,999


Percentage of workers working in this county: 35.0%
Number of people working at home: 318 (7.8% of all workers)
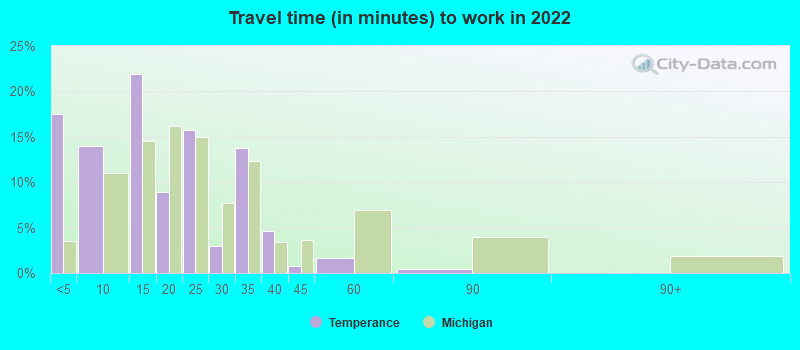
Travel time to work (commute)
- Less than 5 minutes: 78
- 5 to 9 minutes: 396
- 10 to 14 minutes: 386
- 15 to 19 minutes: 624
- 20 to 24 minutes: 591
- 25 to 29 minutes: 258
- 30 to 34 minutes: 728
- 35 to 39 minutes: 70
- 40 to 44 minutes: 79
- 45 to 59 minutes: 281
- 60 to 89 minutes: 124
- 90 or more minutes: 76
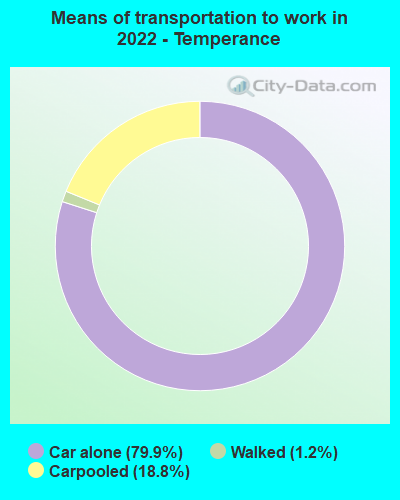
Means of transportation to work:
- Drove a car alone: 705 (60.9%)
- Carpooled: 167 (14.4%)
- Walked: 10 (0.9%)
- Worked at home: 318 (27.5%)

- Unemployment by race in 2022
- Unemployment rate for White non-Hispanic residents
- 5.4%Males
- 0.9%Females
- Unemployment rate for Hispanic or Latino residents
- 2.6%Males

- Year of entry for the foreign-born population in Temperance, Michigan
- 02010 or later
- 162000 to 2009
- 351990 to 1999
- 241980 to 1989
- 321970 to 1979
- 77Before 1970

First ancestries reported:
- German: 673 (20.5%)
- Polish: 656 (20.0%)
- American: 426 (13.0%)
- English: 192 (5.8%)
- Italian: 166 (5.1%)
- Irish: 157 (4.8%)
- Hungarian: 73 (2.2%)
- Scottish: 63 (1.9%)
- European: 59 (1.8%)
- Swiss: 43 (1.3%)
- Greek: 32 (1.0%)
- Russian: 32 (1.0%)
- Scotch-Irish: 24 (0.7%)
- Slovak: 20 (0.6%)
- Canadian: 18 (0.5%)
- Lithuanian: 18 (0.5%)
- French: 16 (0.5%)
- Iraqi: 13 (0.4%)
- Dutch: 13 (0.4%)
- Czech: 11 (0.3%)
- Ukrainian: 10 (0.3%)
- Armenian: 8 (0.2%)
- Danish: 8 (0.2%)
- Swedish: 6 (0.2%)
- British: 5 (0.2%)
Most common places of birth for foreign-born residents (%):
| Temperance: | 37.6% (62) |
| Michigan: | 0.1% (624) |
| Temperance: | 14.5% (24) |
| Michigan: | 0.2% (1,062) |
| Temperance: | 11.5% (19) |
| Michigan: | 0.6% (4,245) |
| Temperance: | 10.9% (18) |
| Michigan: | 0.6% (3,827) |
| Temperance: | 9.7% (16) |
| Michigan: | 10.9% (75,965) |
| Temperance: | 7.9% (13) |
| Michigan: | 8.1% (55,954) |
| Temperance: | 4.8% (8) |
| Michigan: | 1.6% (10,857) |
| Temperance: | 4.2% (7) |
| Michigan: | 0.9% (6,481) |
Place of birth for U.S.-born residents:
- This state: 2,640
- Other state: 6,314
- Northeast: 150
- Midwest: 5,978
- South: 207
- West: 65
94.8% of Temperance residents lived in the same house 1 years ago.
Out of people who lived in different houses, 27.3% lived in this county.
Out of people who lived in different counties, 35.8% lived in Michigan.
| Temperance: | 94.8% |
| State average: | 88.4% |
Education attainment for males 25 years and older:
- No schooling: 19
- Nursery to 4th grade: 0
- 5th and 6th grade: 0
- 7th and 8th grade: 64
- 9th grade: 0
- 10th grade: 37
- 11th grade: 20
- 12th grade, no diploma: 19
- High school graduate (or equivalency): 967
- Less than 1 year of college: 310
- Some college more than 1 year, no degree: 419
- Associate degree: 417
- Bachelor's degree: 542
- Master's degree: 119
- Professional school degree: 35
- Doctorate degree: 59

Education attainment for females 25 years and older:
- No schooling: 0
- Nursery to 4th grade: 0
- 5th and 6th grade: 0
- 7th and 8th grade: 24
- 9th grade: 10
- 10th grade: 72
- 11th grade: 81
- 12th grade, no diploma: 28
- High school graduate (or equivalency): 931
- Less than 1 year of college: 283
- Some college more than 1 year, no degree: 517
- Associate degree: 781
- Bachelor's degree: 890
- Master's degree: 185
- Professional school degree: 25
- Doctorate degree: 16


Housing units in structures:
- One, detached: 2,976
- One, attached: 122
- Two: 136
- 3 or 4: 92
- 5 to 9: 136
- 10 to 19: 199
- 20 to 49: 143
- 50 or more: 131
Housing units lacking complete kitchen facilities in 2022: 2.0%
House/condo owner moved in on average 17 years ago
Renter moved in on average 4 years ago

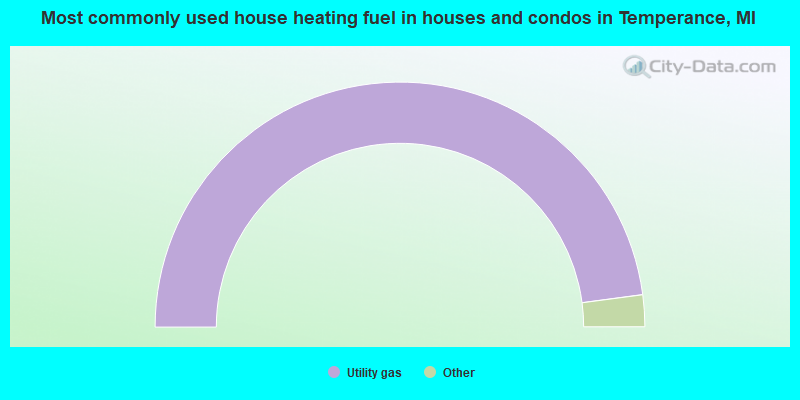
- 95.8%Utility gas
- 3.1%Electricity
- 1.1%Bottled, tank, or LP gas
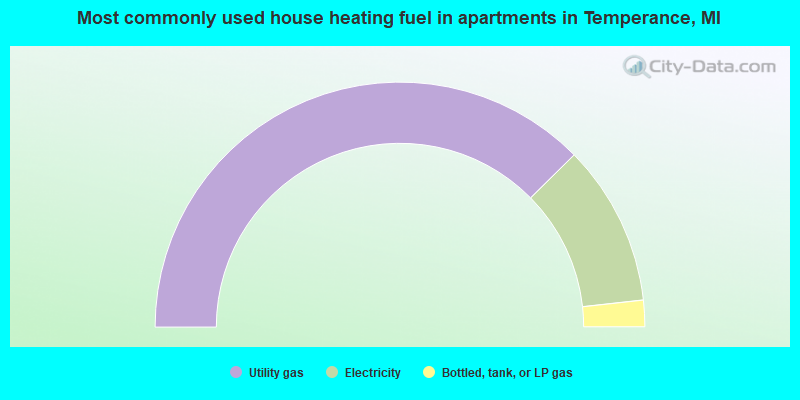
- 75.2%Utility gas
- 21.3%Electricity
- 3.5%Bottled, tank, or LP gas
Private vs. public school enrollment:
| Here: | 4.6% |
| Michigan: | 12.4% |
| Here: | 5.6% |
| Michigan: | 9.8% |
| Here: | 15.1% |
| Michigan: | 14.9% |


