Housing density: 1,406 houses/condos per square mile
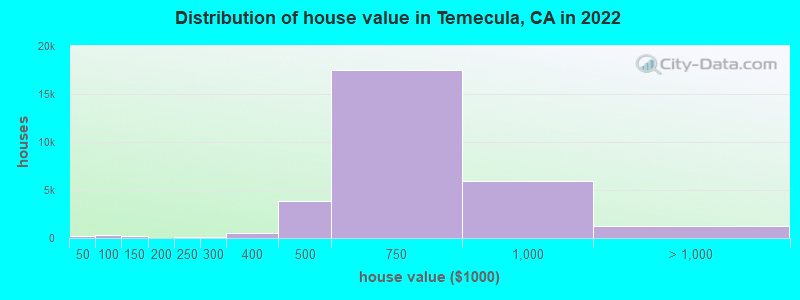
Median price asked for vacant for-sale houses and condos in 2022: $513,079.
Median contract rent in 2022: $1,960 (lower quartile is $1,604, upper quartile is over $2,000)
Median rent asked for vacant for-rent units in 2022: $3,094
Median gross rent in Temecula, CA in 2022: over $2,000
Housing units in Temecula with a mortgage: 19,428 (1,738 second mortgage, 92 home equity loan, 1,429 both second mortgage and home equity loan) Houses without a mortgage: 70
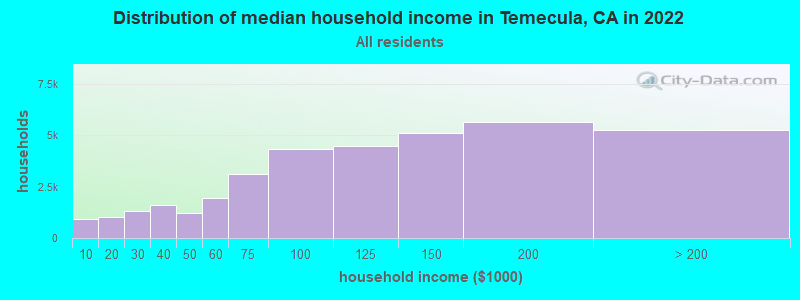
Median household income for houses/condos with a mortgage: $137,849
Median household income for apartments without a mortgage: $73,951
Size of family households: 8,632 2-persons, 7,495 3-persons, 5,899 4-persons, 3,545 5-persons, 1,703 6-persons, 655 7-or-more-persons.
Size of nonfamily households: 5,908 1-person, 2,001 2-persons, 41 4-persons.
22,487 married couples with children.
5,388 single-parent households (2,174 men, 3,214 women).
72.6% of residents of Temecula speak English at home.
15.3% of residents speak Spanish at home (73% speak English very well, 14% speak English well, 10% speak English not well, 3% don't speak English at all).
3.1% of residents speak other Indo-European language at home (71% speak English very well, 23% speak English well, 3% speak English not well, 3% don't speak English at all).
7.5% of residents speak Asian or Pacific Island language at home (58% speak English very well, 33% speak English well, 8% speak English not well, 1% don't speak English at all).
1.3% of residents speak other language at home (72% speak English very well, 16% speak English well, 10% speak English not well, 2% don't speak English at all).
Foreign born population: 18,393 (16.5%)
(64.0% of them are naturalized citizens)
Percentage of workers working in this county: 73.6% Number of people working at home: 9,622 (18.1% of all workers)
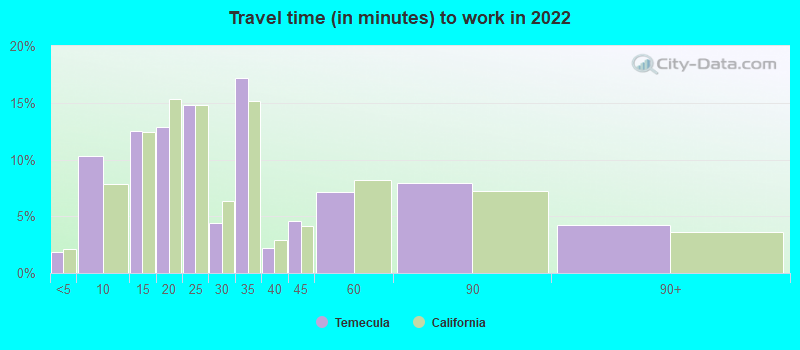
Travel time to work (commute)
Less than 5 minutes: 241
5 to 9 minutes: 4,304
10 to 14 minutes: 5,238
15 to 19 minutes: 5,626
20 to 24 minutes: 4,334
25 to 29 minutes: 1,418
30 to 34 minutes: 3,583
35 to 39 minutes: 1,923
40 to 44 minutes: 1,326
45 to 59 minutes: 4,396
60 to 89 minutes: 6,747
90 or more minutes: 4,146
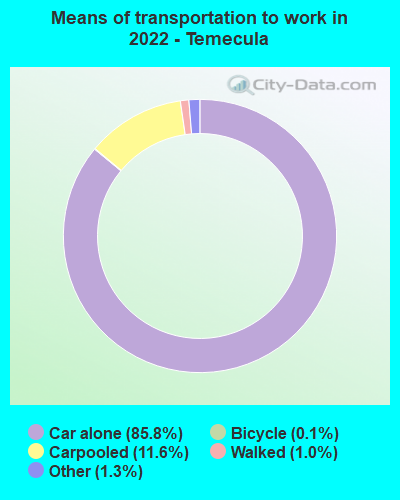
Means of transportation to work:
Drove a car alone: 46,237 (72.4%)
Carpooled: 6,767 (10.6%)
Bus: 28 (0.0%)
Taxi: 756 (1.2%)
Bicycle: 112 (0.2%)
Walked: 546 (0.9%)
Worked at home: 9,622 (15.1%)
Unemployment by race in 2022
Unemployment rate for White non-Hispanic residents
5.0%Males
2.3%Females
Unemployment rate for Black residents
3.7%Males
7.7%Females
Unemployment rate for American Indian and Alaska Native residents
1.8%Males
Unemployment rate for Asian residents
4.1%Males
5.0%Females
Unemployment rate for other race residents
4.5%Males
5.5%Females
Unemployment rate for two or more race residents
6.9%Males
9.2%Females
Unemployment rate for Hispanic or Latino residents
4.4%Males
8.4%Females
Year of entry for the foreign-born population in Temecula, California
3,7342010 or later
4,1272000 to 2009
3,7411990 to 1999
1,7281980 to 1989
1,2221970 to 1979
1,478Before 1970
First ancestries reported:
English: 3,406 (6.2%)
German: 3,192 (5.9%)
American: 2,921 (5.4%)
Irish: 1,858 (3.4%)
Italian: 1,757 (3.2%)
European: 1,179 (2.2%)
Scottish: 647 (1.2%)
Russian: 621 (1.1%)
British: 524 (1.0%)
Iranian: 501 (0.9%)
Polish: 479 (0.9%)
Norwegian: 346 (0.6%)
Eastern European: 344 (0.6%)
Scandinavian: 247 (0.5%)
Afghan: 218 (0.4%)
Egyptian: 218 (0.4%)
Swedish: 198 (0.4%)
Danish: 170 (0.3%)
Assyrian: 167 (0.3%)
French: 148 (0.3%)
Dutch: 135 (0.2%)
Syrian: 130 (0.2%)
Romanian: 123 (0.2%)
French Canadian: 115 (0.2%)
Belizean: 112 (0.2%)
Canadian: 110 (0.2%)
Greek: 98 (0.2%)
Northern European: 94 (0.2%)
Scotch-Irish: 87 (0.2%)
Czech: 85 (0.2%)
Trinidadian and Tobagonian: 85 (0.2%)
Iraqi: 81 (0.1%)
Ukrainian: 67 (0.1%)
Austrian: 64 (0.1%)
Maltese: 62 (0.1%)
Portuguese: 54 (0.10%)
Armenian: 51 (0.09%)
Hungarian: 49 (0.09%)
Lebanese: 37 (0.07%)
Croatian: 35 (0.06%)
Swiss: 34 (0.06%)
Welsh: 34 (0.06%)
Serbian: 31 (0.06%)
Czechoslovakian: 26 (0.05%)
Moroccan: 24 (0.04%)
Arab: 23 (0.04%)
African: 23 (0.04%)
Guyanese: 22 (0.04%)
Nigerian: 21 (0.04%)
Bulgarian: 17 (0.03%)
Lithuanian: 17 (0.03%)
Slavic: 15 (0.03%)
Liberian: 14 (0.03%)
South African: 13 (0.02%)
Finnish: 12 (0.02%)
Pennsylvania German: 12 (0.02%)
Australian: 11 (0.02%)
Slovene: 11 (0.02%)
Celtic: 11 (0.02%)
Brazilian: 10 (0.02%)
Turkish: 10 (0.02%)
Barbadian: 10 (0.02%)
Palestinian: 9 (0.02%)
Yugoslavian: 9 (0.02%)
Ghanaian: 4 (0.01%)
Slovak: 4 (0.01%)
Most common places of birth for foreign-born residents (%):
Mexico
Temecula:
27.2% (5,224)
California:
37.2% (3,881,193)
Philippines
Temecula:
16.9% (3,251)
California:
7.8% (818,297)
India
Temecula:
5.9% (1,134)
California:
5.2% (539,184)
China, excluding Hong Kong and Taiwan
Temecula:
4.5% (866)
California:
6.6% (684,672)
Korea
Temecula:
3.2% (609)
California:
3.0% (315,248)
Iran
Temecula:
2.8% (531)
California:
2.0% (206,004)
Vietnam
Temecula:
2.5% (488)
California:
4.9% (512,335)
Guatemala
Temecula:
2.3% (445)
California:
2.8% (290,436)
Russia
Temecula:
1.9% (373)
California:
0.7% (71,932)
Canada
Temecula:
1.9% (359)
California:
1.2% (127,477)
Place of birth for U.S.-born residents:
This state: 64,864
Other state: 25,887
Northeast: 5,883
Midwest: 8,128
South: 6,649
West: 5,227
86.2% of Temecula residents lived in the same house 1 years ago. Out of people who lived in different houses, 29.6% lived in this county. Out of people who lived in different counties, 70.9% lived in California.
Temecula:
86.2%
State average:
88.9%
Education attainment for males 25 years and older:
No schooling: 694
Nursery to 4th grade: 727
5th and 6th grade: 412
7th and 8th grade: 0
9th grade: 144
10th grade: 291
11th grade: 396
12th grade, no diploma: 624
High school graduate (or equivalency): 6,876
Less than 1 year of college: 2,555
Some college more than 1 year, no degree: 4,673
Associate degree: 3,309
Bachelor's degree: 9,350
Master's degree: 3,750
Professional school degree: 1,403
Doctorate degree: 761
Education attainment for females 25 years and older:
No schooling: 507
Nursery to 4th grade: 298
5th and 6th grade: 560
7th and 8th grade: 123
9th grade: 0
10th grade: 281
11th grade: 349
12th grade, no diploma: 481
High school graduate (or equivalency): 7,515
Less than 1 year of college: 3,461
Some college more than 1 year, no degree: 6,954
Associate degree: 3,332
Bachelor's degree: 8,643
Master's degree: 4,874
Professional school degree: 518
Doctorate degree: 228
Housing units in structures:
One, detached: 27,726
One, attached: 719
Two: 51
3 or 4: 1,384
5 to 9: 1,769
10 to 19: 1,358
20 to 49: 990
50 or more: 2,315
Mobile homes: 595
Median worth of mobile homes: $153,456
Housing units lacking complete plumbing facilities in 2022: 0.2%
Housing units lacking complete kitchen facilities in 2022: 2.5%