Teaticket, MA (Massachusetts) Houses and Residents
| Teaticket: | $547,004 |
| Massachusetts: | $534,700 |
Mean price in 2022:
Detached houses: $540,731
Here: $540,731 State: $651,570 Townhouses or other attached units: $391,814
Here: $391,814 State: $617,749 In 3-to-4-unit structures: $220,744
Here: $220,744 State: $601,912
Total population: 1,692 (All urban)
Houses: 1,456 (772 occupied: 733 owner occupied, 90 renter occupied)
| % of renters here: | 11% |
| State: | 38% |
Housing density: 1,385 houses/condos per square mile
Median price asked for vacant for-sale houses and condos in 2022: $489,943.
Median contract rent in 2022: $1,211
Median rent asked for vacant for-rent units in 2022: $904
Median gross rent in Teaticket, MA in 2022: $1,421
Housing units in Teaticket with a mortgage: 298 (30 second mortgage, 0 home equity loan, 29 both second mortgage and home equity loan)
Houses without a mortgage: 9
Median household income for houses/condos with a mortgage: $113,579
Median household income for apartments without a mortgage: $87,928
Median monthly housing costs: $1,050
Compare current foreclosures near Teaticket, MA:
| Photo | Address | Area | Beds / Baths | Price | Details |
|---|---|---|---|---|---|

|
#1
W Falmouth Hwy
Falmouth, MA 02540
|
1,224 sq. feet
|
2 baths 4 beds |
$665,000
|
show details |

|
#2
Manamok Cir
Sandwich, MA 02563
|
1,232 sq. feet
|
2 baths 3 beds |
show details | |

|
#3
Quaker Run Rd
Mashpee, MA 02649
|
3,010 sq. feet
|
3 baths 4 beds |
show details | |

|
#4
Swifts Beach Road A/k/a 84 Swift S Beach Road
Wareham, MA 02571
|
- sq. feet
|
1 baths 3 beds |
show details | |

|
#5
Holly Cir # 16a
Buzzards Bay, MA 02532
|
1,451 sq. feet
|
1 baths 3 beds |
show details | |

|
#6
Downey St
Plymouth, MA 02360
|
1,632 sq. feet
|
2 baths 3 beds |
show details | |

|
#7
Point Rd
Marion, MA 02738
|
660 sq. feet
|
1 baths 2 beds |
show details | |

|
#8
Gosnold St
Hyannis, MA 02601
|
2,184 sq. feet
|
3 baths 4 beds |
show details | |

|
#9
Dillingham Ave
Sandwich, MA 02563
|
1,008 sq. feet
|
1 baths 2 beds |
show details | |

|
#10
Cranberry Hwy
Wareham, MA 02571
|
979 sq. feet
|
1 baths 3 beds |
show details |
| Photo | Address | Area | Beds / Baths | Price | Details |
|---|---|---|---|---|---|

|
#11
Lils Way
Mattapoisett, MA 02739
|
1,404 sq. feet
|
1 baths 3 beds |
show details | |

|
#12
7th Ave
Wareham, MA 02571
|
1,175 sq. feet
|
1 baths 3 beds |
show details | |

|
#13
Sunset Ter
Hyannis, MA 02601
|
1,783 sq. feet
|
1 baths 3 beds |
show details | |

|
#14
Terry Ln E
Wareham, MA 02571
|
1,412 sq. feet
|
1 baths 3 beds |
show details | |

|
#15
Huttleston Ave
Fairhaven, MA 02719
|
1,454 sq. feet
|
1 baths 3 beds |
show details | |

|
#16
Tupper Ave
Sandwich, MA 02563
|
1,344 sq. feet
|
2 baths 3 beds |
show details | |

|
#17
10th Ave
Wareham, MA 02571
|
1,216 sq. feet
|
1 baths 3 beds |
show details | |

|
#18
W Hyannisport Cir
Hyannis, MA 02601
|
2,386 sq. feet
|
2 baths 4 beds |
show details | |

|
#19
Conners Rd
Centerville, MA 02632
|
2,240 sq. feet
|
3 baths 4 beds |
show details | |

|
#20
Daniel Rd
Wareham, MA 02571
|
1,316 sq. feet
|
1 baths 3 beds |
show details |
| Photo | Address | Area | Beds / Baths | Price | Details |
|---|---|---|---|---|---|

|
#21
Kimba Ln
Sagamore Beach, MA 02562
|
3,384 sq. feet
|
3 baths 5 beds |
show details | |

|
#22
Rudder Rd
Hyannis, MA 02601
|
1,436 sq. feet
|
1 baths 3 beds |
show details | |

|
#23
Alder Berry Ln
Mattapoisett, MA 02739
|
2,935 sq. feet
|
2 baths 4 beds |
show details | |

|
#24
14th Ave
Wareham, MA 02571
|
936 sq. feet
|
1 baths 2 beds |
show details | |

|
#25
Tupper Rd
Sandwich, MA 02563
|
2,872 sq. feet
|
4 baths 5 beds |
show details | |

|
#26
Brandt Island Rd
Mattapoisett, MA 02739
|
912 sq. feet
|
1 baths 1 beds |
show details | |

|
#27
Minot Ave
Wareham, MA 02571
|
960 sq. feet
|
1 baths 3 beds |
show details | |

|
#28
Pond St
Centerville, MA 02632
|
980 sq. feet
|
1 baths 2 beds |
show details | |

|
#29
Pinecrest Rd
Centerville, MA 02632
|
925 sq. feet
|
1 baths 3 beds |
show details | |

|
#30
Forest Way
Wareham, MA 02571
|
2,969 sq. feet
|
2 baths 4 beds |
show details |
| Photo | Address | Area | Beds / Baths | Price | Details |
|---|---|---|---|---|---|

|
#31
Harvey Orchard Ln
Mattapoisett, MA 02739
|
1,460 sq. feet
|
1 baths 3 beds |
show details | |

|
#32
Walnut St
Plymouth, MA 02360
|
704 sq. feet
|
1 baths 2 beds |
show details | |

|
#33
Buzzards Bay Dr
Plymouth, MA 02360
|
1,283 sq. feet
|
1 baths 2 beds |
show details | |

|
#34
Diamond St
Fairhaven, MA 02719
|
392 sq. feet
|
1 baths 1 beds |
show details | |

|
#35
Depot St
East Wareham, MA 02538
|
1,284 sq. feet
|
2 baths 3 beds |
show details | |

|
#36
Davisville Rd
East Falmouth, MA 02536
|
962 sq. feet
|
1 baths 3 beds |
show details | |

|
#37
Sandwich Rd
Wareham, MA 02571
|
1,036 sq. feet
|
1 baths 3 beds |
show details | |

|
#38
Wellesley Cir
Hyannis, MA 02601
|
1,056 sq. feet
|
2 baths 3 beds |
show details | |

|
#39
Arrowhead Dr
Hyannis, MA 02601
|
832 sq. feet
|
1 baths 2 beds |
show details | |

|
#40
Whitley Trl
Plymouth, MA 02360
|
1,288 sq. feet
|
2 baths 2 beds |
show details |
| Photo | Address | Area | Beds / Baths | Price | Details |
|---|---|---|---|---|---|

|
#41
Sycamore Ave
Sagamore Beach, MA 02562
|
3,484 sq. feet
|
2 baths 7 beds |
show details | |

|
#42
Sunset Blvd
East Wareham, MA 02538
|
1,248 sq. feet
|
2 baths 1 beds |
show details | |

|
#43
Park Ave
East Wareham, MA 02538
|
720 sq. feet
|
1 baths 2 beds |
show details | |

|
#44
Little Sandy Pond Rd
Plymouth, MA 02360
|
3,454 sq. feet
|
2 baths 4 beds |
show details | |

|
#45
Circuit Ave
Hyannis, MA 02601
|
864 sq. feet
|
1 baths 2 beds |
show details | |

|
#46
Murphy Rd
Hyannis, MA 02601
|
1,074 sq. feet
|
1 baths 3 beds |
show details | |

|
#47
Repose Ln
East Wareham, MA 02538
|
1,528 sq. feet
|
2 baths 3 beds |
show details | |

|
#48
Harbor Mist Dr
Fairhaven, MA 02719
|
2,090 sq. feet
|
3 baths 3 beds |
show details | |

|
#49
Cottage St
Fairhaven, MA 02719
|
1,730 sq. feet
|
2 baths 4 beds |
show details | |

|
Check over 1 million property listings on Foreclosure.com!
|
browse all offers | |||

Latest news about housing in Teaticket, MA collected exclusively by city-data.com from local newspapers, TV, and radio stations

 | Commuting Hanover to Cape Cod (16 replies) |
| How is living in Sandwich, MA? (67 replies) |
| Future of MA (85 replies) |

Median year apartment built: 1980
Household type by relationship:
Households: 1,581- Male householders: 382 (95 living alone), Female householders: 395 (200 living alone)
309 spouses (309 opposite-sex spouses), 16 unmarried partners, (16 opposite-sex unmarried partners), 246 children (246 natural, 0 adopted, 0 stepchildren), 65 grandchildren, 64 brothers or sisters, 0 parents, 0 foster children, 52 other relatives, 48 non-relatives
Size of family households: 328 2-persons, 51 3-persons, 39 4-persons, 16 5-persons, 16 6-persons.
Size of nonfamily households: 316 1-person, 41 2-persons, 15 3-persons.
41 married couples with children.
52 single-parent households (0 men, 52 women).
97.8% of residents of Teaticket speak English at home.
0.3% of residents speak Spanish at home (100% speak English well).
3.1% of residents speak other Indo-European language at home (100% speak English very well).
Foreign born population: 105 (6.6%)
(56.2% of them are naturalized citizens)
| Here: | 6.0 |
| State: | 6.5 |
| Here: | 4.6 |
| State: | 4.0 |

- Bedrooms in owner-occupied houses and condos in Teaticket, Massachusetts
- 0no bedroom
- 121 bedroom
- 1552 bedrooms
- 3403 bedrooms
- 2104 bedrooms
- 165+ bedrooms

- Bedrooms in renter-occupied apartments in Teaticket, Massachusetts
- 0no bedroom
- 431 bedroom
- 02 bedrooms
- 343 bedrooms
- 134 bedrooms
- 05+ bedrooms

- Cars and other vehicles available in Teaticket in owner-occupied houses/condos
- 0no vehicle
- 3011 vehicle
- 2522 vehicles
- 1653 vehicles
- 154 vehicles
- 05+ vehicles

- Cars and other vehicles available in Teaticket in renter-occupied apartments
- 10no vehicle
- 681 vehicle
- 02 vehicles
- 133 vehicles
- 04 vehicles
- 05+ vehicles

- Rooms in owner-occupied houses in Teaticket, Massachusetts
- 01 room
- 02 rooms
- 343 rooms
- 644 rooms
- 1405 rooms
- 2336 rooms
- 1147 rooms
- 1078 rooms
- 419+ rooms

- Rooms in renter-occupied apartments in Teaticket, Massachusetts
- 01 room
- 02 rooms
- 133 rooms
- 304 rooms
- 245 rooms
- 126 rooms
- 127 rooms
- 08 rooms
- 09+ rooms


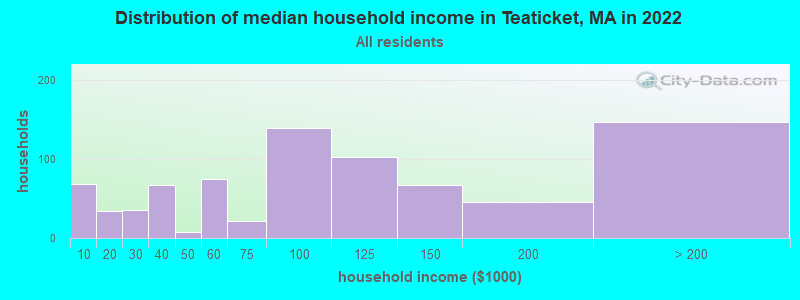
Teaticket, MA household income distribution

- 69Less than $10,000
- 34$10,000 to $19,999
- 36$20,000 to $29,999
- 67$30,000 to $39,999
- 8$40,000 to $49,999
- 75$50,000 to $59,999
- 21$60,000 to $74,999
- 140$75,000 to $99,999
- 103$100,000 to $124,999
- 67$125,000 to $149,999
- 46$150,000 to $199,999
- 147$200,000 or more
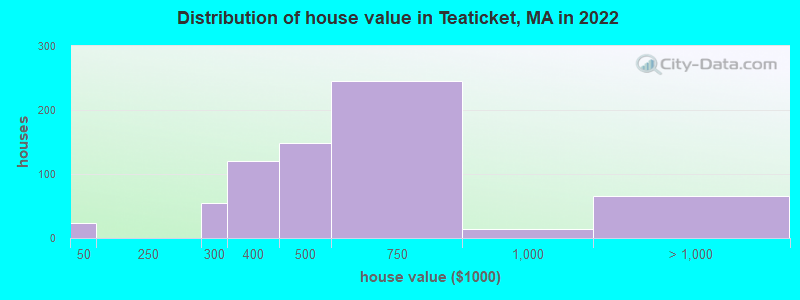
Home value of owner - occupied houses in 2022 in Teaticket, MA
-
- 23$15,000 to $19,999
- 54$250,000 to $299,999
- 120$300,000 to $399,999
- 149$400,000 to $499,999
- 245$500,000 to $749,999
- 14$750,000 to $999,999
- 13$1,000,000 to $1,499,999
- 51$2,000,000 or more
Rent paid by renters in 2022 in Teaticket, MA
-
- 21$250 to $299
- 6$450 to $499
- 18$1,000 to $1,249
- 1$1,250 to $1,499
- 13$2,000 to $2,499
- 17$2,500 to $2,999
- 9No cash rent


Percentage of workers working in this county: 89.4%
Number of people working at home: 219 (30.0% of all workers)
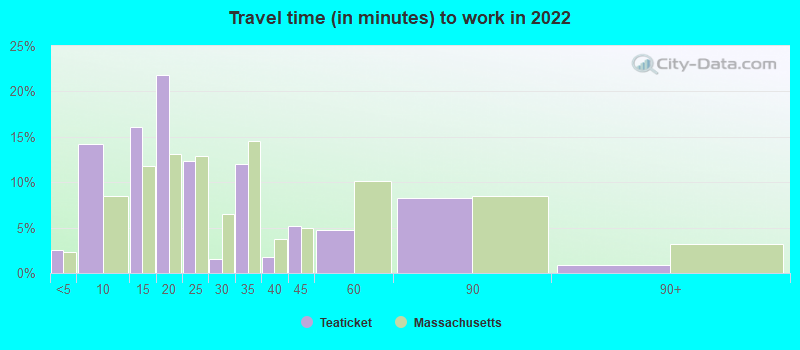
Travel time to work (commute)
- Less than 5 minutes: 22
- 5 to 9 minutes: 22
- 10 to 14 minutes: 89
- 15 to 19 minutes: 153
- 20 to 24 minutes: 32
- 25 to 29 minutes: 8
- 30 to 34 minutes: 13
- 35 to 39 minutes: 0
- 40 to 44 minutes: 56
- 45 to 59 minutes: 66
- 60 to 89 minutes: 38
- 90 or more minutes: 23
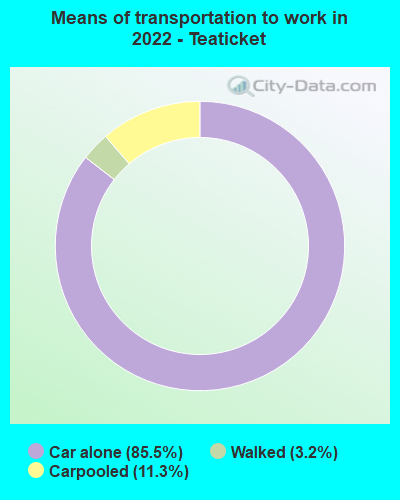
Means of transportation to work:
- Drove a car alone: 589 (64.8%)
- Carpooled: 76 (8.4%)
- Walked: 15 (1.7%)
- Worked at home: 219 (24.1%)

- Unemployment by race in 2022
- Unemployment rate for White non-Hispanic residents
- 3.1%Females

- Year of entry for the foreign-born population in Teaticket, Massachusetts
- 582010 or later
- 192000 to 2009
- 01990 to 1999
- 01980 to 1989
- 341970 to 1979
- 26Before 1970

First ancestries reported:
- Irish: 314 (38.2%)
- European: 81 (9.9%)
- Jamaican: 59 (7.2%)
- Portuguese: 56 (6.8%)
- American: 50 (6.1%)
- Italian: 50 (6.1%)
- English: 22 (2.7%)
- Lithuanian: 19 (2.3%)
- Eastern European: 18 (2.2%)
- Swedish: 18 (2.2%)
- Scottish: 15 (1.8%)
- French Canadian: 14 (1.7%)
- Scotch-Irish: 13 (1.6%)
- Ukrainian: 9 (1.1%)
- German: 7 (0.9%)
- Polish: 6 (0.7%)
- Russian: 6 (0.7%)
Most common places of birth for foreign-born residents (%):
| Teaticket: | 62.2% (69) |
| Massachusetts: | 1.7% (21,468) |
| Teaticket: | 20.7% (23) |
| Massachusetts: | 4.1% (50,360) |
| Teaticket: | 6.3% (7) |
| Massachusetts: | 0.2% (1,923) |
| Teaticket: | 6.3% (7) |
| Massachusetts: | 2.3% (27,810) |
| Teaticket: | 4.5% (5) |
| Massachusetts: | 1.4% (16,886) |
Place of birth for U.S.-born residents:
- This state: 1,117
- Other state: 364
- Northeast: 198
- Midwest: 45
- South: 79
- West: 42
93.8% of Teaticket residents lived in the same house 1 years ago.
Out of people who lived in different houses, 19.0% lived in this county.
Out of people who lived in different counties, 57.5% lived in Massachusetts.
| Teaticket: | 93.8% |
| State average: | 87.7% |
Education attainment for males 25 years and older:
- No schooling: 0
- Nursery to 4th grade: 0
- 5th and 6th grade: 0
- 7th and 8th grade: 0
- 9th grade: 0
- 10th grade: 6
- 11th grade: 0
- 12th grade, no diploma: 14
- High school graduate (or equivalency): 50
- Less than 1 year of college: 28
- Some college more than 1 year, no degree: 65
- Associate degree: 43
- Bachelor's degree: 118
- Master's degree: 135
- Professional school degree: 41
- Doctorate degree: 74

Education attainment for females 25 years and older:
- No schooling: 0
- Nursery to 4th grade: 0
- 5th and 6th grade: 0
- 7th and 8th grade: 0
- 9th grade: 0
- 10th grade: 0
- 11th grade: 0
- 12th grade, no diploma: 0
- High school graduate (or equivalency): 213
- Less than 1 year of college: 66
- Some college more than 1 year, no degree: 47
- Associate degree: 137
- Bachelor's degree: 149
- Master's degree: 101
- Professional school degree: 9
- Doctorate degree: 16


Housing units in structures:
- One, detached: 1,240
- One, attached: 96
- Two: 28
- 3 or 4: 49
- 5 to 9: 11
- 20 to 49: 30
House/condo owner moved in on average 17 years ago
Renter moved in on average 3 years ago

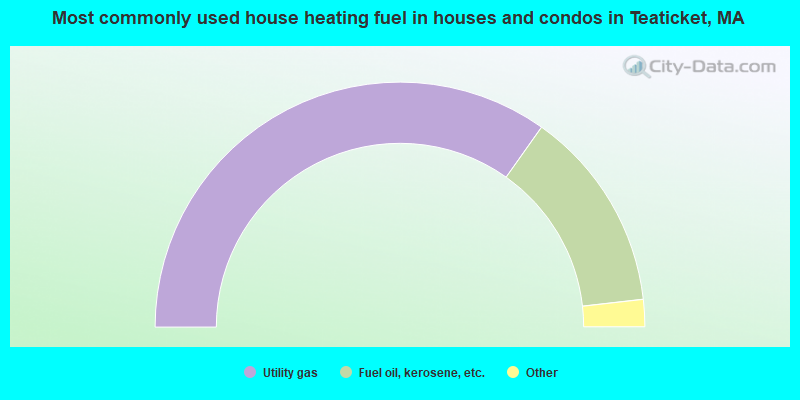
- 69.7%Utility gas
- 26.8%Fuel oil, kerosene, etc.
- 2.8%Electricity
- 0.7%Bottled, tank, or LP gas
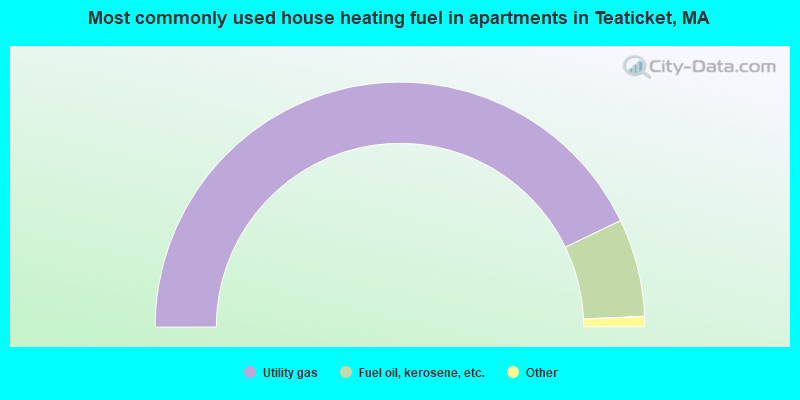
- 86.9%Utility gas
- 13.1%Fuel oil, kerosene, etc.
Private vs. public school enrollment:
| Here: | 0.0% |
| Massachusetts: | 10.3% |
| Here: | 37.5% |
| Massachusetts: | 12.3% |
| Here: | 0.0% |
| Massachusetts: | 51.2% |


