Taylorsville, UT (Utah) Houses and Residents
Estimated median house or condo value in 2022: $436,645 (it was $134,500 in 2000 )
Taylorsville:
$436,645Utah:
$499,500
Lower value quartile - upper value quartile: $348,086 - $521,187Mean price in 2022: Detached houses: $491,579 Here:
$491,579State:
$607,750
Townhouses or other attached units: $337,545 Here:
$337,545State:
$444,505
In 2-unit structures: $429,369 Here:
$429,369State:
$433,540
In 3-to-4-unit structures: $157,300 Here:
$157,300State:
$362,850
In 5-or-more-unit structures: $356,261 Here:
$356,261State:
$412,810
Mobile homes: $65,564 Here:
$65,564State:
$113,475
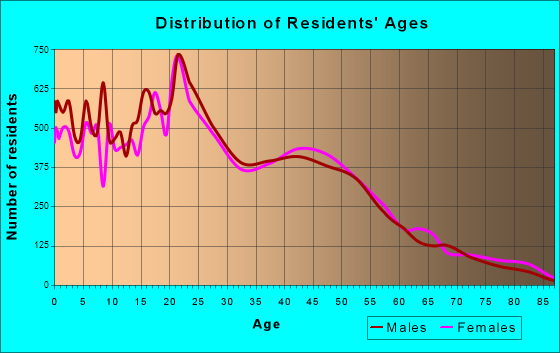
Total population: 60,433 (Urban population: 57,878, Rural population: 0)
Houses: 21,772 (20,947 occupied: 14,663 owner occupied, 6,155 renter occupied )
% of renters here:
30%State:
29%
Housing density: 2,038 houses/condos per square mile
Median price asked for vacant for-sale houses and condos in 2022: $494,804.
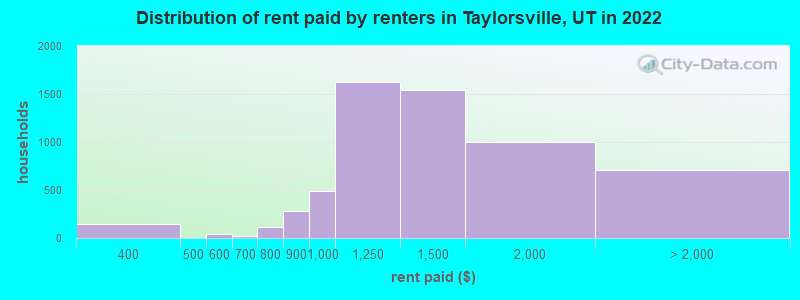
Median contract rent in 2022: $1,305 (lower quartile is $1,071, upper quartile is $1,567)
Median rent asked for vacant for-rent units in 2022: $1,918
Median gross rent in Taylorsville, UT in 2022: $1,389
Housing units in Taylorsville with a mortgage: 10,237 (1,422 second mortgage, 67 home equity loan, 983 both second mortgage and home equity loan )Houses without a mortgage: 507
Median household income for houses/condos with a mortgage: $103,367
Median household income for apartments without a mortgage: $69,828
Median monthly housing costs: $1,380
Data:
Median house or condo value ($)
Median house or condo value ($ change since 2000)
Median house or condo value ($) - White
Median house or condo value ($) - Black or African American
Median house or condo value ($) - Asian
Median house or condo value ($) - Hispanic or Latino
Median house or condo value ($) - American Indian and Alaska Native
Median house or condo value ($) - Multirace
Median house or condo value ($) - Other Race
Median price asked for mobile homes ($)
Household density (households per square mile)
Mean house or condo value by units in structure - 1, detached ($)
Mean house or condo value by units in structure - 1, attached ($)
Mean house or condo value by units in structure - 2 ($)
Mean house or condo value by units in structure by units in structure - 3 or 4 ($)
Mean house or condo value by units in structure - 5 or more ($)
Mean house or condo value by units in structure - Boat, RV, van, etc. ($)
Mean house or condo value by units in structure - Mobile home ($)
Median contract rent ($)
Median contract rent - Lower quartile ($)
Median contract rent - Upper quartile ($)
Median gross rent ($)
Urban houses (%)
Rural houses (%)
Houses occupied (%)
Houses occupied (% change since 2000)
Houses owner occupied (%)
Houses owner occupied (% change since 2000)
Houses renter occupied (%)
Houses renter occupied (% change since 2000)
Vacant housing units - For rent (%)
Vacant housing units - For rent (% change since 2000)
Vacant housing units - For sale only (%)
Vacant housing units - For sale only (% change since 2000)
Vacant housing units - Rented or sold, not occupied (%)
Vacant housing units - Rented or sold, not occupied (% change since 2000)
Vacant housing units - For seasonal, recreational, or occasional use (%)
Vacant housing units - For seasonal, recreational, or occasional use (% change since 2000)
Vacant housing units - For migrant workers (%)
Vacant housing units - For migrant workers (% change since 2000)
Vacant housing units - Other vacant (%)
Vacant housing units - Other vacant (% change since 2000)
Median monthly housing costs ($)
Median household income for houses/condos with a mortgage ($)
Median household income for houses/condos without a mortgage ($)
Median household income ($)
Median household income ($) - White
Median household income ($) - Black or African American
Median household income ($) - Asian
Median household income ($) - Hispanic or Latino
Median household income ($) - American Indian and Alaska Native
Median household income ($) - Multirace
Median household income ($) - Other Race
Mortgage status - with mortgage (%)
Mortgage status - with second mortgage (%)
Mortgage status - with home equity loan (%)
Mortgage status - with both second mortgage and home equity loan (%)
Mortgage status - without a mortgage (%)
Median year house/condo built
Median year apartment built
Household type by relationship - Male householder living alone (%)
Household type by relationship - Male householder not living alone (%)
Household type by relationship - Female householder living alone (%)
Household type by relationship - Female householder not living alone (%)
Household type by relationship - Opposite-Sex spouse (%)
Household type by relationship - Same-Sex spouse (%)
Household type by relationship - Opposite-Sex unmarried partner (%)
Household type by relationship - Same-Sex unmarried partner (%)
Household type by relationship - In group quarters (%)
Size of family households - 2-person household (%)
Size of family households - 3-person household (%)
Size of family households - 4-person household (%)
Size of family households - 5-person household (%)
Size of family households - 6-person household (%)
Size of family households - 7-or-more-person household (%)
Size of nonfamily households - 1-person household (%)
Size of nonfamily households - 2-person household (%)
Size of nonfamily households - 3-person household (%)
Size of nonfamily households - 4-person household (%)
Size of nonfamily households - 5-person household (%)
Size of nonfamily households - 6-person household (%)
Size of nonfamily households - 7-or-moreperson household (%)
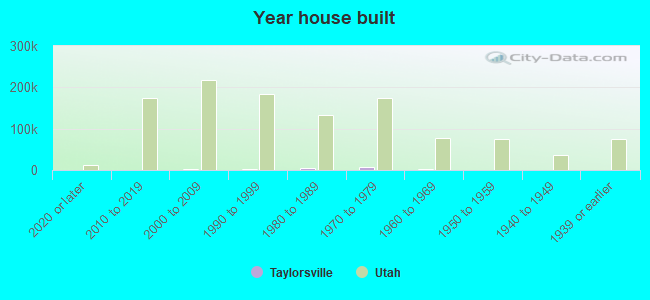
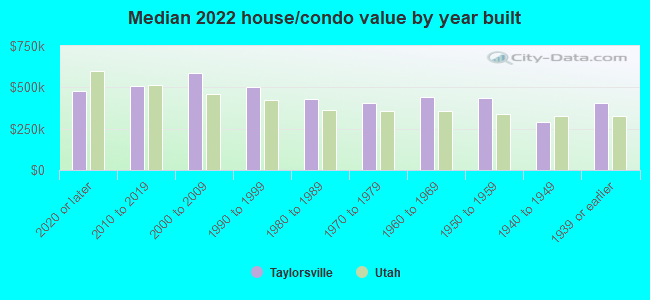
Year house built - Built 2010 or later (%)
Year house built - Built 2000 to 2009 (%)
Year house built - Built 1990 to 1999 (%)
Year house built - Built 1980 to 1989 (%)
Year house built - Built 1970 to 1979 (%)
Year house built - Built 1960 to 1969 (%)
Year house built - Built 1950 to 1959 (%)
Year house built - Built 1940 to 1949 (%)
Year house built - Built 1939 or earlier (%)
Median number of rooms in houses and condos
Median number of rooms in apartments
Median number of bedrooms in owner occupied houses
Mean number of bedrooms in owner occupied houses
Median number of bedrooms in renter occupied houses
Mean number of bedrooms in renter occupied houses
Median number of vehichles in owner occupied houses
Mean number of vehichles in owner occupied houses
Median number of vehichles in renter occupied houses
Mean number of vehichles in renter occupied houses
Rooms in owner-occupied houses - 1 room (%)
Rooms in owner-occupied houses - 2 rooms (%)
Rooms in owner-occupied houses - 3 rooms (%)
Rooms in owner-occupied houses - 4 rooms (%)
Rooms in owner-occupied houses - 5 rooms (%)
Rooms in owner-occupied houses - 6 rooms (%)
Rooms in owner-occupied houses - 7 rooms (%)
Rooms in owner-occupied houses - 8 rooms (%)
Rooms in owner-occupied houses - 9+ rooms (%)
Rooms in renter-occupied houses - 1 room (%)
Rooms in renter-occupied houses - 2 rooms (%)
Rooms in renter-occupied houses - 3 rooms (%)
Rooms in renter-occupied houses - 4 rooms (%)
Rooms in renter-occupied houses - 5 rooms (%)
Rooms in renter-occupied houses - 6 rooms (%)
Rooms in renter-occupied houses - 7 rooms (%)
Rooms in renter-occupied houses - 8 rooms (%)
Rooms in renter-occupied houses - 9+ rooms (%)
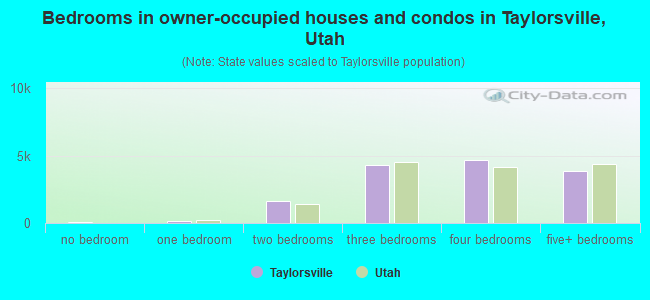
Bedrooms in owner-occupied houses - no bedrooms (%)
Bedrooms in owner-occupied houses - 1 bedroom (%)
Bedrooms in owner-occupied houses - 2 bedrooms (%)
Bedrooms in owner-occupied houses - 3 bedrooms (%)
Bedrooms in owner-occupied houses - 4 bedrooms (%)
Bedrooms in owner-occupied houses - 5+ bedrooms (%)
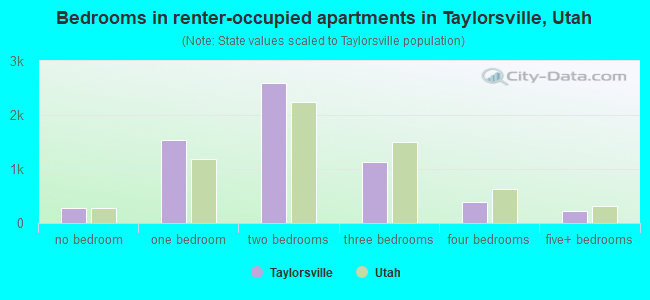
Bedrooms in renter-occupied houses - no bedrooms (%)
Bedrooms in renter-occupied houses - 1 bedroom (%)
Bedrooms in renter-occupied houses - 2 bedrooms (%)
Bedrooms in renter-occupied houses - 3 bedrooms (%)
Bedrooms in renter-occupied houses - 4 bedrooms (%)
Bedrooms in renter-occupied houses - 5+ bedrooms (%)
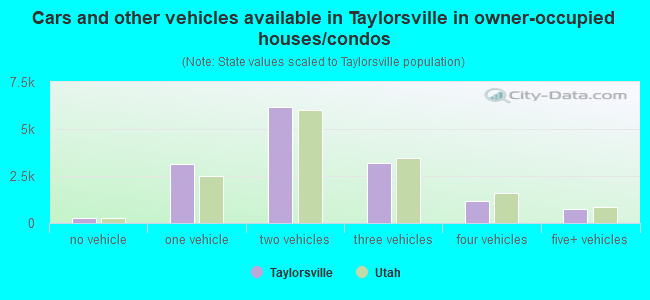
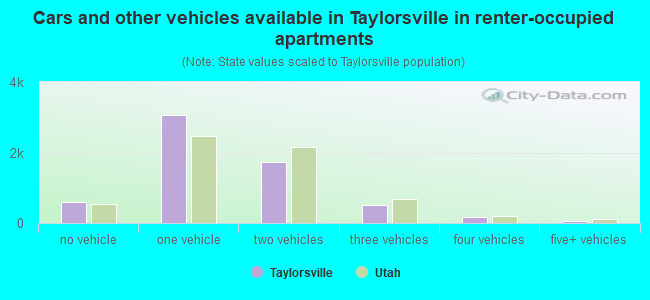
Vehicles available in owner-occupied houses - no vehicle available (%)
Vehicles available in owner-occupied houses - 1 vehicle available(%)
Vehicles available in owner-occupied houses - 2 Vehicles available (%)
Vehicles available in owner-occupied houses - 3 Vehicles available (%)
Vehicles available in owner-occupied houses - 4 Vehicles available (%)
Vehicles available in owner-occupied houses - 5+ Vehicles available (%)
Vehicles available in renter-occupied houses - no vehicle available (%)
Vehicles available in renter-occupied houses - 1 vehicle available (%)
Vehicles available in renter-occupied houses - 2 Vehicles available (%)
Vehicles available in renter-occupied houses - 3 Vehicles available (%)
Vehicles available in renter-occupied houses - 4 Vehicles available (%)
Vehicles available in renter-occupied houses - 5+ Vehicles available (%)
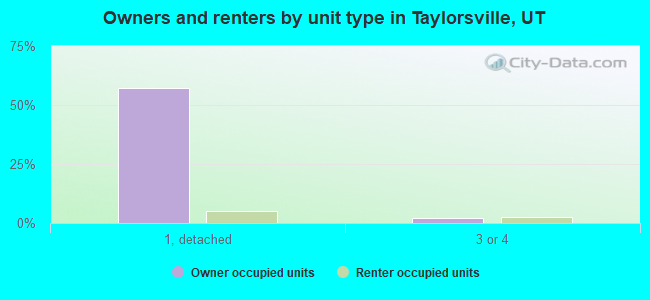
Housing units in structures - 1, detached (%)
Housing units in structures - 1, attached (%)
Housing units in structures - 2 (%)
Housing units in structures - 3 or 4 (%)
Housing units in structures - 5 to 9 (%)
Housing units in structures - 10 to 19 (%)
Housing units in structures - 20 to 49 (%)
Housing units in structures - 50 or more (%)
Housing units in structures - Mobile home (%)
Housing units in structures - Boat, RV, van, etc. (%)
Housing units in structures - Owners - 1, detached (%)
Housing units in structures - Owners - 1, attached (%)
Housing units in structures - Owners - 2 (%)
Housing units in structures - Owners - 3 or 4 (%)
Housing units in structures - Owners - 5 to 9 (%)
Housing units in structures - Owners - 10 to 19 (%)
Housing units in structures - Owners - 20 to 49 (%)
Housing units in structures - Owners - 50 or more (%)
Housing units in structures - Owners - Mobile home (%)
Housing units in structures - Owners - Boat, RV, van, etc. (%)
Housing units in structures - Renters - 1, detached (%)
Housing units in structures - Renters - 1, attached (%)
Housing units in structures - Renters - 2 (%)
Housing units in structures - Renters - 3 or 4 (%)
Housing units in structures - Renters - 5 to 9 (%)
Housing units in structures - Renters - 10 to 19 (%)
Housing units in structures - Renters - 20 to 49 (%)
Housing units in structures - Renters - 50 or more (%)
Housing units in structures - Renters - Mobile home (%)
Housing units in structures - Renters - Boat, RV, van, etc. (%)
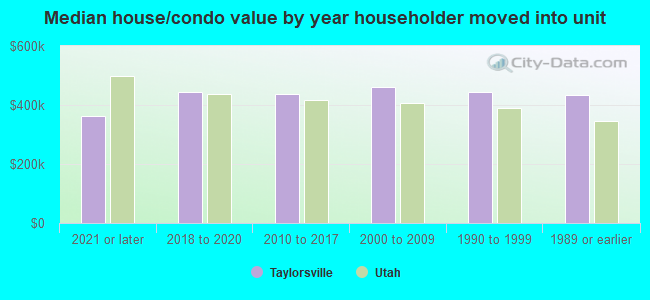
House/condo owner moved in on average (years ago)
Renter moved in on average (years ago)
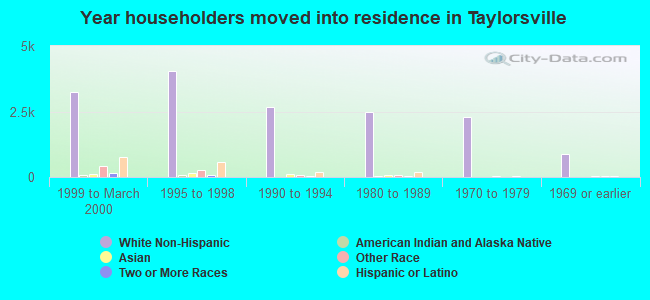
Year householder moved into unit - Moved in 1999 to March 2000 (%)
Year householder moved into unit - Moved in 1999 to March 2000 (%) - White
Year householder moved into unit - Moved in 1999 to March 2000 (%) - Black or African American
Year householder moved into unit - Moved in 1999 to March 2000 (%) - Asian
Year householder moved into unit - Moved in 1999 to March 2000 (%) - Hispanic or Latino
Year householder moved into unit - Moved in 1999 to March 2000 (%) - American Indian and Alaska Native
Year householder moved into unit - Moved in 1999 to March 2000 (%) - Multirace
Year householder moved into unit - Moved in 1999 to March 2000 (%) - Other Race
Year householder moved into unit - Moved in 1995 to 1998 (%)
Year householder moved into unit - Moved in 1995 to 1998 (%) - White
Year householder moved into unit - Moved in 1995 to 1998 (%) - Black or African American
Year householder moved into unit - Moved in 1995 to 1998 (%) - Asian
Year householder moved into unit - Moved in 1995 to 1998 (%) - Hispanic or Latino
Year householder moved into unit - Moved in 1995 to 1998 (%) - American Indian and Alaska Native
Year householder moved into unit - Moved in 1995 to 1998 (%) - Multirace
Year householder moved into unit - Moved in 1995 to 1998 (%) - Other Race
Year householder moved into unit - Moved in 1990 to 1994 (%)
Year householder moved into unit - Moved in 1990 to 1994 (%) - White
Year householder moved into unit - Moved in 1990 to 1994 (%) - Black or African American
Year householder moved into unit - Moved in 1990 to 1994 (%) - Asian
Year householder moved into unit - Moved in 1990 to 1994 (%) - Hispanic or Latino
Year householder moved into unit - Moved in 1990 to 1994 (%) - American Indian and Alaska Native
Year householder moved into unit - Moved in 1990 to 1994 (%) - Multirace
Year householder moved into unit - Moved in 1990 to 1994 (%) - Other Race
Year householder moved into unit - Moved in 1980 to 1989 (%)
Year householder moved into unit - Moved in 1980 to 1989 (%) - White
Year householder moved into unit - Moved in 1980 to 1989 (%) - Black or African American
Year householder moved into unit - Moved in 1980 to 1989 (%) - Asian
Year householder moved into unit - Moved in 1980 to 1989 (%) - Hispanic or Latino
Year householder moved into unit - Moved in 1980 to 1989 (%) - American Indian and Alaska Native
Year householder moved into unit - Moved in 1980 to 1989 (%) - Multirace
Year householder moved into unit - Moved in 1980 to 1989 (%) - Other Race
Year householder moved into unit - Moved in 1970 to 1979 (%)
Year householder moved into unit - Moved in 1970 to 1979 (%) - White
Year householder moved into unit - Moved in 1970 to 1979 (%) - Black or African American
Year householder moved into unit - Moved in 1970 to 1979 (%) - Asian
Year householder moved into unit - Moved in 1970 to 1979 (%) - Hispanic or Latino
Year householder moved into unit - Moved in 1970 to 1979 (%) - American Indian and Alaska Native
Year householder moved into unit - Moved in 1970 to 1979 (%) - Multirace
Year householder moved into unit - Moved in 1970 to 1979 (%) - Other Race
Year householder moved into unit - Moved in 1969 or earlier (%)
Year householder moved into unit - Moved in 1969 or earlier (%) - White
Year householder moved into unit - Moved in 1969 or earlier (%) - Black or African American
Year householder moved into unit - Moved in 1969 or earlier (%) - Asian
Year householder moved into unit - Moved in 1969 or earlier (%) - Hispanic or Latino
Year householder moved into unit - Moved in 1969 or earlier (%) - American Indian and Alaska Native
Year householder moved into unit - Moved in 1969 or earlier (%) - Multirace
Year householder moved into unit - Moved in 1969 or earlier (%) - Other Race
Housing units lacking complete plumbing facilities (%)
Housing units lacking complete kitchen facilities (%)
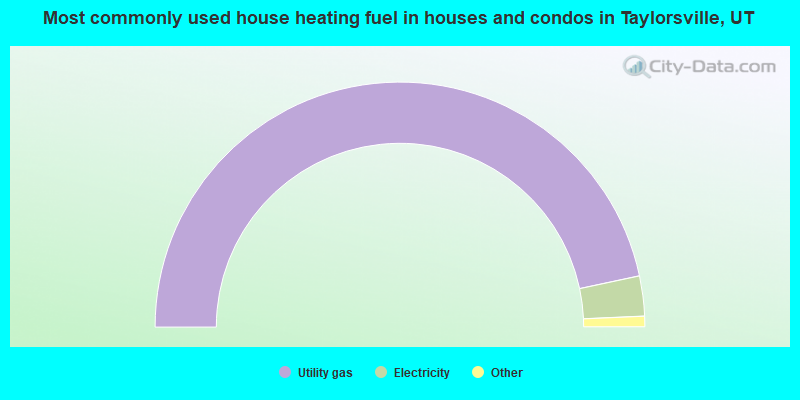
House heating fuel used in houses and condos - Utility gas (%)
House heating fuel used in houses and condos - Bottled, tank, or LP gas (%)
House heating fuel used in houses and condos - Electricity (%)
House heating fuel used in houses and condos - Fuel oil, kerosene, etc. (%)
House heating fuel used in houses and condos - Coal or coke (%)
House heating fuel used in houses and condos - Wood (%)
House heating fuel used in houses and condos - Solar energy (%)
House heating fuel used in houses and condos - Other fuel (%)
House heating fuel used in houses and condos - No fuel used (%)
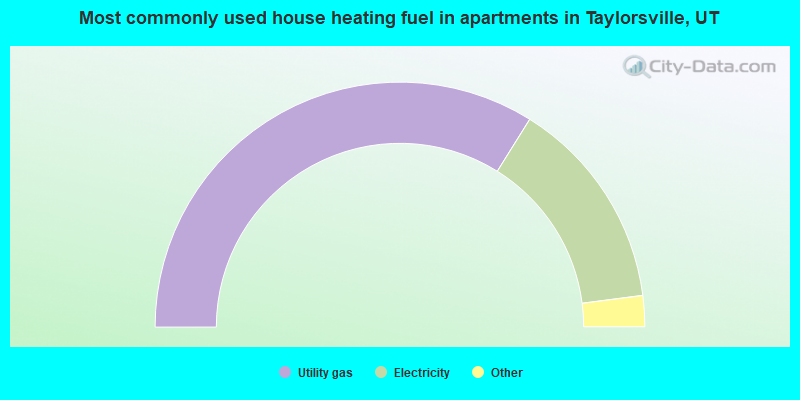
House heating fuel used in apartments - Utility gas (%)
House heating fuel used in apartments - Bottled, tank, or LP gas (%)
House heating fuel used in apartments - Electricity (%)
House heating fuel used in apartments - Fuel oil, kerosene, etc. (%)
House heating fuel used in apartments - Coal or coke (%)
House heating fuel used in apartments - Wood (%)
House heating fuel used in apartments - Solar energy (%)
House heating fuel used in apartments - Other fuel (%)
House heating fuel used in apartments - No fuel used (%)
Latest news about housing in Taylorsville, UT collected exclusively by city-data.com from local newspapers, TV, and radio stations
Median year house/condo built: 1978Median year apartment built: 1987Household type by relationship:
Households: 60,013
Male householders: 10,636 (2,161 living alone ), Female householders: 9,461 (2,129 living alone )10,400 spouses (10,231 opposite-sex spouses ), 1,586 unmarried partners , (1,512 opposite-sex unmarried partners ), 20,108 children (18,799 natural , 268 adopted , 1,039 stepchildren ), 1,560 grandchildren , 1,014 brothers or sisters , 961 parents , 11 foster children , 1,612 other relatives , 2,441 non-relatives In group quarters: 218
Size of family households: 5,945 2-persons , 3,167 3-persons , 2,491 4-persons , 1,572 5-persons , 960 6-persons , 732 7-or-more-persons .
Size of nonfamily households: 4,340 1-person , 1,259 2-persons , 140 3-persons , 98 4-persons , 16 5-persons , 24 6-persons .
9,450 married couples with children. single-parent households (902 men , 3,636 women ).
71.9% of residents of Taylorsville speak English at home. of residents speak Spanish at home (55% speak English very well , 21% speak English well , 19% speak English not well , 5% don't speak English at all ).of residents speak other Indo-European language at home (61% speak English very well , 31% speak English well , 6% speak English not well , 1% don't speak English at all ).of residents speak Asian or Pacific Island language at home (49% speak English very well , 26% speak English well , 18% speak English not well , 8% don't speak English at all ).of residents speak other language at home (93% speak English very well , 4% speak English well , 1% speak English not well , 1% don't speak English at all ).
Foreign born population: 10,962 (18.3%)of them are naturalized citizens )
Median number of rooms in houses and condos:
Median number of rooms in apartments
Owner-occupied Renter-occupied
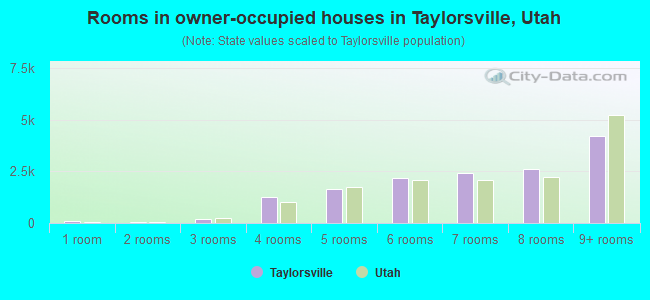
Rooms in owner-occupied houses in Taylorsville, Utah
77 1 room 47 2 rooms 196 3 rooms 1,280 4 rooms 1,636 5 rooms 2,173 6 rooms 2,442 7 rooms 2,611 8 rooms 4,202 9+ rooms
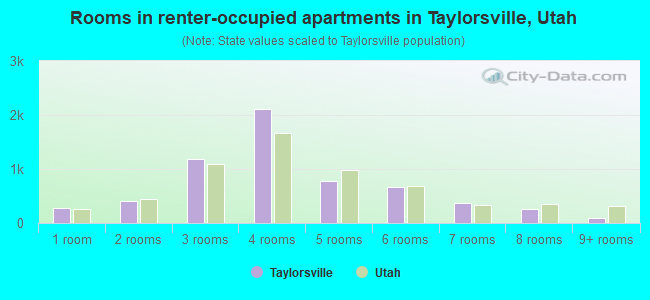
Rooms in renter-occupied apartments in Taylorsville, Utah
286 1 room 413 2 rooms 1,193 3 rooms 2,111 4 rooms 771 5 rooms 660 6 rooms 366 7 rooms 262 8 rooms 93 9+ rooms
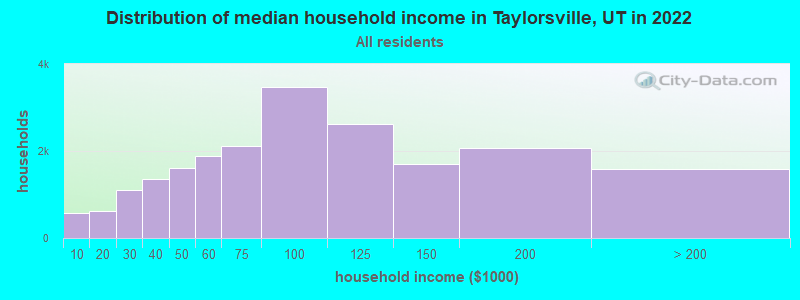
Taylorsville, UT household income distribution 567 Less than $10,000612 $10,000 to $19,9991,113 $20,000 to $29,9991,348 $30,000 to $39,9991,603 $40,000 to $49,9991,885 $50,000 to $59,9992,125 $60,000 to $74,9993,471 $75,000 to $99,9992,616 $100,000 to $124,9991,696 $125,000 to $149,9992,063 $150,000 to $199,9991,590 $200,000 or more
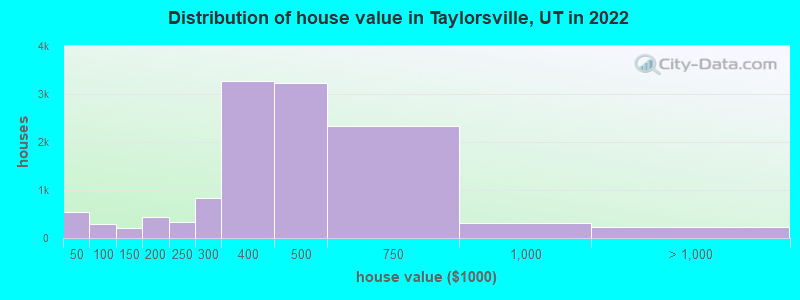
Home value of owner - occupied houses in 2022 in Taylorsville, UT 193 Less than $10,00015 $10,000 to $14,99950 $15,000 to $19,99935 $20,000 to $24,99978 $25,000 to $29,999107 $30,000 to $34,99928 $35,000 to $39,99931 $40,000 to $49,999118 $50,000 to $59,99941 $60,000 to $69,9997 $70,000 to $79,99989 $80,000 to $89,99911 $90,000 to $99,99995 $100,000 to $124,999106 $125,000 to $149,999174 $150,000 to $174,999261 $175,000 to $199,999340 $200,000 to $249,999839 $250,000 to $299,9993,281 $300,000 to $399,9993,227 $400,000 to $499,9992,327 $500,000 to $749,999309 $750,000 to $999,999154 $1,000,000 to $1,499,99969 $2,000,000 or moreRent paid by renters in 2022 in Taylorsville, UT 2 Less than $1007 $250 to $299129 $300 to $34920 $350 to $39945 $550 to $59912 $600 to $6496 $650 to $69981 $700 to $74933 $750 to $799283 $800 to $899484 $900 to $9991,630 $1,000 to $1,2491,546 $1,250 to $1,499999 $1,500 to $1,999403 $2,000 to $2,499122 $2,500 to $2,999183 No cash rent
Percentage of workers working in this county: 93.7%Number of people working at home: 4,839 (15.5% of all workers )
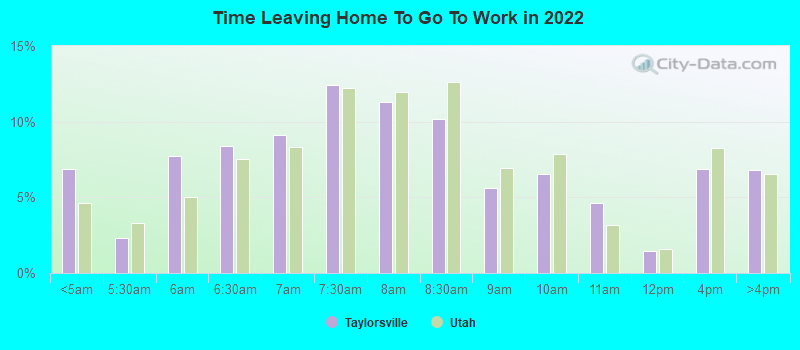
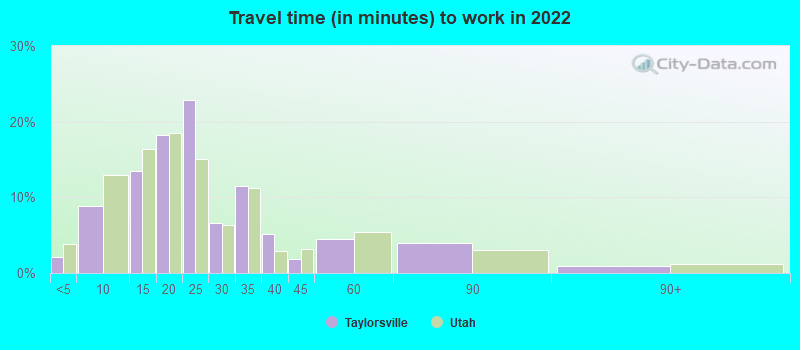
Travel time to work (commute)
Less than 5 minutes: 4255 to 9 minutes: 1,76610 to 14 minutes: 3,83815 to 19 minutes: 6,90320 to 24 minutes: 5,79025 to 29 minutes: 1,71730 to 34 minutes: 2,82335 to 39 minutes: 56940 to 44 minutes: 59745 to 59 minutes: 53060 to 89 minutes: 65690 or more minutes: 393
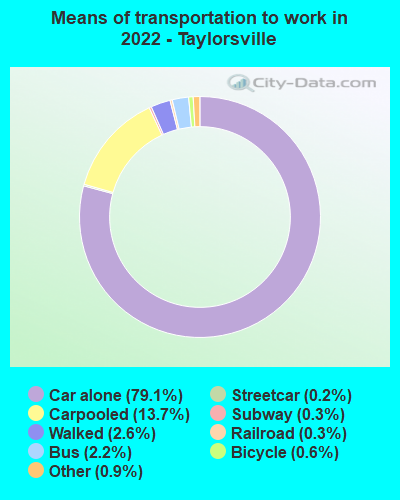
Means of transportation to work:
Drove a car alone: 12,140 (61.2%)Carpooled: 2,254 (11.4%)Bus : 242 (1.2%)Subway or elevated rail : 22 (0.1%)Long-distance train or commuter rail : 27 (0.1%)Light rail, streetcar or trolley : 37 (0.2%)Taxi: 150 (0.8%)Bicycle: 82 (0.4%)Walked: 411 (2.1%)Worked at home: 4,839 (24.4%)
Unemployment by race in 2022
Unemployment rate for White non-Hispanic residents 2.5% Males3.0% FemalesUnemployment rate for Asian residents 15.4% Males2.6% FemalesUnemployment rate for other race residents 0.5% Males4.3% FemalesUnemployment rate for two or more race residents 1.9% Males6.2% FemalesUnemployment rate for Hispanic or Latino residents 0.3% Males5.0% Females
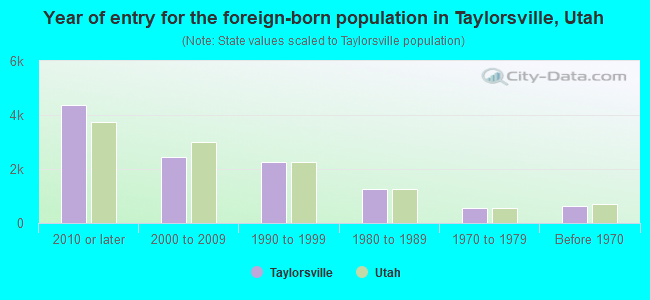
Year of entry for the foreign-born population in Taylorsville, Utah
4,383 2010 or later 2,437 2000 to 2009 2,256 1990 to 1999 1,242 1980 to 1989 574 1970 to 1979 641 Before 1970
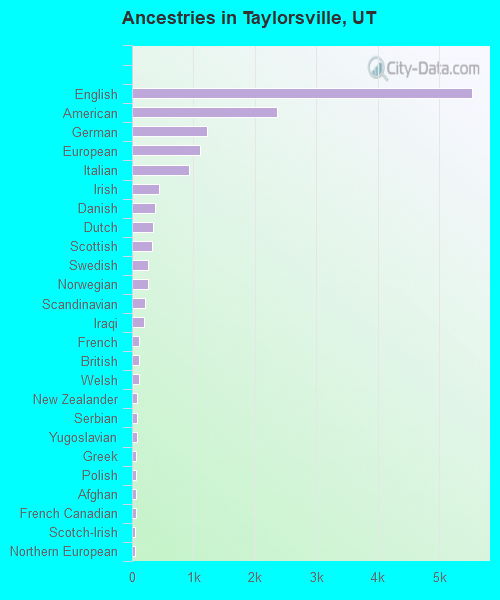
First ancestries reported:
English: 5,537 (17.6%)
American: 2,359 (7.5%)
German: 1,215 (3.9%)
European: 1,114 (3.5%)
Italian: 924 (2.9%)
Irish: 440 (1.4%)
Danish: 380 (1.2%)
Dutch: 342 (1.1%)
Scottish: 324 (1.0%)
Swedish: 258 (0.8%)
Norwegian: 257 (0.8%)
Scandinavian: 217 (0.7%)
Iraqi: 201 (0.6%)
French: 120 (0.4%)
British: 117 (0.4%)
Welsh: 114 (0.4%)
New Zealander: 79 (0.3%)
Serbian: 79 (0.3%)
Yugoslavian: 77 (0.2%)
Greek: 71 (0.2%)
Polish: 70 (0.2%)
Afghan: 63 (0.2%)
French Canadian: 58 (0.2%)
Scotch-Irish: 53 (0.2%)
Northern European: 51 (0.2%)
Brazilian: 49 (0.2%)
Jamaican: 42 (0.1%)
African: 38 (0.1%)
Syrian: 37 (0.1%)
Russian: 35 (0.1%)
Portuguese: 29 (0.09%)
Canadian: 28 (0.09%)
Iranian: 20 (0.06%)
Czech: 19 (0.06%)
Hungarian: 16 (0.05%)
Eastern European: 11 (0.03%)
Swiss: 11 (0.03%)
Armenian: 8 (0.03%)
Arab: 7 (0.02%)
Lithuanian: 7 (0.02%)
Croatian: 4 (0.01%)
Kenyan: 2 (0.01%) Most common places of birth for foreign-born residents (%): Mexico Taylorsville:
37.6% (4,160)Utah:
36.1% (99,740)
Vietnam Taylorsville:
11.1% (1,228)Utah:
2.6% (7,211)
China, excluding Hong Kong and Taiwan Taylorsville:
5.9% (649)Utah:
2.9% (8,017)
Philippines Taylorsville:
5.4% (598)Utah:
2.3% (6,468)
India Taylorsville:
3.6% (397)Utah:
3.0% (8,294)
Venezuela Taylorsville:
3.4% (375)Utah:
3.2% (8,804)
Colombia Taylorsville:
3.1% (345)Utah:
2.0% (5,555)
Korea Taylorsville:
2.9% (325)Utah:
1.6% (4,524)
Oceania, n.e.c. Taylorsville:
2.8% (305)Utah:
2.7% (7,472)
El Salvador Taylorsville:
2.6% (293)Utah:
2.6% (7,062)
Other Eastern Africa Taylorsville:
2.2% (239)Utah:
0.5% (1,475)
Ecuador Taylorsville:
1.8% (202)Utah:
0.7% (1,957)
Brazil Taylorsville:
1.7% (192)Utah:
2.8% (7,644)
Iraq Taylorsville:
1.6% (178)Utah:
0.6% (1,700)
Place of birth for U.S.-born residents:
This state: 34,911Other state: 13,560Northeast: 1,110Midwest: 1,597South: 2,100West: 8,583 85.2% of Taylorsville residents lived in the same house 1 years ago.
Out of people who lived in different houses, 44.8% lived in this county.
Out of people who lived in different counties, 37.2% lived in Utah.
Taylorsville:
85.2%State average:
85.7%
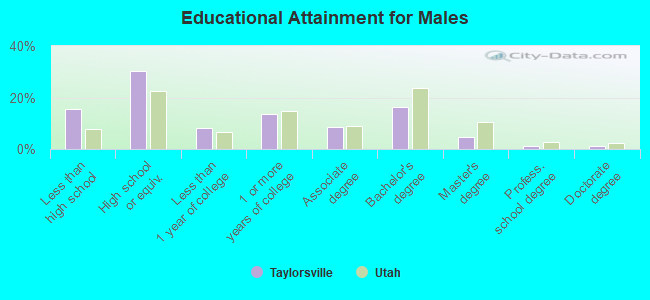
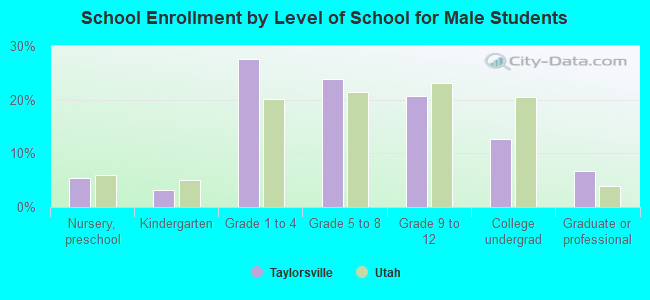
Education attainment for males 25 years and older:
No schooling: 649Nursery to 4th grade: 715th and 6th grade: 8077th and 8th grade: 1039th grade: 14010th grade: 30911th grade: 25712th grade, no diploma: 689High school graduate (or equivalency): 5,869Less than 1 year of college: 1,595Some college more than 1 year, no degree: 2,639Associate degree: 1,644Bachelor's degree: 3,137Master's degree: 893Professional school degree: 260Doctorate degree: 236
Education attainment for females 25 years and older:
No schooling: 494Nursery to 4th grade: 25th and 6th grade: 2767th and 8th grade: 2269th grade: 8510th grade: 32011th grade: 32112th grade, no diploma: 443High school graduate (or equivalency): 5,832Less than 1 year of college: 1,838Some college more than 1 year, no degree: 2,995Associate degree: 1,846Bachelor's degree: 3,891Master's degree: 805Professional school degree: 167Doctorate degree: 102
Housing units in structures:
One, detached: 13,564One, attached: 1,538Two: 3043 or 4: 8725 to 9: 1,38510 to 19: 1,27020 to 49: 1,07050 or more: 971Mobile homes: 794Median worth of mobile homes: $51,476
Housing units lacking complete plumbing facilities in 2022: 0.4%Housing units lacking complete kitchen facilities in 2022: 0.6%House/condo owner moved in on average 12 years ago
Renter moved in on average 3 years ago
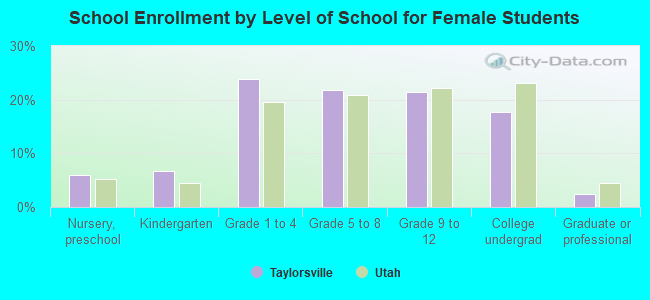
Private vs. public school enrollment:
Students in private schools in grades 1 to 8 (elementary and middle school): 717 Students in private schools in grades 9 to 12 (high school): 129 Students in private undergraduate colleges: 501