Taylor, MI (Michigan) Houses and Residents
Estimated median house or condo value in 2022: $144,729 (it was $91,100 in 2000 )
Taylor:
$144,729Michigan:
$224,400
Lower value quartile - upper value quartile: $114,873 - $188,344Mean price in 2022: Detached houses: $125,680 Here:
$125,680State:
$280,038
Townhouses or other attached units: $113,210 Here:
$113,210State:
$239,520
In 3-to-4-unit structures: $83,188 Here:
$83,188State:
$207,067
In 5-or-more-unit structures: $92,404 Here:
$92,404State:
$192,733
Mobile homes: $109,277 Here:
$109,277State:
$72,868
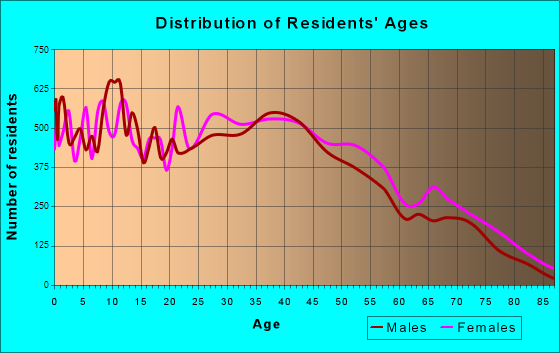
Total population: 61,594 (All urban)
Houses: 26,429 (24,778 occupied: 16,208 owner occupied, 8,712 renter occupied )
% of renters here:
35%State:
27%
Housing density: 1,119 houses/condos per square mile
Median price asked for vacant for-sale houses and condos in 2022: $145,295.
Median contract rent in 2022: $841 (lower quartile is $691, upper quartile is $1,026)
Median rent asked for vacant for-rent units in 2022: $1,137
Median gross rent in Taylor, MI in 2022: $988
Housing units in Taylor with a mortgage: 9,472 (902 second mortgage, 13 home equity loan, 735 both second mortgage and home equity loan )Houses without a mortgage: 480
Median household income for houses/condos with a mortgage: $77,535
Median household income for apartments without a mortgage: $51,279
Median monthly housing costs: $917
Data:
Median house or condo value ($)
Median house or condo value ($ change since 2000)
Median house or condo value ($) - White
Median house or condo value ($) - Black or African American
Median house or condo value ($) - Asian
Median house or condo value ($) - Hispanic or Latino
Median house or condo value ($) - American Indian and Alaska Native
Median house or condo value ($) - Multirace
Median house or condo value ($) - Other Race
Median price asked for mobile homes ($)
Household density (households per square mile)
Mean house or condo value by units in structure - 1, detached ($)
Mean house or condo value by units in structure - 1, attached ($)
Mean house or condo value by units in structure - 2 ($)
Mean house or condo value by units in structure by units in structure - 3 or 4 ($)
Mean house or condo value by units in structure - 5 or more ($)
Mean house or condo value by units in structure - Boat, RV, van, etc. ($)
Mean house or condo value by units in structure - Mobile home ($)
Median contract rent ($)
Median contract rent - Lower quartile ($)
Median contract rent - Upper quartile ($)
Median gross rent ($)
Urban houses (%)
Rural houses (%)
Houses occupied (%)
Houses occupied (% change since 2000)
Houses owner occupied (%)
Houses owner occupied (% change since 2000)
Houses renter occupied (%)
Houses renter occupied (% change since 2000)
Vacant housing units - For rent (%)
Vacant housing units - For rent (% change since 2000)
Vacant housing units - For sale only (%)
Vacant housing units - For sale only (% change since 2000)
Vacant housing units - Rented or sold, not occupied (%)
Vacant housing units - Rented or sold, not occupied (% change since 2000)
Vacant housing units - For seasonal, recreational, or occasional use (%)
Vacant housing units - For seasonal, recreational, or occasional use (% change since 2000)
Vacant housing units - For migrant workers (%)
Vacant housing units - For migrant workers (% change since 2000)
Vacant housing units - Other vacant (%)
Vacant housing units - Other vacant (% change since 2000)
Median monthly housing costs ($)
Median household income for houses/condos with a mortgage ($)
Median household income for houses/condos without a mortgage ($)
Median household income ($)
Median household income ($) - White
Median household income ($) - Black or African American
Median household income ($) - Asian
Median household income ($) - Hispanic or Latino
Median household income ($) - American Indian and Alaska Native
Median household income ($) - Multirace
Median household income ($) - Other Race
Mortgage status - with mortgage (%)
Mortgage status - with second mortgage (%)
Mortgage status - with home equity loan (%)
Mortgage status - with both second mortgage and home equity loan (%)
Mortgage status - without a mortgage (%)
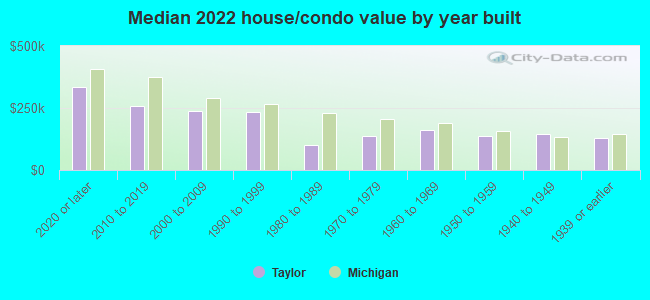
Median year house/condo built
Median year apartment built
Household type by relationship - Male householder living alone (%)
Household type by relationship - Male householder not living alone (%)
Household type by relationship - Female householder living alone (%)
Household type by relationship - Female householder not living alone (%)
Household type by relationship - Opposite-Sex spouse (%)
Household type by relationship - Same-Sex spouse (%)
Household type by relationship - Opposite-Sex unmarried partner (%)
Household type by relationship - Same-Sex unmarried partner (%)
Household type by relationship - In group quarters (%)
Size of family households - 2-person household (%)
Size of family households - 3-person household (%)
Size of family households - 4-person household (%)
Size of family households - 5-person household (%)
Size of family households - 6-person household (%)
Size of family households - 7-or-more-person household (%)
Size of nonfamily households - 1-person household (%)
Size of nonfamily households - 2-person household (%)
Size of nonfamily households - 3-person household (%)
Size of nonfamily households - 4-person household (%)
Size of nonfamily households - 5-person household (%)
Size of nonfamily households - 6-person household (%)
Size of nonfamily households - 7-or-moreperson household (%)
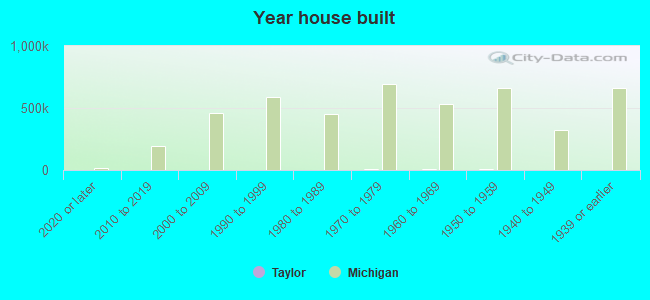
Year house built - Built 2010 or later (%)
Year house built - Built 2000 to 2009 (%)
Year house built - Built 1990 to 1999 (%)
Year house built - Built 1980 to 1989 (%)
Year house built - Built 1970 to 1979 (%)
Year house built - Built 1960 to 1969 (%)
Year house built - Built 1950 to 1959 (%)
Year house built - Built 1940 to 1949 (%)
Year house built - Built 1939 or earlier (%)
Median number of rooms in houses and condos
Median number of rooms in apartments
Median number of bedrooms in owner occupied houses
Mean number of bedrooms in owner occupied houses
Median number of bedrooms in renter occupied houses
Mean number of bedrooms in renter occupied houses
Median number of vehichles in owner occupied houses
Mean number of vehichles in owner occupied houses
Median number of vehichles in renter occupied houses
Mean number of vehichles in renter occupied houses
Rooms in owner-occupied houses - 1 room (%)
Rooms in owner-occupied houses - 2 rooms (%)
Rooms in owner-occupied houses - 3 rooms (%)
Rooms in owner-occupied houses - 4 rooms (%)
Rooms in owner-occupied houses - 5 rooms (%)
Rooms in owner-occupied houses - 6 rooms (%)
Rooms in owner-occupied houses - 7 rooms (%)
Rooms in owner-occupied houses - 8 rooms (%)
Rooms in owner-occupied houses - 9+ rooms (%)
Rooms in renter-occupied houses - 1 room (%)
Rooms in renter-occupied houses - 2 rooms (%)
Rooms in renter-occupied houses - 3 rooms (%)
Rooms in renter-occupied houses - 4 rooms (%)
Rooms in renter-occupied houses - 5 rooms (%)
Rooms in renter-occupied houses - 6 rooms (%)
Rooms in renter-occupied houses - 7 rooms (%)
Rooms in renter-occupied houses - 8 rooms (%)
Rooms in renter-occupied houses - 9+ rooms (%)
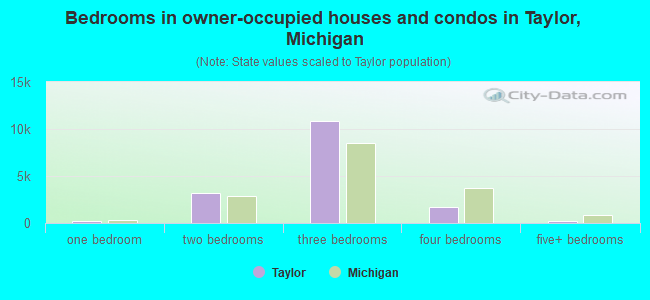
Bedrooms in owner-occupied houses - no bedrooms (%)
Bedrooms in owner-occupied houses - 1 bedroom (%)
Bedrooms in owner-occupied houses - 2 bedrooms (%)
Bedrooms in owner-occupied houses - 3 bedrooms (%)
Bedrooms in owner-occupied houses - 4 bedrooms (%)
Bedrooms in owner-occupied houses - 5+ bedrooms (%)
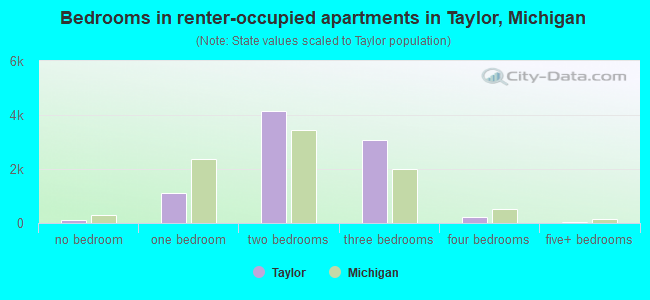
Bedrooms in renter-occupied houses - no bedrooms (%)
Bedrooms in renter-occupied houses - 1 bedroom (%)
Bedrooms in renter-occupied houses - 2 bedrooms (%)
Bedrooms in renter-occupied houses - 3 bedrooms (%)
Bedrooms in renter-occupied houses - 4 bedrooms (%)
Bedrooms in renter-occupied houses - 5+ bedrooms (%)
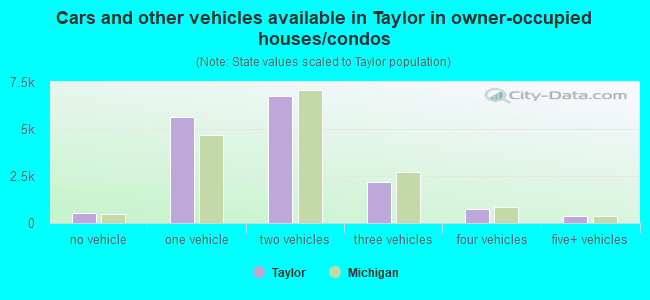
Vehicles available in owner-occupied houses - no vehicle available (%)
Vehicles available in owner-occupied houses - 1 vehicle available(%)
Vehicles available in owner-occupied houses - 2 Vehicles available (%)
Vehicles available in owner-occupied houses - 3 Vehicles available (%)
Vehicles available in owner-occupied houses - 4 Vehicles available (%)
Vehicles available in owner-occupied houses - 5+ Vehicles available (%)
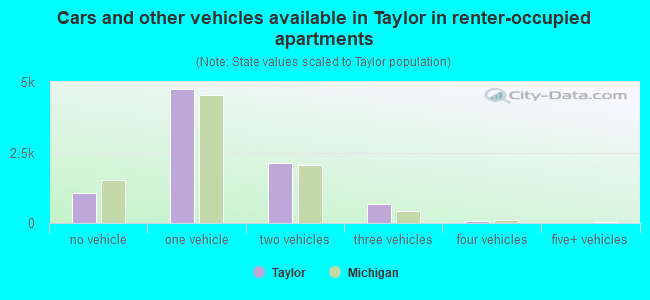
Vehicles available in renter-occupied houses - no vehicle available (%)
Vehicles available in renter-occupied houses - 1 vehicle available (%)
Vehicles available in renter-occupied houses - 2 Vehicles available (%)
Vehicles available in renter-occupied houses - 3 Vehicles available (%)
Vehicles available in renter-occupied houses - 4 Vehicles available (%)
Vehicles available in renter-occupied houses - 5+ Vehicles available (%)
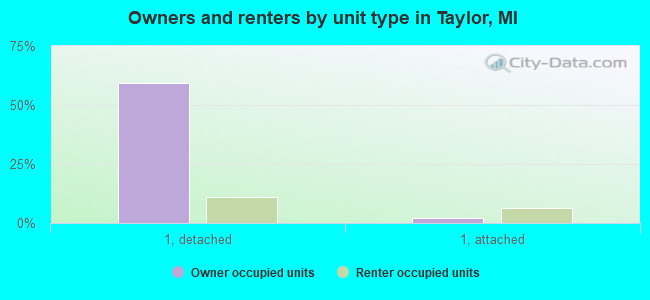
Housing units in structures - 1, detached (%)
Housing units in structures - 1, attached (%)
Housing units in structures - 2 (%)
Housing units in structures - 3 or 4 (%)
Housing units in structures - 5 to 9 (%)
Housing units in structures - 10 to 19 (%)
Housing units in structures - 20 to 49 (%)
Housing units in structures - 50 or more (%)
Housing units in structures - Mobile home (%)
Housing units in structures - Boat, RV, van, etc. (%)
Housing units in structures - Owners - 1, detached (%)
Housing units in structures - Owners - 1, attached (%)
Housing units in structures - Owners - 2 (%)
Housing units in structures - Owners - 3 or 4 (%)
Housing units in structures - Owners - 5 to 9 (%)
Housing units in structures - Owners - 10 to 19 (%)
Housing units in structures - Owners - 20 to 49 (%)
Housing units in structures - Owners - 50 or more (%)
Housing units in structures - Owners - Mobile home (%)
Housing units in structures - Owners - Boat, RV, van, etc. (%)
Housing units in structures - Renters - 1, detached (%)
Housing units in structures - Renters - 1, attached (%)
Housing units in structures - Renters - 2 (%)
Housing units in structures - Renters - 3 or 4 (%)
Housing units in structures - Renters - 5 to 9 (%)
Housing units in structures - Renters - 10 to 19 (%)
Housing units in structures - Renters - 20 to 49 (%)
Housing units in structures - Renters - 50 or more (%)
Housing units in structures - Renters - Mobile home (%)
Housing units in structures - Renters - Boat, RV, van, etc. (%)
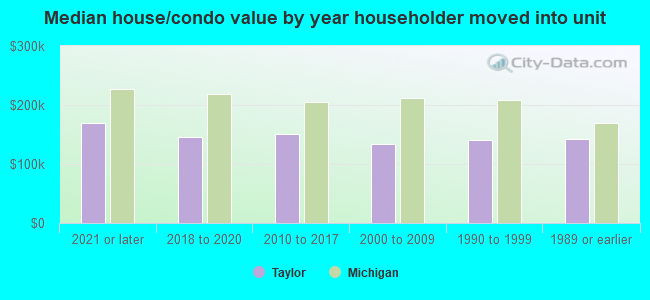
House/condo owner moved in on average (years ago)
Renter moved in on average (years ago)
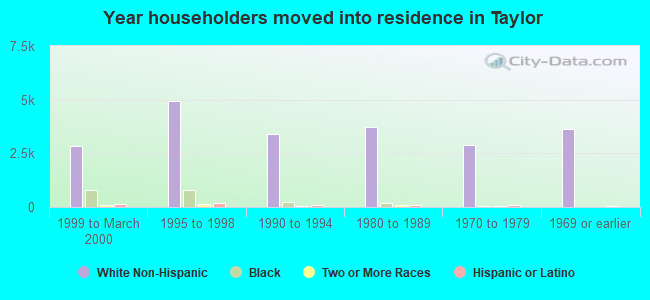
Year householder moved into unit - Moved in 1999 to March 2000 (%)
Year householder moved into unit - Moved in 1999 to March 2000 (%) - White
Year householder moved into unit - Moved in 1999 to March 2000 (%) - Black or African American
Year householder moved into unit - Moved in 1999 to March 2000 (%) - Asian
Year householder moved into unit - Moved in 1999 to March 2000 (%) - Hispanic or Latino
Year householder moved into unit - Moved in 1999 to March 2000 (%) - American Indian and Alaska Native
Year householder moved into unit - Moved in 1999 to March 2000 (%) - Multirace
Year householder moved into unit - Moved in 1999 to March 2000 (%) - Other Race
Year householder moved into unit - Moved in 1995 to 1998 (%)
Year householder moved into unit - Moved in 1995 to 1998 (%) - White
Year householder moved into unit - Moved in 1995 to 1998 (%) - Black or African American
Year householder moved into unit - Moved in 1995 to 1998 (%) - Asian
Year householder moved into unit - Moved in 1995 to 1998 (%) - Hispanic or Latino
Year householder moved into unit - Moved in 1995 to 1998 (%) - American Indian and Alaska Native
Year householder moved into unit - Moved in 1995 to 1998 (%) - Multirace
Year householder moved into unit - Moved in 1995 to 1998 (%) - Other Race
Year householder moved into unit - Moved in 1990 to 1994 (%)
Year householder moved into unit - Moved in 1990 to 1994 (%) - White
Year householder moved into unit - Moved in 1990 to 1994 (%) - Black or African American
Year householder moved into unit - Moved in 1990 to 1994 (%) - Asian
Year householder moved into unit - Moved in 1990 to 1994 (%) - Hispanic or Latino
Year householder moved into unit - Moved in 1990 to 1994 (%) - American Indian and Alaska Native
Year householder moved into unit - Moved in 1990 to 1994 (%) - Multirace
Year householder moved into unit - Moved in 1990 to 1994 (%) - Other Race
Year householder moved into unit - Moved in 1980 to 1989 (%)
Year householder moved into unit - Moved in 1980 to 1989 (%) - White
Year householder moved into unit - Moved in 1980 to 1989 (%) - Black or African American
Year householder moved into unit - Moved in 1980 to 1989 (%) - Asian
Year householder moved into unit - Moved in 1980 to 1989 (%) - Hispanic or Latino
Year householder moved into unit - Moved in 1980 to 1989 (%) - American Indian and Alaska Native
Year householder moved into unit - Moved in 1980 to 1989 (%) - Multirace
Year householder moved into unit - Moved in 1980 to 1989 (%) - Other Race
Year householder moved into unit - Moved in 1970 to 1979 (%)
Year householder moved into unit - Moved in 1970 to 1979 (%) - White
Year householder moved into unit - Moved in 1970 to 1979 (%) - Black or African American
Year householder moved into unit - Moved in 1970 to 1979 (%) - Asian
Year householder moved into unit - Moved in 1970 to 1979 (%) - Hispanic or Latino
Year householder moved into unit - Moved in 1970 to 1979 (%) - American Indian and Alaska Native
Year householder moved into unit - Moved in 1970 to 1979 (%) - Multirace
Year householder moved into unit - Moved in 1970 to 1979 (%) - Other Race
Year householder moved into unit - Moved in 1969 or earlier (%)
Year householder moved into unit - Moved in 1969 or earlier (%) - White
Year householder moved into unit - Moved in 1969 or earlier (%) - Black or African American
Year householder moved into unit - Moved in 1969 or earlier (%) - Asian
Year householder moved into unit - Moved in 1969 or earlier (%) - Hispanic or Latino
Year householder moved into unit - Moved in 1969 or earlier (%) - American Indian and Alaska Native
Year householder moved into unit - Moved in 1969 or earlier (%) - Multirace
Year householder moved into unit - Moved in 1969 or earlier (%) - Other Race
Housing units lacking complete plumbing facilities (%)
Housing units lacking complete kitchen facilities (%)
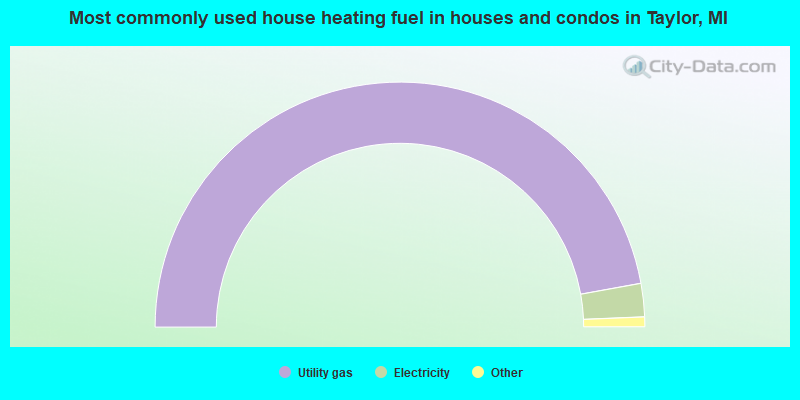
House heating fuel used in houses and condos - Utility gas (%)
House heating fuel used in houses and condos - Bottled, tank, or LP gas (%)
House heating fuel used in houses and condos - Electricity (%)
House heating fuel used in houses and condos - Fuel oil, kerosene, etc. (%)
House heating fuel used in houses and condos - Coal or coke (%)
House heating fuel used in houses and condos - Wood (%)
House heating fuel used in houses and condos - Solar energy (%)
House heating fuel used in houses and condos - Other fuel (%)
House heating fuel used in houses and condos - No fuel used (%)
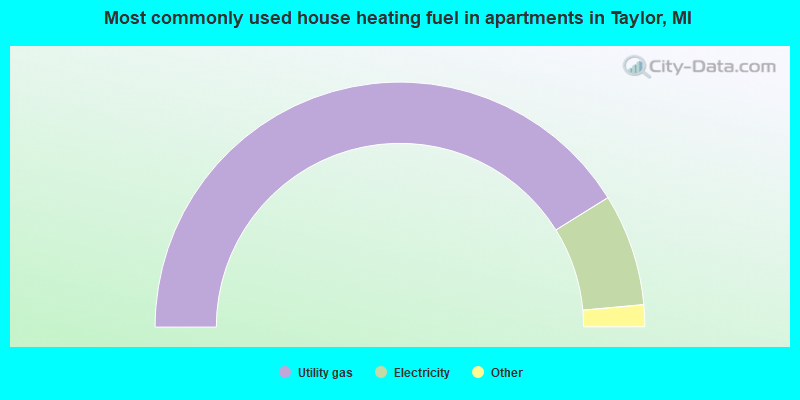
House heating fuel used in apartments - Utility gas (%)
House heating fuel used in apartments - Bottled, tank, or LP gas (%)
House heating fuel used in apartments - Electricity (%)
House heating fuel used in apartments - Fuel oil, kerosene, etc. (%)
House heating fuel used in apartments - Coal or coke (%)
House heating fuel used in apartments - Wood (%)
House heating fuel used in apartments - Solar energy (%)
House heating fuel used in apartments - Other fuel (%)
House heating fuel used in apartments - No fuel used (%)
Latest news about housing in Taylor, MI collected exclusively by city-data.com from local newspapers, TV, and radio stations
Median year house/condo built: 1959Median year apartment built: 1970Household type by relationship:
Households: 62,068
Male householders: 11,604 (3,439 living alone ), Female householders: 12,868 (3,676 living alone )9,227 spouses (9,141 opposite-sex spouses ), 2,107 unmarried partners , (2,031 opposite-sex unmarried partners ), 19,032 children (17,679 natural , 332 adopted , 1,020 stepchildren ), 1,564 grandchildren , 1,047 brothers or sisters , 938 parents , 61 foster children , 1,161 other relatives , 1,823 non-relatives In group quarters: 630
Size of family households: 7,378 2-persons , 3,591 3-persons , 2,801 4-persons , 1,552 5-persons , 324 6-persons , 126 7-or-more-persons .
Size of nonfamily households: 7,373 1-person , 1,640 2-persons , 94 3-persons , 3 4-persons .
6,129 married couples with children. single-parent households (1,476 men , 4,093 women ).
90.8% of residents of Taylor speak English at home. of residents speak Spanish at home (70% speak English very well , 20% speak English well , 6% speak English not well , 4% don't speak English at all ).of residents speak other Indo-European language at home (65% speak English very well , 26% speak English well , 7% speak English not well , 2% don't speak English at all ).of residents speak Asian or Pacific Island language at home (66% speak English very well , 26% speak English well , 7% speak English not well , 1% don't speak English at all ).of residents speak other language at home (60% speak English very well , 33% speak English well , 6% speak English not well , 1% don't speak English at all ).
Foreign born population: 3,654 (5.9%)of them are naturalized citizens )
Median number of rooms in houses and condos:
Median number of rooms in apartments
Owner-occupied Renter-occupied
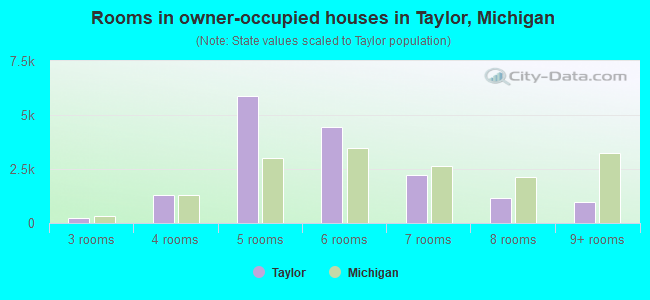
Rooms in owner-occupied houses in Taylor, Michigan
15 1 room 0 2 rooms 248 3 rooms 1,292 4 rooms 5,878 5 rooms 4,460 6 rooms 2,200 7 rooms 1,147 8 rooms 968 9+ rooms
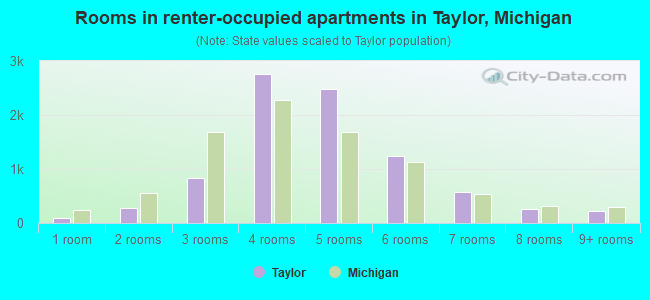
Rooms in renter-occupied apartments in Taylor, Michigan
85 1 room 280 2 rooms 830 3 rooms 2,752 4 rooms 2,490 5 rooms 1,237 6 rooms 565 7 rooms 256 8 rooms 218 9+ rooms
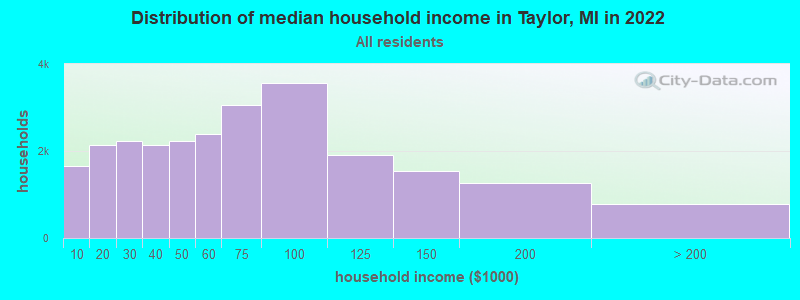
Taylor, MI household income distribution 1,650 Less than $10,0002,133 $10,000 to $19,9992,221 $20,000 to $29,9992,129 $30,000 to $39,9992,237 $40,000 to $49,9992,381 $50,000 to $59,9993,068 $60,000 to $74,9993,573 $75,000 to $99,9991,918 $100,000 to $124,9991,547 $125,000 to $149,9991,261 $150,000 to $199,999791 $200,000 or more
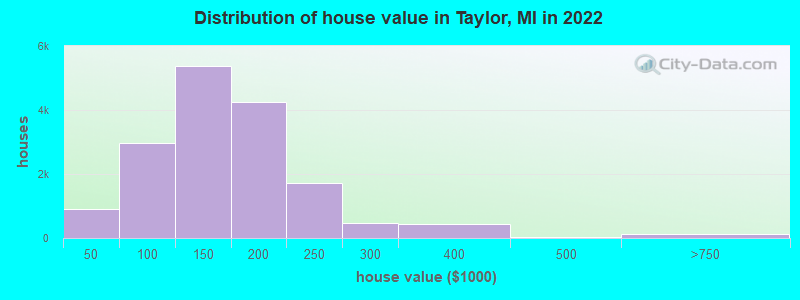
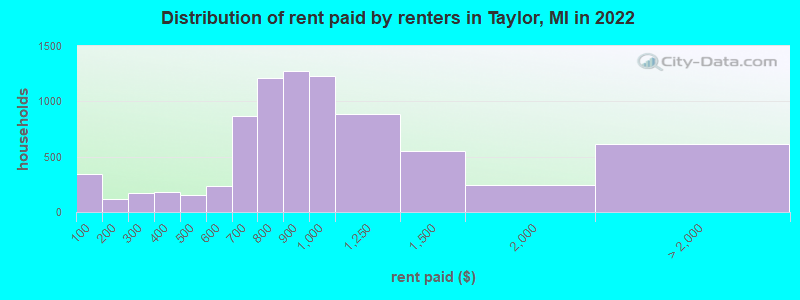
Home value of owner - occupied houses in 2022 in Taylor, MI 247 Less than $10,000171 $10,000 to $14,999106 $15,000 to $19,99952 $20,000 to $24,9995 $25,000 to $29,999146 $30,000 to $34,99925 $35,000 to $39,999135 $40,000 to $49,999469 $50,000 to $59,999411 $60,000 to $69,999507 $70,000 to $79,999675 $80,000 to $89,999771 $90,000 to $99,9993,243 $100,000 to $124,9992,131 $125,000 to $149,9992,826 $150,000 to $174,9991,410 $175,000 to $199,9991,726 $200,000 to $249,999477 $250,000 to $299,999429 $300,000 to $399,99930 $400,000 to $499,99947 $500,000 to $749,99933 $750,000 to $999,99920 $1,000,000 to $1,499,99921 $1,500,000 to $1,999,99912 $2,000,000 or moreRent paid by renters in 2022 in Taylor, MI 339 Less than $10012 $100 to $149103 $150 to $19992 $200 to $24983 $250 to $299144 $300 to $34938 $350 to $39956 $400 to $44998 $450 to $499117 $500 to $549115 $550 to $599425 $600 to $649445 $650 to $699511 $700 to $749703 $750 to $7991,278 $800 to $8991,227 $900 to $999886 $1,000 to $1,249554 $1,250 to $1,499245 $1,500 to $1,9994 $2,500 to $2,999608 No cash rent
Percentage of workers working in this county: 85.7%Number of people working at home: 3,030 (10.7% of all workers )
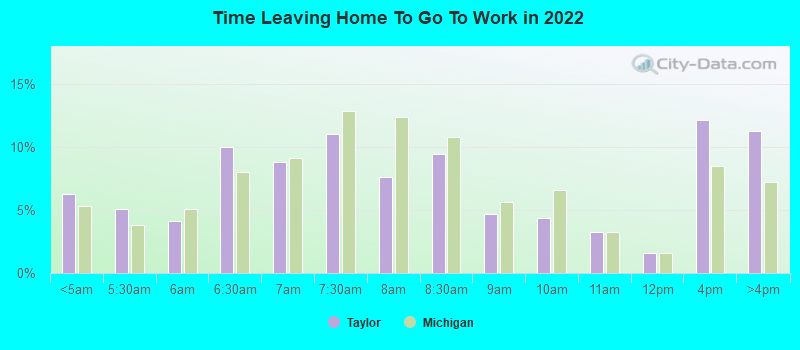
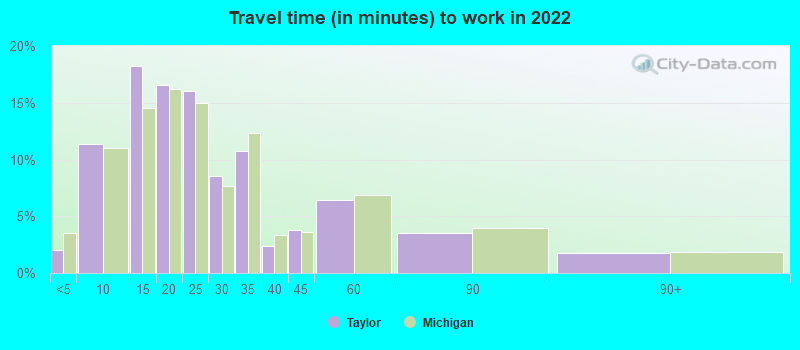
Travel time to work (commute)
Less than 5 minutes: 6805 to 9 minutes: 3,11110 to 14 minutes: 4,61015 to 19 minutes: 4,61120 to 24 minutes: 3,23025 to 29 minutes: 1,53630 to 34 minutes: 3,53435 to 39 minutes: 1,01640 to 44 minutes: 56645 to 59 minutes: 1,16360 to 89 minutes: 75990 or more minutes: 339
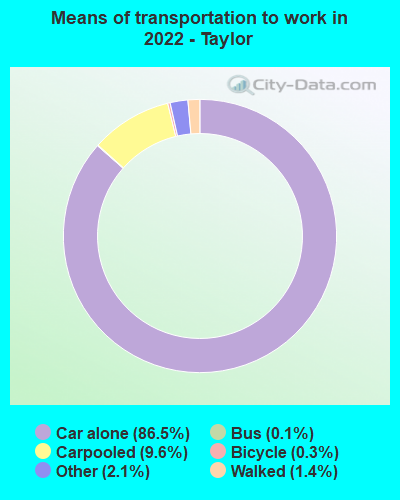
Means of transportation to work:
Drove a car alone: 21,176 (76.5%)Carpooled: 2,330 (8.4%)Bus : 22 (0.1%)Taxi: 551 (2.0%)Bicycle: 73 (0.3%)Walked: 378 (1.4%)Worked at home: 3,030 (10.9%)
Unemployment by race in 2022
Unemployment rate for White non-Hispanic residents 5.4% Males5.1% FemalesUnemployment rate for Black residents 8.0% Males6.9% FemalesUnemployment rate for American Indian and Alaska Native residents 12.1% MalesUnemployment rate for two or more race residents 8.4% Males5.0% FemalesUnemployment rate for Hispanic or Latino residents 3.7% Males2.2% Females
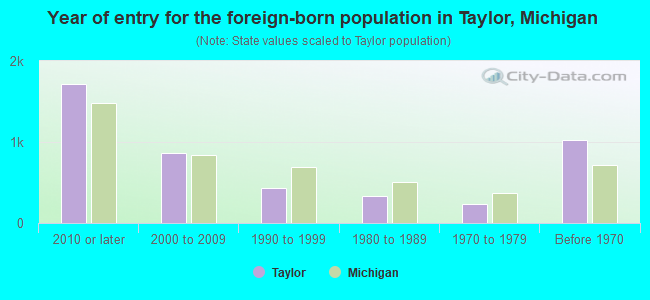
Year of entry for the foreign-born population in Taylor, Michigan
1,717 2010 or later 863 2000 to 2009 434 1990 to 1999 339 1980 to 1989 234 1970 to 1979 1,029 Before 1970
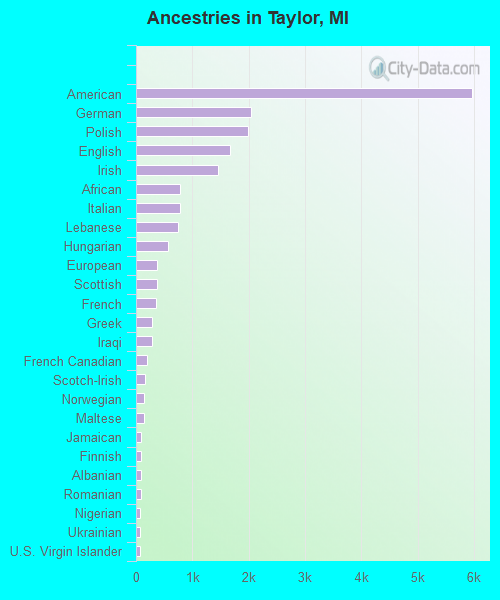
First ancestries reported:
American: 5,970 (18.0%)
German: 2,047 (6.2%)
Polish: 1,995 (6.0%)
English: 1,671 (5.0%)
Irish: 1,451 (4.4%)
African: 784 (2.4%)
Italian: 773 (2.3%)
Lebanese: 742 (2.2%)
Hungarian: 562 (1.7%)
European: 379 (1.1%)
Scottish: 378 (1.1%)
French: 350 (1.1%)
Greek: 289 (0.9%)
Iraqi: 278 (0.8%)
French Canadian: 190 (0.6%)
Scotch-Irish: 163 (0.5%)
Norwegian: 147 (0.4%)
Maltese: 138 (0.4%)
Jamaican: 94 (0.3%)
Finnish: 90 (0.3%)
Albanian: 86 (0.3%)
Romanian: 82 (0.2%)
Nigerian: 79 (0.2%)
Ukrainian: 77 (0.2%)
U.S. Virgin Islander: 72 (0.2%)
Canadian: 63 (0.2%)
Eastern European: 55 (0.2%)
Syrian: 51 (0.2%)
Dutch: 39 (0.1%)
Egyptian: 31 (0.09%)
Danish: 26 (0.08%)
West Indian: 22 (0.07%)
British: 21 (0.06%)
Yugoslavian: 20 (0.06%)
Arab: 19 (0.06%)
Slovak: 19 (0.06%)
Luxembourger: 16 (0.05%)
Welsh: 15 (0.05%)
Russian: 13 (0.04%)
Austrian: 12 (0.04%)
Northern European: 9 (0.03%)
Macedonian: 9 (0.03%)
Palestinian: 8 (0.02%)
Slavic: 7 (0.02%)
Croatian: 7 (0.02%)
Scandinavian: 6 (0.02%)
Czechoslovakian: 6 (0.02%)
Zimbabwean: 3 (0.01%)
Belgian: 2 (0.01%)
Most common places of birth for foreign-born residents (%): Lebanon Taylor:
17.3% (618)Michigan:
3.7% (25,634)
Mexico Taylor:
14.4% (514)Michigan:
10.9% (75,965)
Iraq Taylor:
11.9% (423)Michigan:
8.1% (55,954)
Honduras Taylor:
8.3% (296)Michigan:
0.5% (3,798)
Pakistan Taylor:
7.0% (248)Michigan:
1.5% (10,596)
Canada Taylor:
5.6% (199)Michigan:
5.0% (35,052)
India Taylor:
4.6% (165)Michigan:
11.1% (77,240)
Albania Taylor:
3.5% (123)Michigan:
1.9% (12,910)
Romania Taylor:
3.2% (114)Michigan:
1.2% (8,563)
Colombia Taylor:
3.2% (113)Michigan:
0.6% (3,969)
Philippines Taylor:
2.8% (101)Michigan:
2.8% (19,112)
Nigeria Taylor:
1.9% (66)Michigan:
0.9% (5,964)
Togo Taylor:
1.7% (61)Michigan:
0.0% (115)
Germany Taylor:
1.6% (57)Michigan:
2.3% (16,126)
Place of birth for U.S.-born residents:
This state: 50,612Other state: 7,426Northeast: 657Midwest: 2,051South: 3,423West: 1,340 90.4% of Taylor residents lived in the same house 1 years ago.
Out of people who lived in different houses, 42.6% lived in this county.
Out of people who lived in different counties, 51.2% lived in Michigan.
Taylor:
90.4%State average:
88.4%
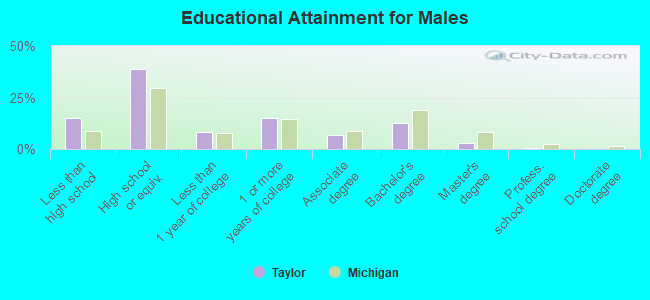
Education attainment for males 25 years and older:
No schooling: 363Nursery to 4th grade: 275th and 6th grade: 827th and 8th grade: 1539th grade: 37010th grade: 84011th grade: 56812th grade, no diploma: 810High school graduate (or equivalency): 8,288Less than 1 year of college: 1,799Some college more than 1 year, no degree: 3,237Associate degree: 1,399Bachelor's degree: 2,640Master's degree: 655Professional school degree: 66Doctorate degree: 22
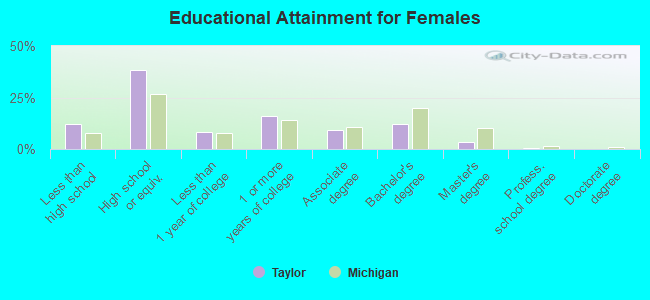
Education attainment for females 25 years and older:
No schooling: 277Nursery to 4th grade: 405th and 6th grade: 577th and 8th grade: 2089th grade: 29010th grade: 63011th grade: 58412th grade, no diploma: 456High school graduate (or equivalency): 8,110Less than 1 year of college: 1,782Some college more than 1 year, no degree: 3,371Associate degree: 1,988Bachelor's degree: 2,583Master's degree: 758Professional school degree: 66Doctorate degree: 2
Housing units in structures:
One, detached: 19,257One, attached: 1,613Two: 2503 or 4: 7315 to 9: 1,79910 to 19: 1,45620 to 49: 19850 or more: 525Mobile homes: 561Boats, RVs, vans, etc.: 34Median worth of mobile homes: $18,048
Housing units lacking complete plumbing facilities in 2022: 0.8%Housing units lacking complete kitchen facilities in 2022: 1.3%House/condo owner moved in on average 15 years ago
Renter moved in on average 3 years ago
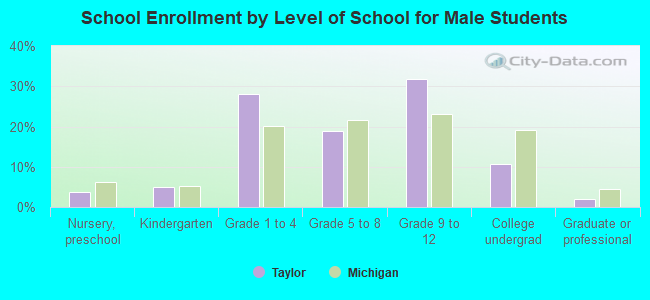
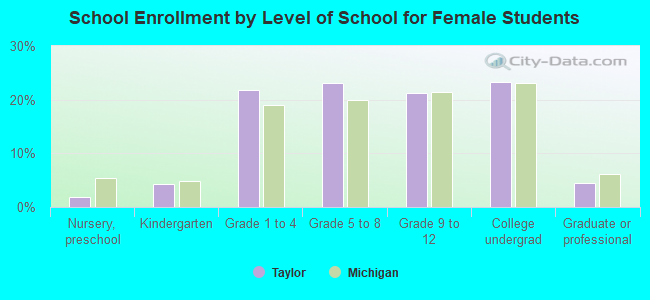
Private vs. public school enrollment:
Students in private schools in grades 1 to 8 (elementary and middle school): 644 Students in private schools in grades 9 to 12 (high school): 161 Students in private undergraduate colleges: 132