Median price asked for vacant for-sale houses and condos in 2022 in this county: $378,161.
Median contract rent in 2022: over $2,000 (lower quartile is over $2,000, upper quartile is over $2,000)
Median rent asked for vacant for-rent units in 2022: $3,579
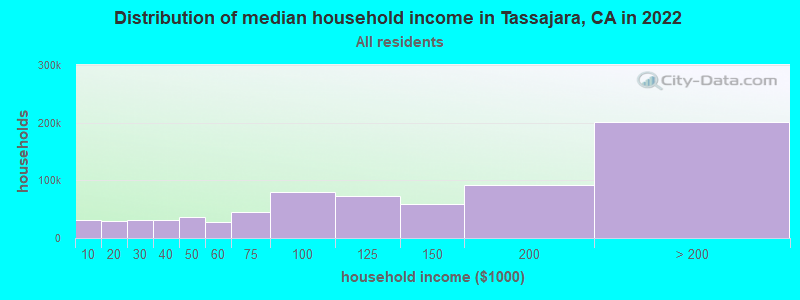
Median gross rent in Tassajara, CA in 2022: over $2,000
Housing units in Tassajara with a mortgage: 6,981 (1,227 second mortgage, 774 home equity loan, 31 both second mortgage and home equity loan) Houses without a mortgage: 451
In family households: 895,275 (185,206 male householders, 80,074 female householders)
199,021 spouses, 320,947 children (302,778 natural, 6,543 adopted, 11,626 stepchildren), 20,722 grandchildren, 14,424 brothers or sisters, 13,961 parents, foster children, 21,146 other relatives, 29,185 non-relatives
In nonfamily households: 143,436 (48,395 male householders (34,478 living alone)), 61,689 female householders (50,577 living alone)), 33,352 nonrelatives
In group quarters: 10,314 (5,346 institutionalized population)
175,577 married couples with children.
49,858 single-parent households (12,019 men, 37,839 women).
80.2% of residents of Tassajara speak English at home.
4.6% of residents speak Spanish at home (81% speak English very well, 9% speak English well, 9% speak English not well, 1% don't speak English at all).
5.9% of residents speak other Indo-European language at home (86% speak English very well, 8% speak English well, 5% speak English not well).
8.9% of residents speak Asian or Pacific Island language at home (66% speak English very well, 24% speak English well, 9% speak English not well, 1% don't speak English at all).
0.4% of residents speak other language at home (60% speak English very well, 40% speak English well).
Foreign born population: 6,697 (20.6%)
(84.6% of them are naturalized citizens)
Percentage of workers working in this county: 67.7% Number of people working at home: 3,378 (20.7% of all workers)
Travel time to work (commute)
Less than 5 minutes: 181
5 to 9 minutes: 588
10 to 14 minutes: 1,185
15 to 19 minutes: 1,212
20 to 24 minutes: 1,132
25 to 29 minutes: 477
30 to 34 minutes: 1,488
35 to 39 minutes: 368
40 to 44 minutes: 446
45 to 59 minutes: 1,637
60 to 89 minutes: 2,214
90 or more minutes: 1,268
Means of transportation to work:
Drove a car alone: 9,657 (74.5%)
Carpooled: 1,532 (11.8%)
Bus or trolley bus: 46 (0.4%)
Subway or elevated: 650 (5.0%)
Railroad: 40 (0.3%)
Motorcycle: 23 (0.2%)
Bicycle: 8 (0.1%)
Walked: 118 (0.9%)
Other means: 122 (0.9%)
Worked at home: 770 (5.9%)
Year of entry for the foreign-born population in Tassajara, California
5041995 to March 2000
3201990 to 1994
4951985 to 1989
6431980 to 1984
5711975 to 1979
4151970 to 1974
3131965 to 1969
613Before 1965
Most common places of birth for foreign-born residents (%):
Philippines
Tassajara:
13.0% (505)
California:
7.5% (664,935)
India
Tassajara:
10.0% (386)
California:
2.2% (198,201)
China, excluding Hong Kong and Taiwan
Tassajara:
9.0% (350)
California:
3.7% (327,611)
United Kingdom
Tassajara:
8.3% (321)
California:
1.5% (133,090)
Taiwan
Tassajara:
6.4% (246)
California:
1.7% (151,775)
Hong Kong
Tassajara:
5.4% (209)
California:
1.0% (91,101)
Vietnam
Tassajara:
4.2% (161)
California:
4.7% (418,249)
Iran
Tassajara:
3.8% (148)
California:
1.8% (158,613)
Mexico
Tassajara:
3.7% (143)
California:
44.3% (3,928,701)
Canada
Tassajara:
3.4% (132)
California:
1.6% (141,181)
Korea
Tassajara:
2.8% (109)
California:
3.0% (268,452)
Germany
Tassajara:
2.7% (105)
California:
1.1% (98,160)
Russia
Tassajara:
2.0% (79)
California:
0.6% (54,660)
Poland
Tassajara:
2.0% (77)
California:
0.3% (24,638)
Nicaragua
Tassajara:
1.8% (68)
California:
0.7% (64,411)
Japan
Tassajara:
1.7% (64)
California:
1.3% (112,212)
El Salvador
Tassajara:
1.7% (64)
California:
4.1% (359,673)
Place of birth for U.S.-born residents:
This state: 14,905
Other state: 7,763
Northeast: 2,095
Midwest: 2,447
South: 1,882
West: 1,339
44% of Tassajara residents lived in the same house 5 years ago. Out of people who lived in different houses, 41% lived in this county. Out of people who lived in different counties, 74% lived in California.
Education attainment for males 25 years and older:
No schooling: 7
Nursery to 4th grade: 6
5th and 6th grade: 7
7th and 8th grade: 35
9th grade: 52
10th grade: 49
11th grade: 49
12th grade, no diploma: 100
High school graduate (or equivalency): 1,013
Less than 1 year of college: 378
Some college more than 1 year, no degree: 1,319
Associate degree: 671
Bachelor's degree: 2,841
Master's degree: 1,165
Professional school degree: 316
Doctorate degree: 251
Education attainment for females 25 years and older:
No schooling: 7
Nursery to 4th grade: 15
5th and 6th grade: 59
7th and 8th grade: 81
9th grade: 83
10th grade: 42
11th grade: 29
12th grade, no diploma: 157
High school graduate (or equivalency): 1,436
Less than 1 year of college: 658
Some college more than 1 year, no degree: 1,606
Associate degree: 898
Bachelor's degree: 2,699
Master's degree: 770
Professional school degree: 181
Doctorate degree: 85
Housing units in structures:
One, detached: 7,619
One, attached: 792
Two: 10
3 or 4: 9
10 to 19: 9
50 or more: 38
Mobile homes: 141
Boats, RVs, vans, etc.: 9
Median worth of mobile homes: $89,536
Housing units lacking complete plumbing facilities: 0.2%
Housing units lacking complete kitchen facilities: 0.5%