Tarpon Springs, FL (Florida) Houses and Residents
Estimated median house or condo value in 2022: $369,640 (it was $92,900 in 2000 )
Tarpon Springs:
$369,640Florida:
$354,100
Lower value quartile - upper value quartile: $232,676 - $501,354Mean price in 2022: Detached houses: $442,119 Here:
$442,119State:
$500,941
Townhouses or other attached units: $279,524 Here:
$279,524State:
$370,869
In 3-to-4-unit structures: $329,003 Here:
$329,003State:
$309,944
In 5-or-more-unit structures: $256,054 Here:
$256,054State:
$447,145
Mobile homes: $72,740 Here:
$72,740State:
$113,202
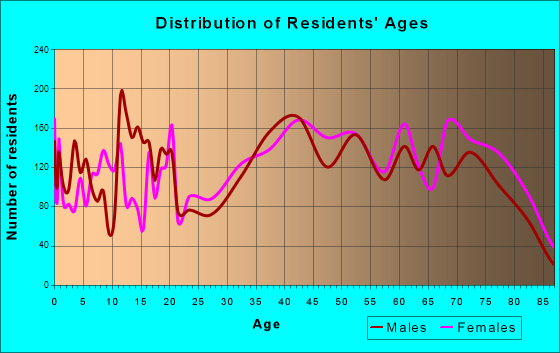
Total population: 24,239 (Urban population: 21,066, Rural population: 0)
Houses: 13,139 (11,378 occupied: 9,075 owner occupied, 2,400 renter occupied )
% of renters here:
21%State:
33%
Housing density: 1,437 houses/condos per square mile
Median price asked for vacant for-sale houses and condos in 2022: $231,687.
Median contract rent in 2022: $985 (lower quartile is $708, upper quartile is $1,267)
Median rent asked for vacant for-rent units in 2022: $1,453
Median gross rent in Tarpon Springs, FL in 2022: $1,128
Housing units in Tarpon Springs with a mortgage: 5,158 (510 second mortgage, 148 home equity loan, 355 both second mortgage and home equity loan )Houses without a mortgage: 261
Median household income for houses/condos with a mortgage: $93,852
Median household income for apartments without a mortgage: $56,365
Median monthly housing costs: $1,299
Data:
Median house or condo value ($)
Median house or condo value ($ change since 2000)
Median house or condo value ($) - White
Median house or condo value ($) - Black or African American
Median house or condo value ($) - Asian
Median house or condo value ($) - Hispanic or Latino
Median house or condo value ($) - American Indian and Alaska Native
Median house or condo value ($) - Multirace
Median house or condo value ($) - Other Race
Median price asked for mobile homes ($)
Household density (households per square mile)
Mean house or condo value by units in structure - 1, detached ($)
Mean house or condo value by units in structure - 1, attached ($)
Mean house or condo value by units in structure - 2 ($)
Mean house or condo value by units in structure by units in structure - 3 or 4 ($)
Mean house or condo value by units in structure - 5 or more ($)
Mean house or condo value by units in structure - Boat, RV, van, etc. ($)
Mean house or condo value by units in structure - Mobile home ($)
Median contract rent ($)
Median contract rent - Lower quartile ($)
Median contract rent - Upper quartile ($)
Median gross rent ($)
Urban houses (%)
Rural houses (%)
Houses occupied (%)
Houses occupied (% change since 2000)
Houses owner occupied (%)
Houses owner occupied (% change since 2000)
Houses renter occupied (%)
Houses renter occupied (% change since 2000)
Vacant housing units - For rent (%)
Vacant housing units - For rent (% change since 2000)
Vacant housing units - For sale only (%)
Vacant housing units - For sale only (% change since 2000)
Vacant housing units - Rented or sold, not occupied (%)
Vacant housing units - Rented or sold, not occupied (% change since 2000)
Vacant housing units - For seasonal, recreational, or occasional use (%)
Vacant housing units - For seasonal, recreational, or occasional use (% change since 2000)
Vacant housing units - For migrant workers (%)
Vacant housing units - For migrant workers (% change since 2000)
Vacant housing units - Other vacant (%)
Vacant housing units - Other vacant (% change since 2000)
Median monthly housing costs ($)
Median household income for houses/condos with a mortgage ($)
Median household income for houses/condos without a mortgage ($)
Median household income ($)
Median household income ($) - White
Median household income ($) - Black or African American
Median household income ($) - Asian
Median household income ($) - Hispanic or Latino
Median household income ($) - American Indian and Alaska Native
Median household income ($) - Multirace
Median household income ($) - Other Race
Mortgage status - with mortgage (%)
Mortgage status - with second mortgage (%)
Mortgage status - with home equity loan (%)
Mortgage status - with both second mortgage and home equity loan (%)
Mortgage status - without a mortgage (%)
Median year house/condo built
Median year apartment built
Household type by relationship - Male householder living alone (%)
Household type by relationship - Male householder not living alone (%)
Household type by relationship - Female householder living alone (%)
Household type by relationship - Female householder not living alone (%)
Household type by relationship - Opposite-Sex spouse (%)
Household type by relationship - Same-Sex spouse (%)
Household type by relationship - Opposite-Sex unmarried partner (%)
Household type by relationship - Same-Sex unmarried partner (%)
Household type by relationship - In group quarters (%)
Size of family households - 2-person household (%)
Size of family households - 3-person household (%)
Size of family households - 4-person household (%)
Size of family households - 5-person household (%)
Size of family households - 6-person household (%)
Size of family households - 7-or-more-person household (%)
Size of nonfamily households - 1-person household (%)
Size of nonfamily households - 2-person household (%)
Size of nonfamily households - 3-person household (%)
Size of nonfamily households - 4-person household (%)
Size of nonfamily households - 5-person household (%)
Size of nonfamily households - 6-person household (%)
Size of nonfamily households - 7-or-moreperson household (%)
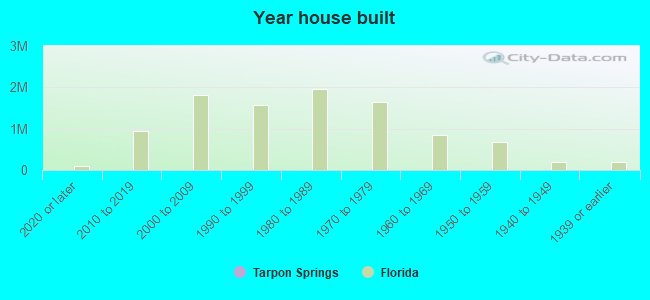
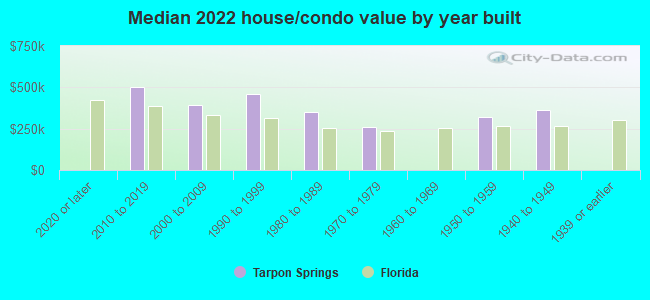
Year house built - Built 2010 or later (%)
Year house built - Built 2000 to 2009 (%)
Year house built - Built 1990 to 1999 (%)
Year house built - Built 1980 to 1989 (%)
Year house built - Built 1970 to 1979 (%)
Year house built - Built 1960 to 1969 (%)
Year house built - Built 1950 to 1959 (%)
Year house built - Built 1940 to 1949 (%)
Year house built - Built 1939 or earlier (%)
Median number of rooms in houses and condos
Median number of rooms in apartments
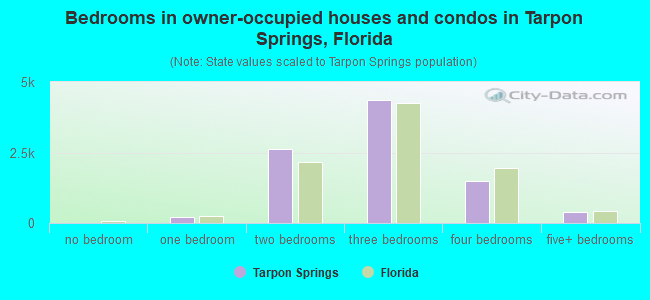
Median number of bedrooms in owner occupied houses
Mean number of bedrooms in owner occupied houses
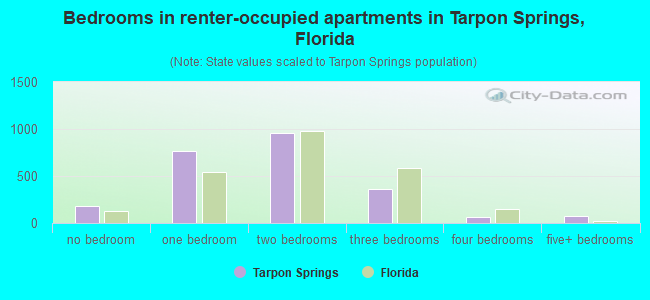
Median number of bedrooms in renter occupied houses
Mean number of bedrooms in renter occupied houses
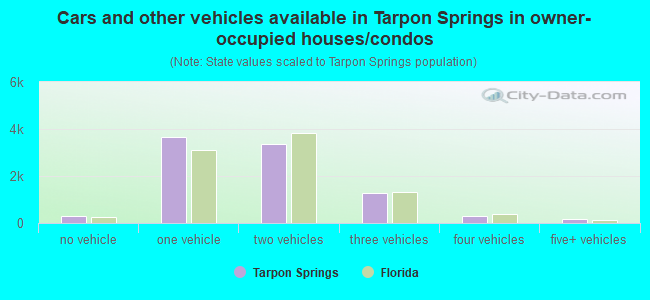
Median number of vehichles in owner occupied houses
Mean number of vehichles in owner occupied houses
Median number of vehichles in renter occupied houses
Mean number of vehichles in renter occupied houses
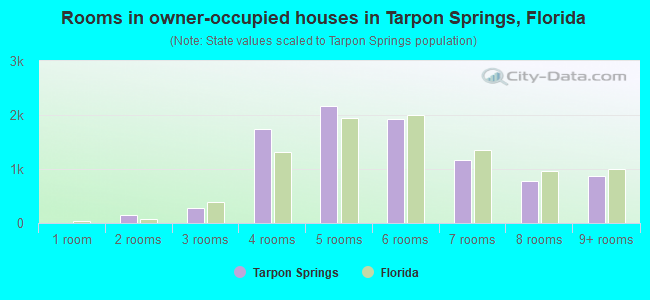
Rooms in owner-occupied houses - 1 room (%)
Rooms in owner-occupied houses - 2 rooms (%)
Rooms in owner-occupied houses - 3 rooms (%)
Rooms in owner-occupied houses - 4 rooms (%)
Rooms in owner-occupied houses - 5 rooms (%)
Rooms in owner-occupied houses - 6 rooms (%)
Rooms in owner-occupied houses - 7 rooms (%)
Rooms in owner-occupied houses - 8 rooms (%)
Rooms in owner-occupied houses - 9+ rooms (%)
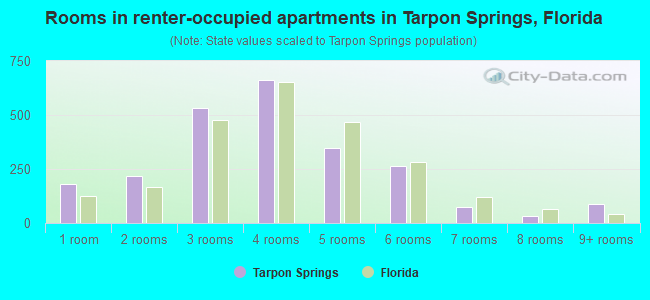
Rooms in renter-occupied houses - 1 room (%)
Rooms in renter-occupied houses - 2 rooms (%)
Rooms in renter-occupied houses - 3 rooms (%)
Rooms in renter-occupied houses - 4 rooms (%)
Rooms in renter-occupied houses - 5 rooms (%)
Rooms in renter-occupied houses - 6 rooms (%)
Rooms in renter-occupied houses - 7 rooms (%)
Rooms in renter-occupied houses - 8 rooms (%)
Rooms in renter-occupied houses - 9+ rooms (%)
Bedrooms in owner-occupied houses - no bedrooms (%)
Bedrooms in owner-occupied houses - 1 bedroom (%)
Bedrooms in owner-occupied houses - 2 bedrooms (%)
Bedrooms in owner-occupied houses - 3 bedrooms (%)
Bedrooms in owner-occupied houses - 4 bedrooms (%)
Bedrooms in owner-occupied houses - 5+ bedrooms (%)
Bedrooms in renter-occupied houses - no bedrooms (%)
Bedrooms in renter-occupied houses - 1 bedroom (%)
Bedrooms in renter-occupied houses - 2 bedrooms (%)
Bedrooms in renter-occupied houses - 3 bedrooms (%)
Bedrooms in renter-occupied houses - 4 bedrooms (%)
Bedrooms in renter-occupied houses - 5+ bedrooms (%)
Vehicles available in owner-occupied houses - no vehicle available (%)
Vehicles available in owner-occupied houses - 1 vehicle available(%)
Vehicles available in owner-occupied houses - 2 Vehicles available (%)
Vehicles available in owner-occupied houses - 3 Vehicles available (%)
Vehicles available in owner-occupied houses - 4 Vehicles available (%)
Vehicles available in owner-occupied houses - 5+ Vehicles available (%)
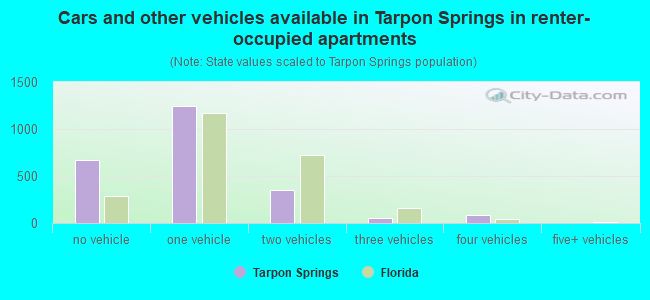
Vehicles available in renter-occupied houses - no vehicle available (%)
Vehicles available in renter-occupied houses - 1 vehicle available (%)
Vehicles available in renter-occupied houses - 2 Vehicles available (%)
Vehicles available in renter-occupied houses - 3 Vehicles available (%)
Vehicles available in renter-occupied houses - 4 Vehicles available (%)
Vehicles available in renter-occupied houses - 5+ Vehicles available (%)
Housing units in structures - 1, detached (%)
Housing units in structures - 1, attached (%)
Housing units in structures - 2 (%)
Housing units in structures - 3 or 4 (%)
Housing units in structures - 5 to 9 (%)
Housing units in structures - 10 to 19 (%)
Housing units in structures - 20 to 49 (%)
Housing units in structures - 50 or more (%)
Housing units in structures - Mobile home (%)
Housing units in structures - Boat, RV, van, etc. (%)
Housing units in structures - Owners - 1, detached (%)
Housing units in structures - Owners - 1, attached (%)
Housing units in structures - Owners - 2 (%)
Housing units in structures - Owners - 3 or 4 (%)
Housing units in structures - Owners - 5 to 9 (%)
Housing units in structures - Owners - 10 to 19 (%)
Housing units in structures - Owners - 20 to 49 (%)
Housing units in structures - Owners - 50 or more (%)
Housing units in structures - Owners - Mobile home (%)
Housing units in structures - Owners - Boat, RV, van, etc. (%)
Housing units in structures - Renters - 1, detached (%)
Housing units in structures - Renters - 1, attached (%)
Housing units in structures - Renters - 2 (%)
Housing units in structures - Renters - 3 or 4 (%)
Housing units in structures - Renters - 5 to 9 (%)
Housing units in structures - Renters - 10 to 19 (%)
Housing units in structures - Renters - 20 to 49 (%)
Housing units in structures - Renters - 50 or more (%)
Housing units in structures - Renters - Mobile home (%)
Housing units in structures - Renters - Boat, RV, van, etc. (%)
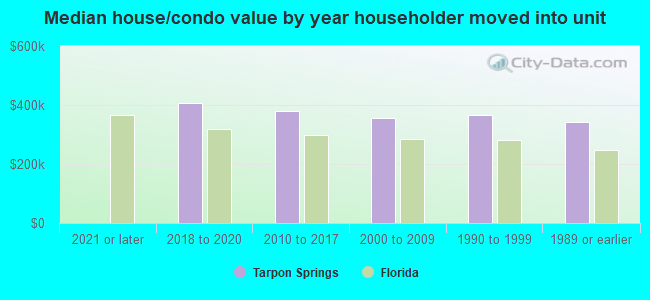
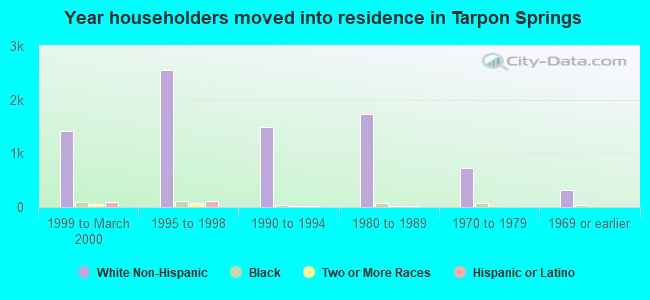
House/condo owner moved in on average (years ago)
Renter moved in on average (years ago)
Year householder moved into unit - Moved in 1999 to March 2000 (%)
Year householder moved into unit - Moved in 1999 to March 2000 (%) - White
Year householder moved into unit - Moved in 1999 to March 2000 (%) - Black or African American
Year householder moved into unit - Moved in 1999 to March 2000 (%) - Asian
Year householder moved into unit - Moved in 1999 to March 2000 (%) - Hispanic or Latino
Year householder moved into unit - Moved in 1999 to March 2000 (%) - American Indian and Alaska Native
Year householder moved into unit - Moved in 1999 to March 2000 (%) - Multirace
Year householder moved into unit - Moved in 1999 to March 2000 (%) - Other Race
Year householder moved into unit - Moved in 1995 to 1998 (%)
Year householder moved into unit - Moved in 1995 to 1998 (%) - White
Year householder moved into unit - Moved in 1995 to 1998 (%) - Black or African American
Year householder moved into unit - Moved in 1995 to 1998 (%) - Asian
Year householder moved into unit - Moved in 1995 to 1998 (%) - Hispanic or Latino
Year householder moved into unit - Moved in 1995 to 1998 (%) - American Indian and Alaska Native
Year householder moved into unit - Moved in 1995 to 1998 (%) - Multirace
Year householder moved into unit - Moved in 1995 to 1998 (%) - Other Race
Year householder moved into unit - Moved in 1990 to 1994 (%)
Year householder moved into unit - Moved in 1990 to 1994 (%) - White
Year householder moved into unit - Moved in 1990 to 1994 (%) - Black or African American
Year householder moved into unit - Moved in 1990 to 1994 (%) - Asian
Year householder moved into unit - Moved in 1990 to 1994 (%) - Hispanic or Latino
Year householder moved into unit - Moved in 1990 to 1994 (%) - American Indian and Alaska Native
Year householder moved into unit - Moved in 1990 to 1994 (%) - Multirace
Year householder moved into unit - Moved in 1990 to 1994 (%) - Other Race
Year householder moved into unit - Moved in 1980 to 1989 (%)
Year householder moved into unit - Moved in 1980 to 1989 (%) - White
Year householder moved into unit - Moved in 1980 to 1989 (%) - Black or African American
Year householder moved into unit - Moved in 1980 to 1989 (%) - Asian
Year householder moved into unit - Moved in 1980 to 1989 (%) - Hispanic or Latino
Year householder moved into unit - Moved in 1980 to 1989 (%) - American Indian and Alaska Native
Year householder moved into unit - Moved in 1980 to 1989 (%) - Multirace
Year householder moved into unit - Moved in 1980 to 1989 (%) - Other Race
Year householder moved into unit - Moved in 1970 to 1979 (%)
Year householder moved into unit - Moved in 1970 to 1979 (%) - White
Year householder moved into unit - Moved in 1970 to 1979 (%) - Black or African American
Year householder moved into unit - Moved in 1970 to 1979 (%) - Asian
Year householder moved into unit - Moved in 1970 to 1979 (%) - Hispanic or Latino
Year householder moved into unit - Moved in 1970 to 1979 (%) - American Indian and Alaska Native
Year householder moved into unit - Moved in 1970 to 1979 (%) - Multirace
Year householder moved into unit - Moved in 1970 to 1979 (%) - Other Race
Year householder moved into unit - Moved in 1969 or earlier (%)
Year householder moved into unit - Moved in 1969 or earlier (%) - White
Year householder moved into unit - Moved in 1969 or earlier (%) - Black or African American
Year householder moved into unit - Moved in 1969 or earlier (%) - Asian
Year householder moved into unit - Moved in 1969 or earlier (%) - Hispanic or Latino
Year householder moved into unit - Moved in 1969 or earlier (%) - American Indian and Alaska Native
Year householder moved into unit - Moved in 1969 or earlier (%) - Multirace
Year householder moved into unit - Moved in 1969 or earlier (%) - Other Race
Housing units lacking complete plumbing facilities (%)
Housing units lacking complete kitchen facilities (%)
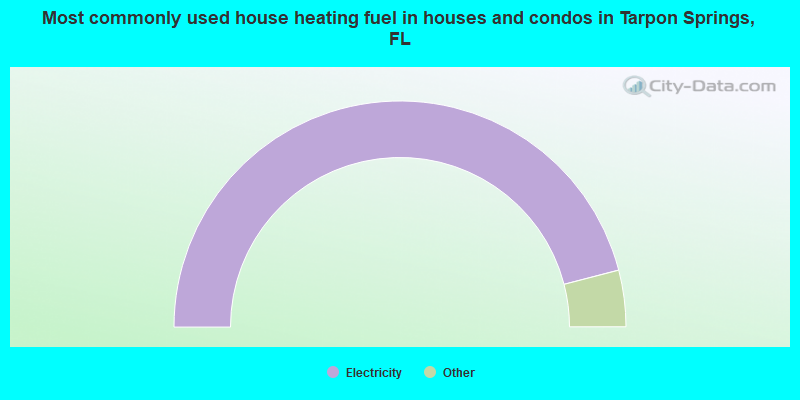
House heating fuel used in houses and condos - Utility gas (%)
House heating fuel used in houses and condos - Bottled, tank, or LP gas (%)
House heating fuel used in houses and condos - Electricity (%)
House heating fuel used in houses and condos - Fuel oil, kerosene, etc. (%)
House heating fuel used in houses and condos - Coal or coke (%)
House heating fuel used in houses and condos - Wood (%)
House heating fuel used in houses and condos - Solar energy (%)
House heating fuel used in houses and condos - Other fuel (%)
House heating fuel used in houses and condos - No fuel used (%)
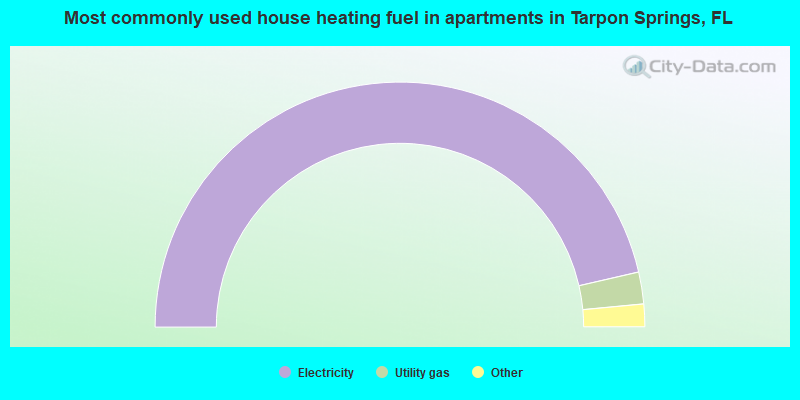
House heating fuel used in apartments - Utility gas (%)
House heating fuel used in apartments - Bottled, tank, or LP gas (%)
House heating fuel used in apartments - Electricity (%)
House heating fuel used in apartments - Fuel oil, kerosene, etc. (%)
House heating fuel used in apartments - Coal or coke (%)
House heating fuel used in apartments - Wood (%)
House heating fuel used in apartments - Solar energy (%)
House heating fuel used in apartments - Other fuel (%)
House heating fuel used in apartments - No fuel used (%)
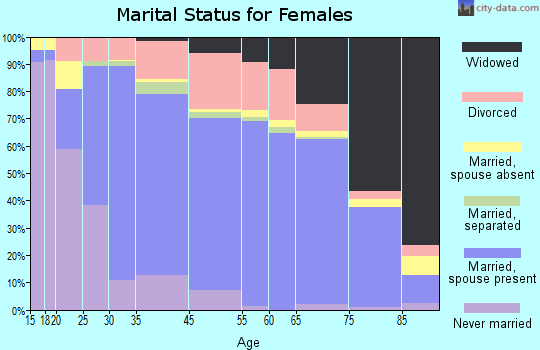
Median year house/condo built: 1985Median year apartment built: 1985Household type by relationship:
Households: 25,403
Male householders: 5,293 (1,954 living alone ), Female householders: 6,028 (2,201 living alone )4,970 spouses (4,958 opposite-sex spouses ), 652 unmarried partners , (632 opposite-sex unmarried partners ), 5,696 children (5,321 natural , 141 adopted , 234 stepchildren ), 519 grandchildren , 167 brothers or sisters , 559 parents , 0 foster children , 434 other relatives , 533 non-relatives In group quarters: 548
Size of family households: 3,674 2-persons , 1,352 3-persons , 816 4-persons , 208 5-persons , 42 6-persons , 88 7-or-more-persons .
Size of nonfamily households: 4,501 1-person , 725 2-persons , 42 3-persons .
1,734 married couples with children. single-parent households (204 men , 867 women ).
83.0% of residents of Tarpon Springs speak English at home. of residents speak Spanish at home (49% speak English very well , 24% speak English well , 21% speak English not well , 7% don't speak English at all ).of residents speak other Indo-European language at home (74% speak English very well , 15% speak English well , 8% speak English not well , 3% don't speak English at all ).of residents speak Asian or Pacific Island language at home (36% speak English very well , 46% speak English well , 18% speak English not well ).of residents speak other language at home (76% speak English very well , 24% speak English well ).
Foreign born population: 2,980 (11.7%)of them are naturalized citizens )
Median number of rooms in houses and condos:
Median number of rooms in apartments
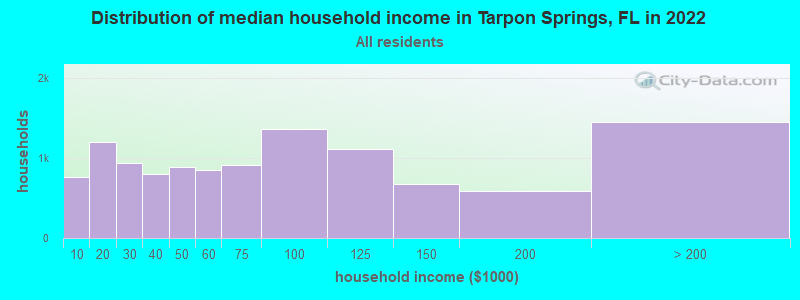
Tarpon Springs, FL household income distribution 762 Less than $10,0001,197 $10,000 to $19,999936 $20,000 to $29,999798 $30,000 to $39,999889 $40,000 to $49,999843 $50,000 to $59,999912 $60,000 to $74,9991,357 $75,000 to $99,9991,117 $100,000 to $124,999671 $125,000 to $149,999588 $150,000 to $199,9991,448 $200,000 or more
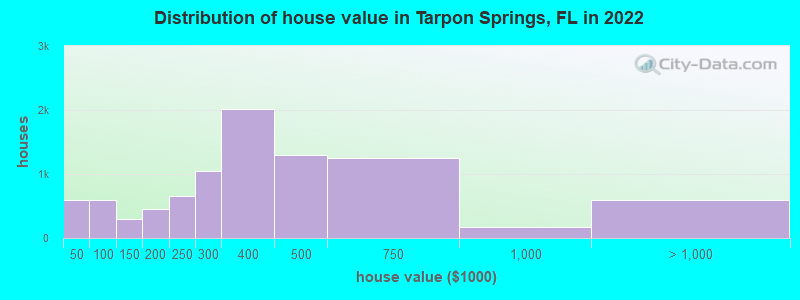
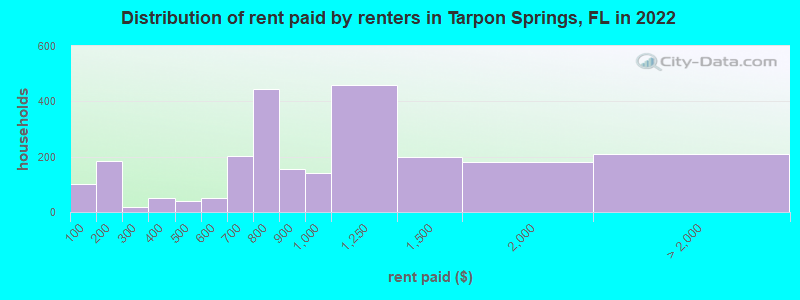
Home value of owner - occupied houses in 2022 in Tarpon Springs, FL 53 Less than $10,000151 $10,000 to $14,99940 $15,000 to $19,99933 $20,000 to $24,99979 $25,000 to $29,999173 $30,000 to $34,99915 $35,000 to $39,99947 $40,000 to $49,999114 $50,000 to $59,99996 $60,000 to $69,999197 $70,000 to $79,999100 $80,000 to $89,99932 $90,000 to $99,999155 $100,000 to $124,999145 $125,000 to $149,999264 $150,000 to $174,999191 $175,000 to $199,999651 $200,000 to $249,9991,049 $250,000 to $299,9992,021 $300,000 to $399,9991,296 $400,000 to $499,9991,245 $500,000 to $749,999164 $750,000 to $999,999346 $1,000,000 to $1,499,999112 $1,500,000 to $1,999,999140 $2,000,000 or moreRent paid by renters in 2022 in Tarpon Springs, FL 99 Less than $10015 $100 to $149169 $150 to $19917 $200 to $24948 $300 to $34941 $450 to $4999 $500 to $54942 $550 to $599201 $650 to $699343 $700 to $74999 $750 to $799153 $800 to $899139 $900 to $999459 $1,000 to $1,249198 $1,250 to $1,499181 $1,500 to $1,99923 $2,000 to $2,49944 $2,500 to $2,999143 No cash rent
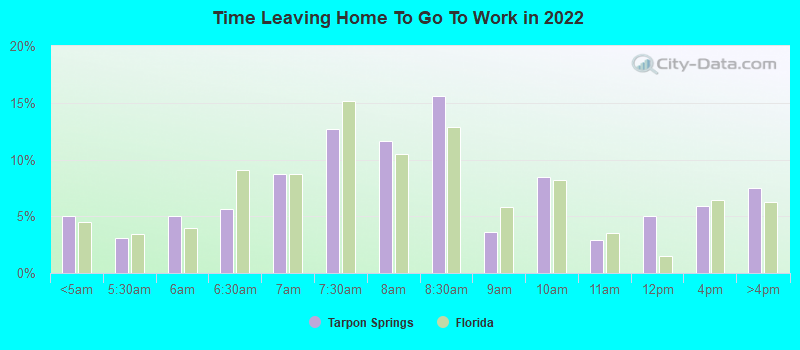
Percentage of workers working in this county: 79.5%Number of people working at home: 2,543 (24.3% of all workers )
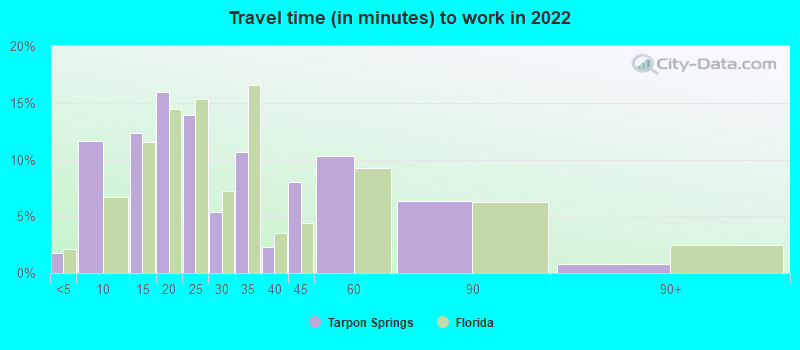
Travel time to work (commute)
Less than 5 minutes: 3045 to 9 minutes: 80310 to 14 minutes: 45915 to 19 minutes: 87720 to 24 minutes: 93525 to 29 minutes: 37930 to 34 minutes: 1,17035 to 39 minutes: 19240 to 44 minutes: 52045 to 59 minutes: 1,15960 to 89 minutes: 94590 or more minutes: 386
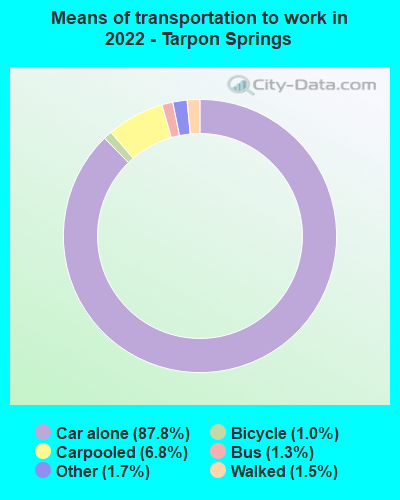
Means of transportation to work:
Drove a car alone: 7,143 (66.5%)Carpooled: 646 (6.0%)Bus : 112 (1.0%)Taxi: 166 (1.5%)Bicycle: 99 (0.9%)Walked: 128 (1.2%)Worked at home: 2,543 (23.7%)
Unemployment by race in 2022
Unemployment rate for White non-Hispanic residents 3.9% Males4.3% FemalesUnemployment rate for Black residents 15.2% Males14.5% FemalesUnemployment rate for Asian residents 9.1% MalesUnemployment rate for other race residents 9.9% FemalesUnemployment rate for two or more race residents 11.2% FemalesUnemployment rate for Hispanic or Latino residents 13.6% Females
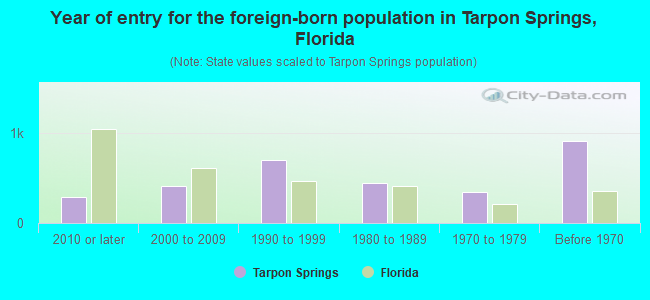
Year of entry for the foreign-born population in Tarpon Springs, Florida
288 2010 or later 407 2000 to 2009 706 1990 to 1999 446 1980 to 1989 341 1970 to 1979 907 Before 1970
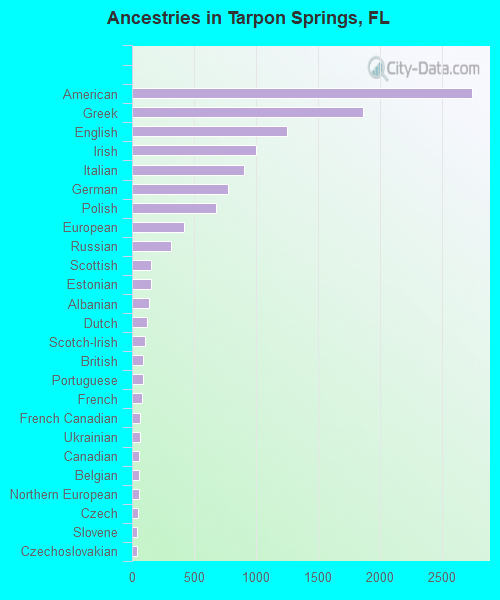
First ancestries reported:
American: 2,744 (19.7%)
Greek: 1,868 (13.4%)
English: 1,247 (9.0%)
Irish: 998 (7.2%)
Italian: 901 (6.5%)
German: 771 (5.5%)
Polish: 675 (4.8%)
European: 422 (3.0%)
Russian: 317 (2.3%)
Scottish: 155 (1.1%)
Estonian: 153 (1.1%)
Albanian: 138 (1.0%)
Dutch: 124 (0.9%)
Scotch-Irish: 101 (0.7%)
British: 92 (0.7%)
Portuguese: 85 (0.6%)
French: 83 (0.6%)
French Canadian: 61 (0.4%)
Ukrainian: 61 (0.4%)
Canadian: 59 (0.4%)
Belgian: 57 (0.4%)
Northern European: 55 (0.4%)
Czech: 51 (0.4%)
Slovene: 43 (0.3%)
Czechoslovakian: 41 (0.3%)
Jamaican: 39 (0.3%)
Eastern European: 34 (0.2%)
Norwegian: 28 (0.2%)
Swiss: 25 (0.2%)
Cypriot: 22 (0.2%)
Romanian: 14 (0.1%)
Haitian: 14 (0.1%)
Macedonian: 13 (0.09%)
Croatian: 13 (0.09%)
Latvian: 12 (0.09%)
Swedish: 12 (0.09%)
Carpatho Rusyn: 10 (0.07%)
Iranian: 10 (0.07%)
Pennsylvania German: 9 (0.06%)
Serbian: 9 (0.06%)
Brazilian: 3 (0.02%) Most common places of birth for foreign-born residents (%): Greece Tarpon Springs:
21.6% (651)Florida:
0.2% (8,980)
Canada Tarpon Springs:
11.7% (351)Florida:
2.4% (109,132)
Colombia Tarpon Springs:
6.4% (192)Florida:
6.5% (298,669)
Other Eastern Europe Tarpon Springs:
6.3% (191)Florida:
0.2% (9,990)
Poland Tarpon Springs:
6.2% (187)Florida:
0.6% (25,219)
Germany Tarpon Springs:
3.2% (96)Florida:
1.2% (54,272)
Dominican Republic Tarpon Springs:
3.2% (96)Florida:
3.0% (137,727)
Haiti Tarpon Springs:
3.0% (89)Florida:
7.5% (342,375)
Netherlands Tarpon Springs:
2.6% (78)Florida:
0.2% (8,103)
Argentina Tarpon Springs:
2.6% (77)Florida:
1.3% (57,263)
Ecuador Tarpon Springs:
2.4% (73)Florida:
1.2% (54,585)
Albania Tarpon Springs:
2.3% (70)Florida:
0.2% (9,779)
Jamaica Tarpon Springs:
2.2% (66)Florida:
5.0% (227,319)
Mexico Tarpon Springs:
2.0% (61)Florida:
5.6% (257,152)
Philippines Tarpon Springs:
1.7% (50)Florida:
1.8% (84,403)
Brazil Tarpon Springs:
1.6% (49)Florida:
2.7% (122,906)
Place of birth for U.S.-born residents:
This state: 7,155Other state: 14,344Northeast: 6,177Midwest: 4,093South: 3,142West: 926 87.9% of Tarpon Springs residents lived in the same house 1 years ago.
Out of people who lived in different houses, 25.1% lived in this county.
Out of people who lived in different counties, 42.2% lived in Florida.
Tarpon Springs:
87.9%State average:
86.3%
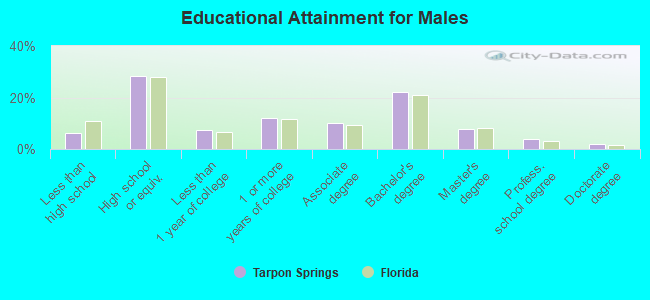
Education attainment for males 25 years and older:
No schooling: 72Nursery to 4th grade: 05th and 6th grade: 307th and 8th grade: 189th grade: 4310th grade: 10511th grade: 5412th grade, no diploma: 270High school graduate (or equivalency): 2,789Less than 1 year of college: 743Some college more than 1 year, no degree: 1,192Associate degree: 989Bachelor's degree: 2,191Master's degree: 757Professional school degree: 395Doctorate degree: 185
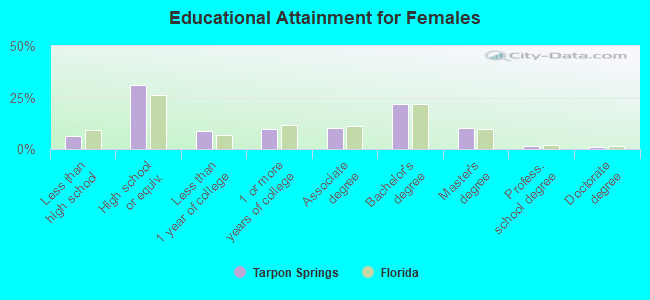
Education attainment for females 25 years and older:
No schooling: 74Nursery to 4th grade: 1875th and 6th grade: 67th and 8th grade: 1089th grade: 5710th grade: 9511th grade: 5612th grade, no diploma: 105High school graduate (or equivalency): 3,304Less than 1 year of college: 954Some college more than 1 year, no degree: 1,017Associate degree: 1,067Bachelor's degree: 2,350Master's degree: 1,071Professional school degree: 179Doctorate degree: 83
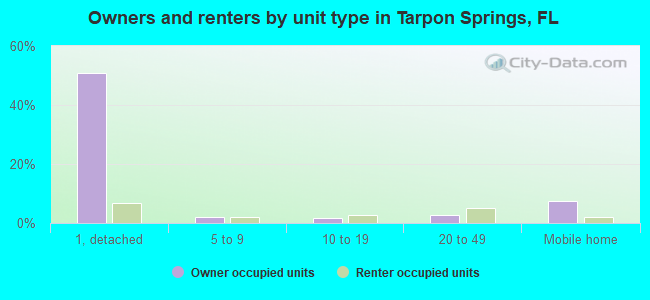
Housing units in structures:
One, detached: 7,515One, attached: 1,012Two: 3993 or 4: 7495 to 9: 61310 to 19: 42220 to 49: 96350 or more: 254Mobile homes: 1,179Boats, RVs, vans, etc.: 29Median worth of mobile homes: $72,813
Housing units lacking complete plumbing facilities in 2022: 0.4%Housing units lacking complete kitchen facilities in 2022: 0.9%House/condo owner moved in on average 9 years ago
Renter moved in on average 4 years ago
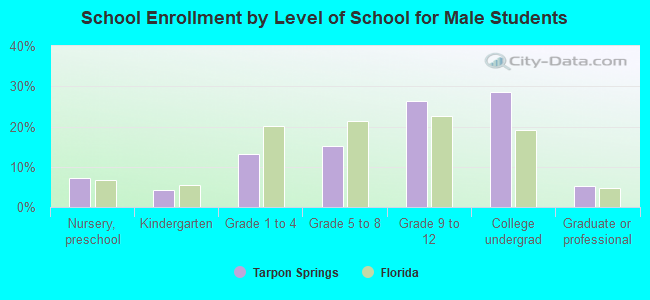
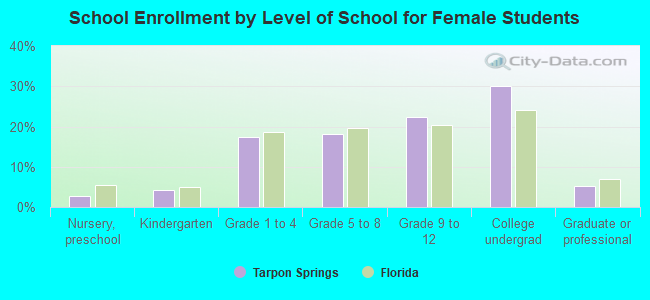
Private vs. public school enrollment:
Students in private schools in grades 1 to 8 (elementary and middle school): 149 Students in private schools in grades 9 to 12 (high school): 58 Students in private undergraduate colleges: 189