Tamiami, FL (Florida) Houses and Residents
| Tamiami: | $485,394 |
| Florida: | $354,100 |
Mean price in 2022:
Detached houses: $626,214
Here: $626,214 State: $500,941 Townhouses or other attached units: $381,556
Here: $381,556 State: $370,869 In 2-unit structures: $515,424
Here: $515,424 State: $423,188 In 3-to-4-unit structures: $264,042
Here: $264,042 State: $309,944 In 5-or-more-unit structures: $246,739
Here: $246,739 State: $447,145 Mobile homes: $92,778
Here: $92,778 State: $113,202
Total population: 55,271 (Urban population: 54,745, Rural population: 0)
Houses: 18,717 (18,108 occupied: 13,381 owner occupied, 4,967 renter occupied)
| % of renters here: | 27% |
| State: | 33% |
Housing density: 2,549 houses/condos per square mile
Median price asked for vacant for-sale houses and condos in 2022: $510,582.
Median contract rent in 2022: $1,796 (lower quartile is $1,483, upper quartile is over $2,000)
Median rent asked for vacant for-rent units in 2022: $1,918
Median gross rent in Tamiami, FL in 2022: $1,895
Housing units in Tamiami with a mortgage: 6,845 (505 second mortgage, 4 home equity loan, 479 both second mortgage and home equity loan)
Houses without a mortgage: 388
Median household income for houses/condos with a mortgage: $101,545
Median household income for apartments without a mortgage: $67,147
Median monthly housing costs: $1,623
Compare current foreclosures near Tamiami, FL:
| Photo | Address | Area | Beds / Baths | Price | Details |
|---|---|---|---|---|---|

|
#1
E 35th St
Hialeah, FL 33013
|
1,690 sq. feet
|
1 baths 2 beds |
$436,000
|
show details |

|
#2
NE 1st Ave Unit #2200
Miami, FL 33132
|
- sq. feet
|
2 baths 1 beds |
$715,000
|
show details |

|
#3
E 8th Ln
Hialeah, FL 33013
|
1,696 sq. feet
|
1 baths 3 beds |
show details | |

|
#4
Lenox Ave Apt 17
Miami Beach, FL 33139
|
569 sq. feet
|
1 baths 1 beds |
show details | |

|
#5
NE 2nd Ave
Miami, FL 33132
|
662 sq. feet
|
1 baths 1 beds |
show details | |

|
#6
E 20th St
Hialeah, FL 33013
|
1,444 sq. feet
|
1 baths 2 beds |
show details | |

|
#7
SW 144th Ct
Miami, FL 33186
|
2,084 sq. feet
|
2 baths 4 beds |
show details | |

|
#8
SW 8t 406a
Miami, FL 33144
|
934 sq. feet
|
2 baths 2 beds |
show details | |

|
#9
SW 148th Pl
Miami, FL 33196
|
1,763 sq. feet
|
2 baths 3 beds |
show details | |

|
#10
SW 87th Pl Dr
Miami, FL 33165
|
1,545 sq. feet
|
2 baths 3 beds |
show details |
| Photo | Address | Area | Beds / Baths | Price | Details |
|---|---|---|---|---|---|

|
#11
SW 148th Path
Miami, FL 33196
|
1,371 sq. feet
|
2 baths 3 beds |
show details | |

|
#12
- 830 NW 23rd Ct
Miami, FL 33125
|
- sq. feet
|
4 baths 6 beds |
show details | |

|
#13
SW 26th St
Miami, FL 33165
|
2,150 sq. feet
|
3 baths 3 beds |
show details | |

|
#14
SW 38th Ln
Miami, FL 33165
|
1,233 sq. feet
|
2 baths 2 beds |
show details | |

|
#15
NW 111th St
Hialeah, FL 33012
|
2,540 sq. feet
|
3 baths 5 beds |
show details | |

|
#16
SW 79th St # 7
Miami, FL 33143
|
768 sq. feet
|
1 baths 1 beds |
show details | |

|
#17
Marine Dr
Miami, FL 33189
|
2,198 sq. feet
|
3 baths 4 beds |
show details | |

|
#18
SW 122nd St
Miami, FL 33186
|
2,310 sq. feet
|
3 baths 4 beds |
show details | |

|
#19
SW 9th Ln
Miami, FL 33194
|
1,775 sq. feet
|
3 baths 3 beds |
show details | |

|
#20
SW 161st Ave
Miami, FL 33196
|
1,972 sq. feet
|
2 baths 3 beds |
show details |
| Photo | Address | Area | Beds / Baths | Price | Details |
|---|---|---|---|---|---|

|
#21
NW 42nd Ave Apt 407
Miami, FL 33126
|
958 sq. feet
|
2 baths 2 beds |
show details | |

|
#22
NW 102nd St
Miami, FL 33147
|
1,501 sq. feet
|
2 baths 4 beds |
show details | |

|
#23
SW 117th Ct
Miami, FL 33175
|
2,047 sq. feet
|
3 baths 4 beds |
show details | |

|
#24
SW 153rd Ter
Miami, FL 33177
|
1,842 sq. feet
|
2 baths 4 beds |
show details | |

|
#25
NW 136th Ct
Miami, FL 33182
|
2,605 sq. feet
|
2 baths 4 beds |
show details | |

|
#26
E 9th Ct
Hialeah, FL 33013
|
1,541 sq. feet
|
1 baths 3 beds |
show details | |

|
#27
SW 19th St
Miami, FL 33145
|
2,689 sq. feet
|
3 baths 5 beds |
show details | |

|
#28
SW 145th St
Miami, FL 33176
|
4,070 sq. feet
|
4 baths 4 beds |
show details | |

|
#29
SW 28th St
Hollywood, FL 33027
|
3,610 sq. feet
|
3 baths 5 beds |
show details | |

|
#30
NW 10th Ave
Miami, FL 33128
|
2,973 sq. feet
|
1 baths 2 beds |
show details |
| Photo | Address | Area | Beds / Baths | Price | Details |
|---|---|---|---|---|---|

|
#31
SW 3rd Ave
Miami, FL 33145
|
1,666 sq. feet
|
3 baths 3 beds |
show details | |

|
#32
SW 31st St
Miami, FL 33155
|
2,110 sq. feet
|
3 baths 3 beds |
show details | |

|
#33
SW 54th Ct
Hollywood, FL 33027
|
3,077 sq. feet
|
4 baths 4 beds |
show details | |

|
#34
NW 177th St Apt 107
Hialeah, FL 33015
|
967 sq. feet
|
2 baths 2 beds |
show details | |

|
#35
SW 107th Pl
Miami, FL 33157
|
2,196 sq. feet
|
2 baths 3 beds |
show details | |

|
#36
W 28th Ct Unit 106
Hialeah, FL 33018
|
850 sq. feet
|
2 baths 2 beds |
show details | |

|
#37
NW 19th 354
Miami, FL 33136
|
1,114 sq. feet
|
1 baths 4 beds |
show details | |

|
#38
SW 2nd Ct
Miami, FL 33129
|
1,060 sq. feet
|
1 baths 2 beds |
show details | |

|
#39
SW 198th Ter
Miami, FL 33157
|
1,563 sq. feet
|
2 baths 3 beds |
show details | |

|
#40
E 18th St
Hialeah, FL 33013
|
1,890 sq. feet
|
2 baths 3 beds |
show details |
| Photo | Address | Area | Beds / Baths | Price | Details |
|---|---|---|---|---|---|

|
#41
W 71st Pl
Hialeah, FL 33016
|
1,260 sq. feet
|
2 baths 3 beds |
show details | |

|
#42
SW 106th Ave
Miami, FL 33189
|
1,601 sq. feet
|
1 baths 3 beds |
show details | |

|
#43
NW 48th Ln
Miami, FL 33178
|
- sq. feet
|
2 baths 3 beds |
show details | |

|
#44
SW 14th Ter
Miami, FL 33144
|
1,217 sq. feet
|
1 baths 3 beds |
show details | |

|
#45
SW 204th St
Miami, FL 33177
|
1,254 sq. feet
|
2 baths 4 beds |
show details | |

|
#46
NW 27th St
Miami, FL 33127
|
1,048 sq. feet
|
1 baths 2 beds |
show details | |

|
#47
NW 76th Ter
Miami, FL 33147
|
1,135 sq. feet
|
1 baths 2 beds |
show details | |

|
#48
SW 203rd St
Miami, FL 33189
|
1,118 sq. feet
|
1 baths 3 beds |
show details | |

|
#49
SW 200th Ter
Miami, FL 33189
|
1,375 sq. feet
|
2 baths 4 beds |
show details | |

|
Check over 1 million property listings on Foreclosure.com!
|
browse all offers | |||

Latest news about housing in Tamiami, FL collected exclusively by city-data.com from local newspapers, TV, and radio stations


Median year apartment built: 1988
Household type by relationship:
Households: 52,567- Male householders: 8,150 (1,011 living alone), Female householders: 9,528 (1,800 living alone)
8,905 spouses (8,820 opposite-sex spouses), 1,680 unmarried partners, (1,468 opposite-sex unmarried partners), 13,533 children (12,882 natural, 137 adopted, 513 stepchildren), 2,168 grandchildren, 835 brothers or sisters, 2,950 parents, 79 foster children, 2,968 other relatives, 1,411 non-relatives
- In group quarters: 357
Size of family households: 5,116 2-persons, 3,972 3-persons, 2,700 4-persons, 1,277 5-persons, 746 6-persons, 303 7-or-more-persons.
Size of nonfamily households: 3,013 1-person, 1,014 2-persons, 52 3-persons, 45 4-persons, 11 5-persons.
4,352 married couples with children.
1,838 single-parent households (200 men, 1,638 women).
7.7% of residents of Tamiami speak English at home.
90.4% of residents speak Spanish at home (55% speak English very well, 18% speak English well, 16% speak English not well, 11% don't speak English at all).
1.0% of residents speak other Indo-European language at home (75% speak English very well, 24% speak English well, 1% speak English not well, 1% don't speak English at all).
0.4% of residents speak Asian or Pacific Island language at home (57% speak English very well, 32% speak English well, 4% speak English not well, 7% don't speak English at all).
0.1% of residents speak other language at home (100% speak English very well).
Foreign born population: 35,337 (67.2%)
(71.3% of them are naturalized citizens)
| Here: | 5.7 |
| State: | 5.9 |
| Here: | 4.5 |
| State: | 4.2 |

- Bedrooms in owner-occupied houses and condos in Tamiami, Florida
- 141no bedroom
- 1191 bedroom
- 2,2042 bedrooms
- 6,7113 bedrooms
- 3,6014 bedrooms
- 6055+ bedrooms

- Bedrooms in renter-occupied apartments in Tamiami, Florida
- 162no bedroom
- 2611 bedroom
- 2,4322 bedrooms
- 1,5683 bedrooms
- 3954 bedrooms
- 1495+ bedrooms

- Cars and other vehicles available in Tamiami in owner-occupied houses/condos
- 394no vehicle
- 3,3001 vehicle
- 5,3742 vehicles
- 3,0603 vehicles
- 9504 vehicles
- 3025+ vehicles

- Cars and other vehicles available in Tamiami in renter-occupied apartments
- 342no vehicle
- 1,9891 vehicle
- 1,6042 vehicles
- 7333 vehicles
- 2504 vehicles
- 505+ vehicles

- Rooms in owner-occupied houses in Tamiami, Florida
- 351 room
- 732 rooms
- 5283 rooms
- 2,1954 rooms
- 3,1795 rooms
- 3,3306 rooms
- 1,8627 rooms
- 1,2458 rooms
- 9349+ rooms

- Rooms in renter-occupied apartments in Tamiami, Florida
- 1531 room
- 1032 rooms
- 7253 rooms
- 1,4464 rooms
- 1,3775 rooms
- 6176 rooms
- 2577 rooms
- 2258 rooms
- 649+ rooms


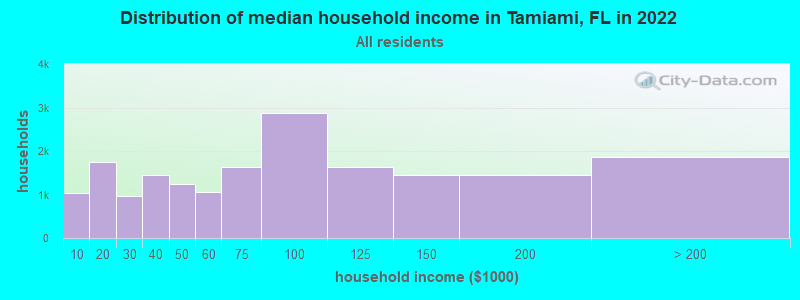
Tamiami, FL household income distribution

- 1,028Less than $10,000
- 1,747$10,000 to $19,999
- 963$20,000 to $29,999
- 1,444$30,000 to $39,999
- 1,233$40,000 to $49,999
- 1,056$50,000 to $59,999
- 1,636$60,000 to $74,999
- 2,879$75,000 to $99,999
- 1,632$100,000 to $124,999
- 1,451$125,000 to $149,999
- 1,438$150,000 to $199,999
- 1,873$200,000 or more
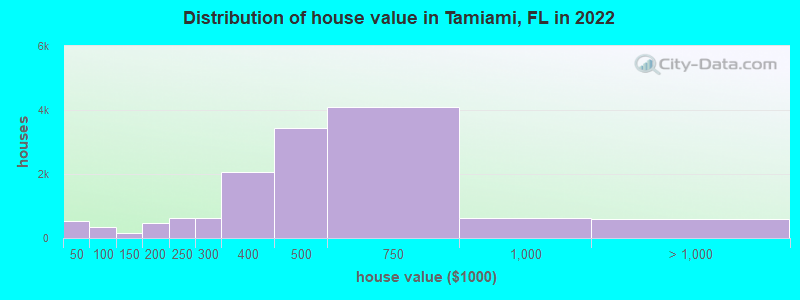
Home value of owner - occupied houses in 2022 in Tamiami, FL
-
- 174Less than $10,000
- 13$10,000 to $14,999
- 11$15,000 to $19,999
- 125$20,000 to $24,999
- 49$25,000 to $29,999
- 73$30,000 to $34,999
- 81$40,000 to $49,999
- 6$50,000 to $59,999
- 46$60,000 to $69,999
- 58$70,000 to $79,999
- 36$80,000 to $89,999
- 110$90,000 to $99,999
- 98$100,000 to $124,999
- 42$125,000 to $149,999
- 350$150,000 to $174,999
- 111$175,000 to $199,999
- 618$200,000 to $249,999
- 616$250,000 to $299,999
- 2,060$300,000 to $399,999
- 3,446$400,000 to $499,999
- 4,092$500,000 to $749,999
- 628$750,000 to $999,999
- 495$1,000,000 to $1,499,999
- 70$1,500,000 to $1,999,999
- 41$2,000,000 or more
Rent paid by renters in 2022 in Tamiami, FL
-
- 48$150 to $199
- 13$300 to $349
- 26$400 to $449
- 22$550 to $599
- 20$600 to $649
- 5$750 to $799
- 61$800 to $899
- 81$900 to $999
- 358$1,000 to $1,249
- 655$1,250 to $1,499
- 2,360$1,500 to $1,999
- 872$2,000 to $2,499
- 262$2,500 to $2,999
- 24$3,000 to $3,499
- 56$3,500 or more
- 191No cash rent


Percentage of workers working in this county: 96.6%
Number of people working at home: 2,603 (9.4% of all workers)
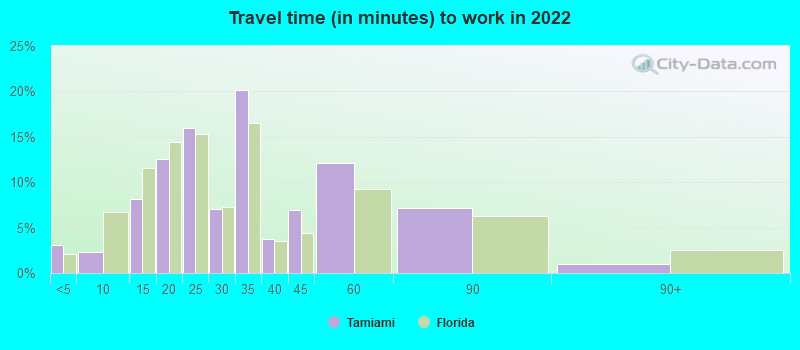
Travel time to work (commute)
- Less than 5 minutes: 151
- 5 to 9 minutes: 546
- 10 to 14 minutes: 1,046
- 15 to 19 minutes: 2,547
- 20 to 24 minutes: 3,903
- 25 to 29 minutes: 1,746
- 30 to 34 minutes: 4,847
- 35 to 39 minutes: 905
- 40 to 44 minutes: 1,800
- 45 to 59 minutes: 4,130
- 60 to 89 minutes: 2,213
- 90 or more minutes: 527
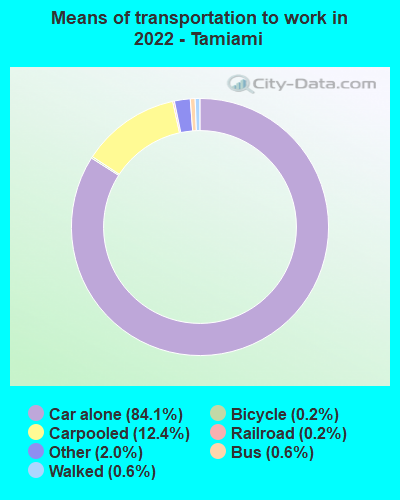
Means of transportation to work:
- Drove a car alone: 7,283 (65.4%)
- Carpooled: 1,208 (10.8%)
- Bus: 45 (0.4%)
- Light rail, streetcar or trolley: 25 (0.2%)
- Taxi: 220 (2.0%)
- Bicycle: 17 (0.2%)
- Walked: 64 (0.6%)
- Worked at home: 2,603 (23.4%)

- Unemployment by race in 2022
- Unemployment rate for White non-Hispanic residents
- 1.3%Males
- 3.9%Females
- Unemployment rate for other race residents
- 3.2%Males
- 3.7%Females
- Unemployment rate for two or more race residents
- 3.1%Males
- 3.1%Females
- Unemployment rate for Hispanic or Latino residents
- 2.5%Males
- 2.6%Females

- Year of entry for the foreign-born population in Tamiami, Florida
- 10,3462010 or later
- 7,1422000 to 2009
- 5,2011990 to 1999
- 9,8291980 to 1989
- 4,8891970 to 1979
- 10,887Before 1970

First ancestries reported:
- American: 516 (1.3%)
- European: 179 (0.5%)
- Brazilian: 162 (0.4%)
- Italian: 145 (0.4%)
- English: 101 (0.3%)
- German: 83 (0.2%)
- Trinidadian and Tobagonian: 55 (0.1%)
- Irish: 44 (0.1%)
- Jordanian: 40 (0.1%)
- Lebanese: 39 (0.1%)
- French: 36 (0.09%)
- Romanian: 36 (0.09%)
- Russian: 30 (0.08%)
- Belizean: 27 (0.07%)
- Scotch-Irish: 23 (0.06%)
- Egyptian: 19 (0.05%)
- Polish: 17 (0.04%)
- Haitian: 17 (0.04%)
- British: 15 (0.04%)
- Israeli: 15 (0.04%)
- French Canadian: 13 (0.03%)
- Austrian: 11 (0.03%)
- Ukrainian: 11 (0.03%)
- Iranian: 10 (0.03%)
- Danish: 8 (0.02%)
- Jamaican: 7 (0.02%)
- Canadian: 2 (0.01%)
Most common places of birth for foreign-born residents (%):
| Tamiami: | 68.1% (24,063) |
| Florida: | 22.0% (1,006,576) |
| Tamiami: | 6.2% (2,199) |
| Florida: | 2.3% (105,066) |
| Tamiami: | 6.0% (2,128) |
| Florida: | 5.7% (262,042) |
| Tamiami: | 4.4% (1,567) |
| Florida: | 6.5% (298,669) |
| Tamiami: | 2.1% (734) |
| Florida: | 2.1% (96,693) |
| Tamiami: | 1.5% (543) |
| Florida: | 1.2% (54,585) |
Place of birth for U.S.-born residents:
- This state: 12,656
- Other state: 2,836
- Northeast: 1,662
- Midwest: 286
- South: 467
- West: 439
93.2% of Tamiami residents lived in the same house 1 years ago.
Out of people who lived in different houses, 43.9% lived in this county.
Out of people who lived in different counties, 49.0% lived in Florida.
| Tamiami: | 93.2% |
| State average: | 86.3% |
Education attainment for males 25 years and older:
- No schooling: 406
- Nursery to 4th grade: 177
- 5th and 6th grade: 122
- 7th and 8th grade: 213
- 9th grade: 182
- 10th grade: 184
- 11th grade: 350
- 12th grade, no diploma: 1,853
- High school graduate (or equivalency): 4,982
- Less than 1 year of college: 787
- Some college more than 1 year, no degree: 1,843
- Associate degree: 920
- Bachelor's degree: 4,338
- Master's degree: 1,278
- Professional school degree: 682
- Doctorate degree: 258

Education attainment for females 25 years and older:
- No schooling: 469
- Nursery to 4th grade: 146
- 5th and 6th grade: 319
- 7th and 8th grade: 306
- 9th grade: 350
- 10th grade: 57
- 11th grade: 108
- 12th grade, no diploma: 1,807
- High school graduate (or equivalency): 6,346
- Less than 1 year of college: 572
- Some college more than 1 year, no degree: 1,521
- Associate degree: 1,736
- Bachelor's degree: 5,698
- Master's degree: 1,593
- Professional school degree: 540
- Doctorate degree: 251


Housing units in structures:
- One, detached: 10,674
- One, attached: 2,829
- Two: 98
- 3 or 4: 284
- 5 to 9: 262
- 10 to 19: 474
- 20 to 49: 708
- 50 or more: 2,258
- Mobile homes: 1,108
- Boats, RVs, vans, etc.: 18
Housing units lacking complete kitchen facilities in 2022: 1.1%
House/condo owner moved in on average 16 years ago
Renter moved in on average 2 years ago

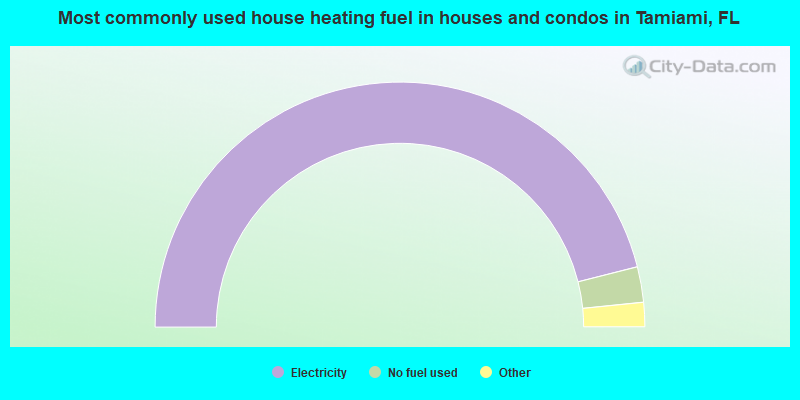
- 92.1%Electricity
- 4.7%No fuel used
- 2.5%Utility gas
- 0.6%Bottled, tank, or LP gas
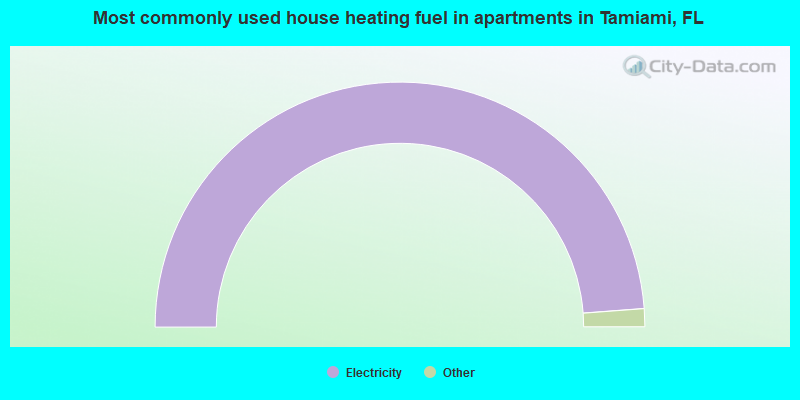
- 97.7%Electricity
- 1.6%No fuel used
- 0.5%Utility gas
- 0.2%Bottled, tank, or LP gas
Private vs. public school enrollment:
| Here: | 15.8% |
| Florida: | 15.8% |
| Here: | 21.2% |
| Florida: | 12.9% |
| Here: | 15.3% |
| Florida: | 23.6% |


